An EEG Severity Index of Traumatic Brain Injury
Abstract
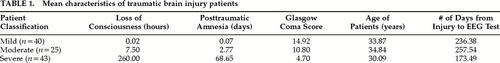
EEG spectral analyses were conducted from 19 scalp locations for patients with mild (n=40), moderate (n=25), and severe (n=43) traumatic brain injury (TBI), 15 days to 4 years after injury. Severity of TBI was judged by emergency hospital admission records (Glasgow Coma Score and duration of coma and amnesia). Highest-loading EEG variables on each factor that differed significantly between severe and mild TBI by univariate t-test were entered into a multivariate discriminant analysis, yielding 16 variables. Discriminant analysis between mild and severe TBI groups showed classification accuracy of 96.39%, sensitivity 95.45%, and specificity 97.44%. The EEG discriminant score also measured intermediate severity in moderate TBI patients. Results were cross-validated in 503 VA patients. Significant correlations between EEG discriminant scores, emergency admission measures, and post-trauma neuropsychological test scores validated the discriminant function as an index of severity of injury and a classifier of the extremes of severity.
The incidence of traumatic brain injury (TBI) is approximately two million Americans per year, at an estimated overall cost of 38 billion dollars annually.1–3 The wide array of problems that confront those with TBI includes headache, fatigue, impaired memory, reduced concentration and attention, reduced information processing capacity, depression, aggression, anxiety, irritability, sleep disturbances, and sexual dysfunction.4–6 There are also reports of posttraumatic personality changes, such as temper outbursts, self-centered behavior, emotional lability, and reduced social awareness, which are thought to be associated with frontal and temporal lobe damage.7,8
Accurate diagnoses and prognoses of the consequences of traumatic brain injury are essential for acute patient care and long-term rehabilitation. The Glasgow Coma Score (GCS) is a valuable first observation of the severity and prognosis immediately following brain trauma.7–9 The Glasgow Coma Score has a practical limitation, however, because often it is not measured in emergency rooms or in hospitals where TBI patients are first transported. The duration of loss of consciousness (LOC) is also an important predictor of the severity and long-term prognosis of injury.10 Frequently, however, the length of unconsciousness is unknown or unrecorded. Another clinical predictor of the severity of brain injury is the duration of posttraumatic amnesia (PTA) for the memory of the occurrence of the accident itself.11,12 This clinical measure also is often not obtained during the acute admission stages in an emergency room.
The standard or conventional visually read electroencephalogram (EEG)13,14 and conventional magnetic resonance imaging scan (MRI)15–17 are not yet sensitive or reliable in their detection of differences between mild and moderate TBI. Conventional EEG and MRI also do not predict outcome and gradations of severity of traumatic injury very well. In contrast, recent quantitative EEG (qEEG) studies have shown that even if the initial GCS, LOC, and PTA information are not available, evaluations in the post-trauma period ranging from months to several years can predict the severity of the injury and, in some cases, long-term prognosis. For example, recent studies by Trudeau et al.18 show a high accuracy rate of computer-analyzed EEG identifying patients with blast concussions years after the event, and studies by Hoffman et al.19 have shown similar accuracy of detection of TBI using quantitative EEG methods in outpatients. These recent studies support earlier qEEG studies that have shown discriminant accuracy as high as 95.67% in the detection of mild head injury20 and greater than 75.8% accuracy of prediction of outcome one year after injury.21
The purpose of this study was to develop an objective and quantitative metric of the severity of brain injury by using EEG obtained in the long-term postacute period from 15 days to 4 years post injury. We sought to identify EEG variables that discriminate between patients with mild and severe traumatic brain injury and then to cross-validate this metric by using neuropsychological test scores and clinical admission measures. We also sought to cross-validate the linearity of the metric by using the EEG from patients with moderate brain injury. The hypothesis of a linear severity measure is that moderate traumatic brain injury results in EEG values that are intermediate between those of mild and severe TBI.
METHODS
Patients
A total of 108 patients with closed head injury (95 males), average age 32.58 years (range 18.83–62.97 years), were included in the study. Ethnic makeup was 81% Caucasian, 13% black, 5% Hispanic, and 1% Asian. The patients were recruited as part of the Defense and Veterans Head Injury Program (DVHIP), which involves comprehensive testing and evaluation of the consequences of traumatic brain injury. Informed consent was obtained from all of the patients in this study. All of the patients were in the chronic or nonacute postinjury period when they were evaluated. The average interval between TBI injury and qEEG and neuropsychological evaluations was 224 days (range 15–1,436 days).
On the basis of clinical admission measures, the patients were placed into three different groups. Criteria for assignment to the Mild head injury group (n=40) were GCS 13–15, PTA <1 hour, and LOC ≤20 minutes. Criteria for the Moderate head injury group (n=25) were GCS 10–12, PTA 1 hour to 6 days, and LOC 1 hour to 24 hours. Criteria for the Severe head injury group (n=43) were GCS ≤7, PTA ≥7 days, and LOC ≥24 hours. There were no significant differences between the three patient groups for age, gender, or length of time from injury to test. Table 1 shows the clinical admission criteria and characteristics of the three groups of patients.
All of the patients were diagnosed according to ICD-9 codes for injuries within the 850 to 854 categories (i.e., intracranial injuries excluding those with penetrating head wounds or skull fracture). Approximately 66% of the subjects were motor vehicle accident victims, 17% were victims of industrial or home accidents, and 17% were victims of violent crime. Approximately 51% (43/83) of the patients had taken some form of psychoactive medication prior to EEG testing (e.g., propoxyphene, acetaminophen with codeine, phenytoin, carbamazepine, lorazepam, sertraline). Statistical analyses were conducted to determine the effect that medication may have had on the EEG discriminant analyses. As described in the Results section for training set discriminant analysis, no statistically significant differences between patients on medication and patients without medication were found.
Neuropsychological Testing
Neuropsychological tests were administered when the patients were admitted to the DVHIP program, which was often many months post injury (mean=224 days). Neuropsychological tests measure only the level of cognitive function at the time of the test, and hence the exact contribution of the head injury to the patient's current neuropsychological function is unknown. Nonetheless, the neuropsychological tests used in the present study are the standard tests used today to evaluate closed head injury in the posttraumatic period.10,12 They were used to evaluate the current level of cognitive function, and we note that in this sense the neuropsychological variables are only indirect measures of severity of injury. Seven different neuropsychological tests were evaluated. The seven neuropsychological tests were the Wechsler Adult Intelligence Scale–Revised (WAIS-R), Boston Naming Test, Word Fluency Test (MAE version), attention tests, Wisconsin Card Sorting Test, Wechsler Memory Scale–Revised, and California Verbal Learning Test (CVLT).
Electroencephalographic Recording
Power spectral analyses were performed on 2-minute to 5-minute segments of eyes-closed resting EEG recorded from 19 scalp locations based on the International 10/20 System of electrode placement, using the left ear lobe as a reference. ECG and eye movement electrodes were applied to monitor artifact, and all EEG records were visually edited to remove any visible artifact. The amplifier bandwidths were nominally 0.5 Hz to 30 Hz, the outputs being 3 dB down at these frequencies. Three to 5 minutes of eyes-closed EEG recording was digitized at 100 Hz and then subjected to spectral analysis using a complex demodulation procedure. Absolute EEG amplitude was computed from the 19 scalp locations in the delta (0.5–3.5 Hz), theta (3.5–7 Hz), alpha (7.5–13 Hz), and beta (13–22 Hz) frequency bands. The frequency bands, including the center frequencies (fc) and one-half power values (B) were delta (0.5–3.5 Hz; fc=2.0 Hz; B=1.0), theta (3.5–7.0 Hz; fc=4.25 Hz; B=3.5 Hz), alpha (7.0–13.0 Hz; fc=9.0 Hz; B=6.0 Hz), beta (13–22 Hz; fc=19 Hz; B=14.0 Hz). EEG amplitude was computed as the square root of power.
EEG coherence and phase were computed for all pairwise combinations of electrodes.21,22 Coherence is defined as

where Gxy(f) is the cross-power spectral density and Gxx(f) and Gyy(f) are the respective autopower spectral densities. Coherence was computed for all pairwise combinations of the 19 channels for each of the four frequency bands. The computational procedure to obtain coherence involved first computing the power spectra for x and y and then computing the normalized cross-spectra. Because complex analyses are involved, this produced the cospectrum (r for real) and quadspectrum (q for imaginary). Then coherence was computed as

Further mathematical details of the analyses are provided elsewhere.20,23
Statistical Analyses
Condescriptive analyses were conducted in which the sampling distribution of each EEG variable was evaluated. Estimates of Gaussianity were computed for each variable, using measures of skewness, kurtosis, and normal probability plots.24 The only EEG variables that were not normally distributed were the EEG phase variables, and therefore a logarithmic transform was used for these variables. Further evaluation showed that the logarithmic transform of EEG phase was adequate to approximate a normal distribution. Univariate t-tests were conducted to identify which EEG variables were significantly different between the Mild and Severe TBI patients. Varimax factor analyses were then conducted using the reduced set of statistically significant EEG variables. The highest-loading variables on the factors were then selected for entry into a discriminant analysis.25,26A Bayesian criterion was used in the linear discriminant analysis in order to adjust for differences in sample size between the Mild and Severe TBI groups.
RESULTS
EEG Variable Selection
A two-stage process was used to reduce the total universe of possible EEG variables for entry into the discriminant function and to maximize the subject-to-variable ratio. The first step involved univariate t-tests with the Mild and Severe groups as the dependent variable and the EEG measures as the independent variables. The EEG variables were grouped into five categories: 1) relative power, 2) total power, 3) coherence, 4) phase, and 5) amplitude asymmetry. All EEG variables that had a probability value of less than 0.01 were identified and selected for entry into the second step, which was factor analysis. The results of the t-test analysis revealed no statistically significant differences between groups in total power and only two statistically significant differences between groups in relative power. Because of the large number of statistically significant differences in coherence, phase, and amplitude asymmetry, the power measures were excluded from all subsequent analyses.
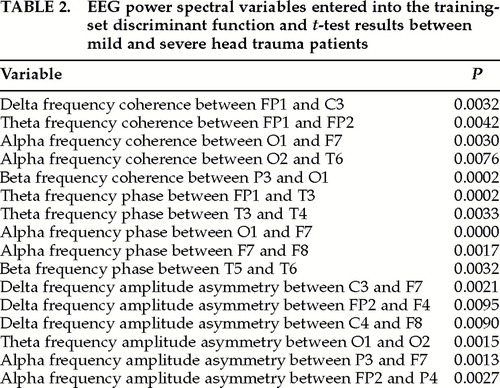
Independent varimax factor analyses were performed on each of the remaining three groups of EEG variables (coherence, phase, and amplitude asymmetry). A criterion for selection of individual EEG variables to be entered into the discriminant function was a loading greater than 0.8 on a given factor. By use of this criterion, a total of 16 EEG variables were selected for entry into the discriminant analysis. Table 2 shows the 16 EEG variables that were finally selected for entry into the discriminant analysis as well as the univariate t-test probability values. There were approximately the same number of EEG coherence (5), EEG phase (5), and EEG amplitude asymmetry measures (6), with 7 left hemisphere, 4 right hemisphere, and 5 interhemispheric locations.
Training Set Discriminant Analysis
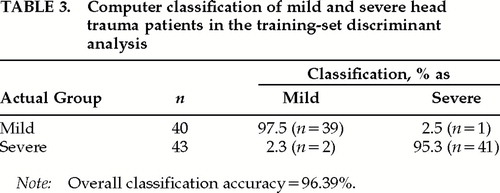
A two-group discriminant analysis was conducted in which the previously selected 16 EEG variables were the predictor variables and the two groups were the Mild versus the Severe patients.25 A Bayesian rule was used to correct for differences in the number of patients in the two groups. All of the variables were forced into the discriminant analysis, and a stepwise procedure was not used. Table 3 shows the classification accuracies for the 40 Mild TBI patients and the 43 Severe TBI patients, with 95.08% of the Mild TBI patients and 97.7% of the Severe TBI patients accurately classified, yielding an overall classification accuracy of 96.39%.
Figure 1A shows the distribution of the discriminant scores in the two groups of patients, and Figure 1B shows head diagrams of the EEG variables entered into the discriminant function in A. In Figure 1A, the scales of the axes are the same for the two distributions so that the relative proportion of discriminant scores can be compared. In order to display the discriminant scores as a measure of severity, each discriminant score was multiplied by –1, and the value of 5 was then subtracted from each score. In this way, the discriminant scores ranged between 0 and 10 (0.95 to 9.23) and provided a normalized range of values from low severity to high severity. The criterion discriminant score whereby patients were classified as members of the Severe TBI group was ≥4.5229 (approximately 51% or greater of the population).
In all, 43 of the 83 patients had taken some form of medication at the time of EEG testing. Analyses of variance failed to show any statistically significant differences in EEG discriminant values for patients on medication versus patients with no medication.
Acute Clinical Validation of Discriminant Scores
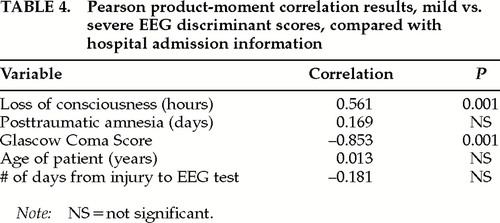
Clinical validation of the discriminant scores was accomplished by Pearson correlation analyses between the hospital admission measures of GCS, PTA, and LOC and the discriminant scores for each patient. Table 4 shows the results of the correlation analyses between the EEG discriminant scores and the clinical admission scores. It can be seen that there were statistically significant correlations between the EEG discriminant scores and Glasgow Coma Scores and between the EEG discriminant scores and length of coma, but not with the length of posttraumatic amnesia. The results of the analyses establish the clinical validity of the EEG discriminant scores by their statistically significant correlations with the clinical admission measures. The lack of a correlation between the discriminant scores and PTA is likely due to the difficulty in correctly measuring the length of memory loss following traumatic brain injury.
Validation of EEG Discriminant Scores 1 to 4 Years Post Trauma Based on Neuropsychological Test Scores
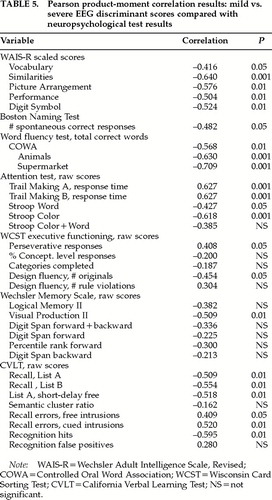
Neuropsychological validation of the EEG discriminant scores was accomplished by Pearson correlation analyses between the EEG discriminant scores and the various neuropsychological scores from the same patients. Table 5 shows the results of these analyses, in which statistically significant correlations were noted between various neuropsychological scores and the EEG discriminant scores obtained from the same patients. The direction of the correlation between the EEG discriminant scores and neuropsychological performance showed that the more negative the discriminant score, the poorer the neuropsychological performance. In other words, the more severe the brain injury as indicated by the EEG discriminant function, the worse the neuropsychological performance. The Controlled Oral Word Association (COWA) test and the Trail Making attention test exhibited the highest correlations with the EEG discriminant function (Table 5).
Correlation analyses were also conducted between the neuropsychological test scores and the 16 individual EEG variables that were entered into the discriminant function (see Table 2). These analyses revealed only relatively weak correlations, with only a few statistically significant Pearson correlations. A comparison of the discriminant score correlations with the individual EEG variable correlations revealed that the linear multivariate vector of the discriminant function was much more highly correlated to neuropsychological performance than any single EEG variable standing alone.
Cross-Validation of Moderate TBI Patients at the Mid Range of the Severity Index
The EEG discriminant function is a linear regression equation that returns a single value for each subject based on the EEG variables and a unique set of regression coefficients.25 Discriminant functions are not just classifiers of the probability of membership to a group, but may also be a linear index of severity of injury. The use of a discriminant function as a linear predictor requires that the severity scores from Moderate TBI patients lie intermediate to the discriminant scores for Mild and Severe and thus represent a continuum of discriminant scores. The distribution between Mild and Severe could be a step function or some nonlinear shape, and the discriminant function would not be capable of predicting a continuum of severity. A simple test of the linearity of a discriminant function is to determine if the mean of a group of moderately head-injured patients' discriminant scores are intermediate between Mild and Severe. In order to cross-validate the initial discriminant function and to test the linearity hypothesis, an independent group of TBI patients (n=25) estimated by hospital admissions scores as having Moderate TBI, or intermediate between Mild and Severe, was evaluated. The prediction of the linearity hypothesis of severity of TBI is that the Moderate TBI patients are expected to show EEG discriminant scores that are intermediate between Mild and Severe.
Figure 2B shows the means and standard deviations of the discriminant scores for the three groups of patients: Mild, Moderate, and Severe. It can be seen that the mean of the discriminant scores for the Moderate TBI patients did fall between the mean of the discriminant scores of the Mild and Severe groups. The t-tests performed between the three groups also revealed statistically significant differences (Mild vs. Moderate, P<0.0001; Mild vs. Severe, P<0.000001; Moderate vs. Severe, P<0.00001).
Postinjury Stability of EEG Severity Index
The reliability and stability of the EEG discriminant function were evaluated by comparing the discriminant scores at baseline (i.e., 15 days to 4 years) to the discriminant scores obtained upon repeated EEG testing at 6 months and 12 months after the initial baseline EEG test. t-tests and repeated-measures analyses of variance were performed in which the dependent variables were the baseline, 6-month, and 12-month groupings and the independent variables were the EEG discriminant scores. No statistically significant differences were found between any of the postinjury periods. The relative stability and reliability of the EEG discriminant score was further evaluated by defining covariates as age and/or time between injury and EEG test, thus removing these variables from the analysis of covariance. These analyses also failed to reveal a significant difference between baseline, 6-month, and 12-month repeated testing.
Cross-Validation of EEG Severity Index in Four VA Hospitals and Three Military Hospitals
Additional validation tests of the EEG severity index were undertaken by computing a discriminant score for 503 confirmed TBI patients located at four different Veterans Affairs hospitals (Palo Alto, CA; Minneapolis, MN; Richmond, VA; and Tampa, FL) and three military hospitals (Balboa Naval Medical Center, Wilford Hall Air Force Medical Center, and Walter Reed Army Medical Center). The histogram distribution of EEG severity scores from the seven different hospital sites is shown in Figure 3. It can be seen that the distribution of severity scores is different for the different head injury hospitals. Although a broad spectrum of TBI severity is evident in these analyses, in general, higher EEG severity scores were found in the four VA hospitals than in the active-duty military hospitals (P<0.00001).
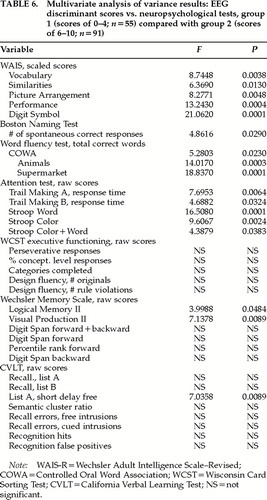
Cross-validation of the EEG severity index was also evaluated in this population of TBI patients by comparing the neuropsychological scores between a group with lower EEG discriminant scores (between 0 and 4; n=55) and a group with higher EEG discriminant scores (between 6 and 10; n=91). Table 6 shows the results of the multivariate analysis of variance, in which statistically significant differences in neuropsychological performance were predicted by the EEG discriminant score groupings. The group having lower EEG discriminant scores was associated with higher neuropsychological functioning when compared with the group having higher EEG discriminant scores. The results of these analyses provide an additional cross-validation and also demonstrate the ease of calculation of the EEG severity scores as a measure of the neurological severity of head injury in large populations of TBI patients.
DISCUSSION
The results of the present study demonstrate the capacity of the EEG to discriminate between Mild and Severe traumatic brain injury during the postacute period. From Table 3, the sensitivity of the discriminant analysis is 95.45% (i.e., [true positives (42)]/[false negatives (2)+true positives (42)]=42/44=95.45%) and the specificity is 97.44% (i.e., [true negatives (38)]/[(false positives (1)+true negatives (38)]=38/39=97.44%). The discriminant function was cross-validated by correlation with hospital admission scores obtained during the acute injury period as well as by correlation with neuropsychological test scores obtained months after injury (Table 4 and Table 5). Additional cross-validation was accomplished by comparison to a group of moderate TBI patients in which the discriminant scores were intermediate between the Mild and Severe groups; in this comparison a linear relationship between the EEG and the severity of TBI was indicated (see Figure 2).
Retrospective Predictions of TBI Severity
The statistically significant correlation between the postinjury EEG discriminant score and the admitting GCS and LOC (see Table 4) provides a retrospective severity of injury estimate. That is, the results of this study show a detectable “residual” of the severity of injury many months after the injury. The stability and reliability of this hypothesized injury residual persist even after repeated EEG testing (Figure 4). The stability and sensitivity of the EEG multivariate discriminant can be described as the result of a “Big Bump” theory of traumatic brain injury, in which it is hypothesized that a pathological residual and/or a compensation to injury is persistent and detectable by qEEG many months or years following traumatic brain injury. If a detectable residual is in fact present, then the question becomes to what extent this is a compensatory reorganization pattern and to what extent it is a direct reflection of the pathology of TBI. Given the many different force vectors imparted to the skulls of the patients in this study, a generalized compensatory process or a general brain structure profile of vulnerabilities may together or separately explain the experimental results. Some support for the latter explanation is the finding of a negative relationship between the qEEG discriminant function and neuropsychological performance; that is, the more severe the qEEG discriminant function, the lower the level of neuropsychological functioning.
Relationships to Neuropsychological Performance
In addition to retrospective prediction of length of coma and Glasgow Coma Score at the time of injury, the EEG discriminant function was also significantly correlated with neuropsychological functioning measured prospectively during the 15-day to 4-year postinjury period. The direction of correlation was consistently negative in that increased severity of TBI as indicated by the EEG discriminant function was inversely related to neuropsychological performance. These results indicate that TBI has a long-lasting effect on cognitive functioning and that the qEEG provides a measure of a persistent neurological reorganization resulting from the injury. The results of this study are consistent with previous studies of qEEG and neuropsychological performance in TBI patients, in which reduced speed and efficiency of information processing were the domains most affected by traumatic brain injury. No single or specific cognitive dysfunction is typically associated with closed head injury; instead, memory, executive, attentional, and emotional capacities are all affected.10,12
The Best EEG Predictor Is a Multivariate Vector
No relative or absolute EEG power variables were entered into the discriminant equation because the power variables were comparatively weaker in their contribution to the discriminant function than EEG coherence, EEG phase, and/or EEG amplitude differences. The ratio of variables to subjects was approximately 5 to 1 (i.e., 83 subjects and 16 variables). The three categories of EEG variables entered into the discriminant function loaded on different factors in the factor analyses and likely reflect different aspects of the neurophysiological status of the brain. A common anatomical finding was of frontal and temporal electrode sites being more statistically significant than other sites. This finding may reflect the unique aspects of the biomechanics of traumatic brain injury in which frontal and temporal lobes are especially vulnerable to trauma.27,28 The qEEG variables that survived the selection process in the present study were similar to those that were previously evaluated in a qEEG discriminant analysis of mild TBI patients versus normal subjects.20
The results of this study also showed that any single EEG variable, standing alone, was less significantly correlated with GCS, LOC, and neuropsychological performance than the combination of EEG variables represented in the multivariate discriminant score. This suggests that the multivariate discriminant score is a global or system variable in which a combination of neurophysiological processes is affected by TBI, especially those processes involving the frontal and temporal lobes. The results of this study indicate that it is the combined interaction and coordination of distributed brain processes that are represented by the EEG discriminant score and EEG TBI severity index. Such a conclusion is consistent with previous qEEG discriminant studies.20,29 It is unknown whether the multivariate EEG severity index is solely cortical in origin or also involves subcortical injuries. Given the diffuse biomechanics of traumatic brain injury, it is likely that reduced efficiency and speed of information processing are reflected in the observed system state of distributed brain regions, as seen in Figure 1 and Table 2.
EEG Severity Index of Traumatic Brain Injury
Figure 4 is a diagrammatic representation of a possible clinical application of the EEG analyses presented in this study. The finding of intermediate discriminant scores for Moderate TBI patients and the relative high accuracy and sensitivity of the discriminant function support the clinical application of this metric. In Figure 4B, a given patient's discriminant score reflects the severity of TBI within a confidence band. Examination of the relative contribution of different EEG dimensions of the severity index, such as seen in Figure 1B, may facilitate the neurophysiological evaluation of TBI and may be useful in the evaluation of rehabilitation after TBI.
Clinical Utility of an EEG Severity Index of Traumatic Brain Injury
Patients who present with persistent cognitive and neuropsychological deficits many months or years post injury often do not have access to accurate estimates of the severity of the TBI incident that they suffered. For example, often a Glasgow Coma Score is not estimated at the time of an accident or the hospital records are missing or the accuracy of the GCS and other acute TBI measures may be in doubt. The present EEG severity index may facilitate accurate diagnoses of the extent of brain injury by providing an objective and independent measure of the severity of TBI.
The EEG severity index may also be of value in establishing whether or not there is a neurological basis for a patient's complaints. That is, the EEG severity index may be used as an adjunctive diagnostic test or as one more measure that can be brought to bear on the issue of the neurological nature of a patient's complaints. The EEG severity index may also provide an objective measure that can be used for prognostic purposes in determining the extent to which neurological and/or neuropsychological functioning may improve in the future. Moreover, the present objective EEG severity index may be of value in devising and evaluating presently used treatment methods as well as new methods for treating patients who have suffered a traumatic brain injury.
ACKNOWLEDGMENTS
The authors are indebted to Dr. Rex Bierley for discussions of the neuropsychological tests. This project was supported by contract JFC36285006 from the Jackson Foundation as part of the Defense and Veterans Head Injury Program (DVHIP).

FIGURE 1. A: Distribution of the EEG discriminant scores in two severity groups of traumatic brain injury (TBI) patients, Mild (open bars) and Severe (shaded bars)The scales of the axes are the same for the two distributions so that the relative proportion of discriminant scores can be compared. See text for details. B: Head diagrams of the EEG variables entered into the discriminant function in A. Mean EEG values in Severe TBI patients compared with Mild TBI patients are shown as dotted lines for reduced values and solid lines for increased values. Variable locations and types are listed in Table 2.

FIGURE 2. A and B: Means and standard deviations of discriminant scores for three groups of patients: Mild, Moderate and SevereThe mean of the discriminant scores for the Moderate TBI patients fell between the means for the Mild and Severe groups. Error bars are ±1 standard deviation.

FIGURE 3. Histograms showing EEG severity score distributions from TBI patients located at four different Veterans Affairs hospitals (A) and three military hospitals (B)A total of 503 TBI patients were evaluated by using the EEG discriminant function to estimate severity of TBI.

FIGURE 4. A: Discriminant score histograms for the Mild, Moderate and Severe TBI patients in this studyThe arrow and dotted line show the discriminant score or severity index score for a hypothesized individual patient with a moderate traumatic brain injury. Calculation of the severity index score for this Moderate TBI patient was hypothesized based on the Mild vs. Severe TBI discriminant function. B: Diagrammatic representation for the same hypothesized Moderate TBI patient.
 |
 |
 |
 |
 |
 |
1 Caveness W: Epidemiologic studies of head injury. Trauma 1977; 18:61–66Google Scholar
2 Max W, MacKenzie EJ, Rice DP: Head injuries: costs and consequences. J Head Trauma Rehabil 1991; 6:76–88Crossref, Google Scholar
3 Wilder CS: Health Interview Survey. Rockville, MD, National Center for Health Statistics, U.S. Department of Health, Education and Welfare, 1976Google Scholar
4 Barth J, Macciocchi S, Giordani B: Neuropsychological sequelae of minor head injury. Neurosurgery 1983; 13:520–537Crossref, Medline, Google Scholar
5 Kwentus JA, Hart RP, Peck ET, et al: Psychiatric complications of closed head trauma. Psychosomatics 1985; 26:8–15Crossref, Medline, Google Scholar
6 Rimel R, Hiodani B, Barth J, et al: Disability caused by minor head injury. Neurosurgery 1981; 9:221–223Crossref, Medline, Google Scholar
7 Teasdale G, Jennett B: Assessment of coma and impaired consciousness: a practical scale. Lancet 1974; ii:81–84Google Scholar
8 Jennett B: Head trauma, in Diseases of the Nervous System, edited by Asbury AK, McKhaan GM, McDonald WI. Philadelphia, WB Saunders, 1986, pp 1282–1291Google Scholar
9 Pal J, Brown R, Fleiszer D: The value of the Glasgow Coma Scale and injury severity score: predicting outcome in multiple trauma patients with head injury. J Trauma 1989; 29:746–748Crossref, Medline, Google Scholar
10 Ross BL, Temkin NR, Newell D, et al: Neuropsychological outcome in relation to head injury severity: contributions of coma length and focal abnormalities. Am J Phys Med Rehabil 1994; 73:341–348Crossref, Medline, Google Scholar
11 Russel WR, Nathan PW: Traumatic amnesia. Brain 1946; 69:183–187Google Scholar
12 Levin HS, Benton AL, Grossman RG: Neurobehavioral Consequences of Closed Head Injury. New York, Oxford University Press, 1982Google Scholar
13 John ER, Karmel B, Corning W, et al: Neurometrics: numerical taxonomy identifies different profiles of brain functions within groups of behaviorally similar people. Science 1977; 196:1393– 1410Google Scholar
14 Hughes JR, John ER: Conventional and quantitative electroencephalography in psychiatry. Neuropsychiatry 1999; 11:190– 208Link, Google Scholar
15 Gentry LR: Imaging of closed head injury. Radiology 1994; 191:1–17Crossref, Medline, Google Scholar
16 Gentry LR: Head trauma, in Magnetic Resonance Imaging of the Brain and Spine, edited by Atlas SW. New York, Raven, 1990, pp 439–466Google Scholar
17 Gentry LR, Godersky JC, Thompson B: MR imaging of head trauma: review of the distribution and radiopathologic features and traumatic lesions. Am J Radiol 1988; 150:663–672Google Scholar
18 Trudeau DL, Anderson J, Hansen LM, et al: Findings of mild traumatic brain injury in combat veterans with PTSD and a history of blast concussion. J Neuropsychiatry Clin Neurosci 1998; 10:308–313Link, Google Scholar
19 Hoffman DA, Stockdale S, Hicks L: Diagnosis and treatment of head injury. Journal of Neurotherapy 1995; 1:14–21Crossref, Google Scholar
20 Thatcher RW, Walker RA, Gerson I, et al: EEG discriminant analyses of mild head trauma. Electroencephalogr Clin Neurophysiol 1989; 73:93–106Crossref, Google Scholar
21 Thatcher RW, Cantor, DS, McAlaster R, et al: Comprehensive predictions of outcome in closed head injury: the development of prognostic equations. Ann NY Acad Sci 1991; 620:82–104Crossref, Medline, Google Scholar
22 Otnes RK, Enochson L: Digital Time Series Analysis. New York, Wiley, 1972Google Scholar
23 Thatcher RW, Krause P, Hrybyk M: Corticocortical associations and EEG coherence: a two compartmental model. Electroencephalogr Clin Neurophysiol 1986; 64:123–143Crossref, Medline, Google Scholar
24 Velleman PF: DataDesk, Version 6.0. Ithaca, NY, Data Description, Inc., 1997Google Scholar
25 Norusis MJ: SPSS Advanced Statistics 6.1. Chicago, SPSS, Inc., 1994Google Scholar
26 Cohen WC, Lohnes PR: Multivariate Data Analysis. New York, Wiley, 1971Google Scholar
27 Ommaya AK: The mechanical properties of tissues of the nervous system. J Biomech 1968; 2:1–12Google Scholar
28 Ommaya AK, Thibault LE, Bandak FA: Mechanisms of impact head injury. International Journal of Impact Engineering 1994; 15:535–560Crossref, Google Scholar
29 John ER, Prichep LS, Fridman J, et al: Neurometrics: computer-assisted differential diagnosis of brain dysfunctions. Science 1988; 293:162–169Crossref, Google Scholar