Brain Effects of TMS Delivered Over Prefrontal Cortex in Depressed Adults
Abstract
Relative regional brain blood flow was measured in 23 clinically depressed adults by using ECD SPECT at baseline and again during actual prefrontal transcranial magnetic stimulation (TMS) following 5 daily sessions of TMS. TMS over prefrontal cortex caused increased activity in cortex directly under the stimulation (inversely correlated with distance from scalp to cortex) and decreased activity in remote regions (anterior cingulate and anterior temporal poles). High-frequency rTMS (20 Hz) caused more relative flow immediately below the TMS coil than did low-frequency rTMS (5 Hz). Confirming the hypotheses tested, repeated daily TMS over the prefrontal cortex in medication-free depressed adults appears to change both local and remote blood flow in a manner that may also depend on the frequency of stimulation and coil to outer cortex distance.
Transcranial magnetic stimulation (TMS) affects the brain by inducing electrical currents and noninvasively stimulating superficial cerebral cortex. In TMS, passing an electric current through a coil of wires resting on the scalp generates a powerful yet brief orthogonal magnetic field, which then passes unimpeded through the skull.1 If induced at high amplitude and with a rapid brief onset (100–200 microseconds), this creates a time-varying magnetic field, ranging up to 1.5 tesla. The magnetic field intensity falls off exponentially with increased distance from coil surface.2 A naming convention adopted several years ago emphasizes the importance of repeated TMS and the frequency of stimulation. Any periodic application of TMS is called repetitive transcranial magnetic stimulation (rTMS), which is then modified by slow (<1 Hz) or fast (≥1 Hz) TMS.
For more than a decade, TMS has been used in neurophysiology.3,4 Only in the last five years, however, has it been widely applied as a probe of neurocognitive behavior in health5 and in a variety of neuropsychiatric conditions.6–9 Several clinical trials have explored TMS effects on mood and depression.3,10–24 Most of these studies, but not all,18 suggest that daily prefrontal rTMS over 2 weeks has an antidepressant effect greater than placebo. TMS's mechanisms of action are not known. Two studies have shown increases in serum thyroid measures during prefrontal stimulation, suggesting that changes in mood may be due to transsynaptic hypothalamic stimulation and downstream neuroendocrine changes.13,25 Other studies,26–31 using radiotracer-based neuroimaging, have investigated the effect of TMS on brain activity (reviewed by George et al.32). These limited studies to date have been confounded by small numbers of subjects, opposite effects on brain blood flow and glucose consumption with similar stimulation parameters,26,30 and different regional effects within the same individuals.28,29
A prominent hypothesis in the TMS field has been that fast rTMS (for example, >10 Hz) results in excitatory physiological changes, while slow rTMS (≤1 Hz) has inhibitory effects.33,34 This hypothesis is modeled on long-term potentiation, a neuronal phenomenon where repetitive stimulations of excitatory synapses cause an increase in synaptic strength lasting long after the stimulation has stopped.35 In contrast, long-term depression is a long-lasting decrease in the synaptic strength due to repeated stimulations at lower frequencies, typically 1 Hz or less.36–38 Electrophysiological studies over motor cortex are in general supportive of this hypothesis, with high-frequency stimulation enhancing motor performance and electrophysiological measures, and low-frequency stimulation showing diminished local and distributed effects.39 Some functional imaging studies have shown differential frequency effects as well.40
In previous reports, we documented perfusion changes in this cohort that occurred over the entire 2 weeks of treatment.41 We found that TMS antidepressant treatment responders (patients with ≥50% decrease in Hamilton Rating Scale for Depression [Ham-D] scores)42 had increased anterior temporal/orbitofrontal activity at baseline compared with nonresponders. This difference was present at baseline and increased following response to treatment. In a separate study of MRI scans in this cohort, we found that prefrontal cortex distance was greater than motor cortex distance in most of our subjects, and the difference appeared to increase with age.43 Also, none of the subjects older than 55 responded to rTMS. The current report describes a different SPECT scan obtained during the end of the 20-minute TMS session on day 5 of the study in these same subjects.
The design of the current study was guided by knowledge of prefrontal cortical and paralimbic connections44 and by evidence that limbic regions and the prefrontal cortex are dysfunctional in depression.45 We hypothesized that stimulating over the left dorsolateral prefrontal cortex (DLPFC) would affect regional brain activity, both locally in the prefrontal cortex and in paralimbic areas. Specifically, we conjectured that TMS would cause changes in blood flow in the prefrontal cortex near the TMS coil (DLPFC) and in specific parts of the limbic and paralimbic cortex (cingulate; caudate; anterior temporal poles; and inferior frontal, orbitofrontal, and medial temporal cortex). To test this assumption, we performed baseline and day 5 scans using [99mTc”-ethyl cysteinate dimer single-photon emission computed tomography (ECD SPECT) in depressed adults participating in a double-blind placebo-controlled TMS antidepressant treatment trial.46 We posed the following pre-study hypotheses. The comparisons to be made are shown in italics within parentheses below and are diagrammed in Figure 1.
| 1. | a) Active rTMS (A) causes local increases from baseline in left prefrontal regional cerebral blood flow (i.e., at the site of the stimulation) as well as in paralimbic areas, whereas placebo stimulation (P) does not (within groups, [A,P], change from baseline) b) During stimulation on day 5 of the treatment study, active rTMS, compared with placebo, is associated with more blood flow directly under the coil (between two groups [A,P], on day 5 during stimulation only). | ||||
| 2. | The differences between the active and placebo group in how their rCBF changed across time will show increased activity in the prefrontal and paralimbic area in those receiving active rTMS compared with placebo (between-group comparison [A,P] of the within-group changes from baseline, ignoring the differential effect of frequency due to small numbers). | ||||
| 3. | Within those receiving active stimulation, there is more blood flow under the coil with fast rTMS than with slow rTMS (between two subgroups within the active cell [fast vs. slow frequency], during stimulation). | ||||
| 4. | Within those receiving active stimulation, during active stimulation on day 5 of the treatment study, there is more blood flow at the site of stimulation with shorter distance from coil to outer cortex, regardless of the frequency of stimulation. | ||||
METHODS
Subjects
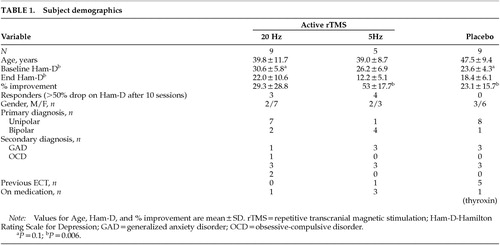
We enrolled 32 subjects in a 2-week double-blind placebo-controlled trial of rTMS. All gave written informed consent following full explanation of the procedures approved by the Medical University of South Carolina (MUSC) Institutional Review Board. The details of the clinical trial are presented elsewhere (Nahas et al.46 and unpublished manuscript). We used ECD SPECT to scan the 27 of the 32 subjects who consented to the SPECT scanning (which was not required for participation in the clinical trial). We also obtained 3D structural brain MRI scans on all participants. Four subjects were excluded from final image analysis because either a SPECT scan on day 5 during rTMS was not acquired or the data were nonusable. Thus, included in this study for final analysis were 23 subjects (7 men) who met DSM-IV criteria for either major unipolar depression (n=16; 4 men) or bipolar depression, depressed phase (n=7; 3 men), using the Schedule for Affective Disorders and Schizophrenia (SADS). Subjects were antidepressant medication free, although 4 bipolar subjects required ongoing mood stabilizers (clonazepam, valproic acid, lithium, or alprazolam), and 1 patient required medication (thyroxin) for thyroid disease. Complete subject demographics are displayed in Table 1.
Transcranial Magnetic Stimulation
TMS was performed with a Cadwell Magnetic Stimulator equipped with a figure-eight–shaped coil and a continuous water cooling system to prevent overheating. All subjects wore earplugs during rTMS sessions. Motor threshold (MT) was determined by placing the coil over the primary motor cortex and using the method of limits to determine the minimum amount of stimulation required to initiate gross motor movement at rest of the contralateral (right) abductor pollicis brevis (APB) muscle.21 The left prefrontal cortex stimulation site was defined as the location 5 cm rostral to and in a parasagittal plane from the site of optimal APB stimulation. Subjects were randomly assigned to receive left DLPFC stimulation at either 20 Hz, 5 Hz, or placebo, all performed at 100% of motor threshold. We applied placebo stimulation by angling the coil at 45 degrees so that only the medial wing touched the scalp. This allowed for the bulk of focal stimulation to pass outside the skull.47–49 Subjects received treatment for 10 days over 2 consecutive weeks and a total of 16,000 stimuli. Each session consisted of 30-second stimulation and rest periods repeated 40 times over 20 minutes.46 The ratio of stimulation time to rest varied as a function of frequency in order to match across groups for the total amount of stimulation. The second SPECT scan was obtained at the end of the 5th treatment session, typically 7 days after the baseline images were obtained.
SPECT Imaging
Whole-brain SPECT imaging was performed on two separate days, with typically 7 days between studies. For both scans, the radiotracer consisted of 30 mCi (1,110 Mbq) of technetium-99 bicisate (ECD; Neurolite, DuPont Pharma). (The sequence of events in scan acquisition is shown in Figure 2.)
Baseline:
For the baseline scan (bline) prior to any rTMS, the radiotracer was injected intravenously following a 15-minute rest period during which subjects sat in a dark, quiet room with their eyes closed. Following the tracer injection, subjects rested for an additional 15 minutes before scan acquisition.
During rTMS:
For the scan performed during rTMS (during), the bolus tracer was injected at the end of the 5th TMS treatment session. Before the start of the TMS session, a catheter was placed in the right forearm, and subjects were instructed that 10 minutes into the session the light in the room would be switched off and they should close their eyes. Then at minute 18, the stimulation parameters were changed from their assigned randomized rTMS (5 Hz, 20 Hz, or placebo, at 100% MT; for 5Hz, 8 s on, 22 off; for 20 Hz, 2 s on, 28 s off; 1,440 stimuli), to a different set (10 Hz, 60% MT, 10 s on/off, for 2 min, and an added 600 stimuli; see Figure 1). The total 20-minute session thus equaled 2,040 stimuli for all subjects, regardless of frequency assignment. Those receiving placebo treatment were also given sham TMS during the 2 minutes of tracer injection. This altered rTMS technique in the last 2 minutes of the 20-minute session was adopted because longer train lengths are more likely to cause seizures. Subjects who had been randomized to placebo were also switched to corresponding parameters, but the coil was maintained in the 45-degree sham position for minimal brain penetration.50 At minute 18, immediately following the first 10 seconds of stimulation, a physician injected the bolus radiotracer. At the end of the total 20-minute session (i.e., after the 2 minutes of altered rTMS), the patient remained quietly with eyes closed in a dark room for another 15 minutes prior to transport to the Nuclear Medicine suite.
SPECT images were acquired by using a triple-headed Picker camera with low-energy ultra-high resolution fan beam collimators. They were processed on an Odyssey VP computer, using a low-pass filter with the default order of 2+0.32 as the cutoff. Images were attenuation-corrected and reconstructed transversely, then transferred to a Sun SPARC20 for analysis. The y and z components were flipped to match radiological convention, and the matrix was resized to 128×128×43 and processed as 8-bit information. Statistical parametric mapping (SPM96b) software was used to apply a 10-mm smoothing followed by linear normalization into Talairach space.51,52 Customized normalization was allowed, using sinc interpolation with 12 affine parameters, no nonlinear basis functions, 2×2×2 voxel size, and MNI (Montreal Neurologic Institute) bounding box (–78:78, –112:76, –50:85).
MRI Scans
One day prior to beginning treatment, a T1-weighted 3D volumetric MRI sequence was obtained with a 1.5-tesla Picker MRI scanner (Picker International, Cleveland, OH). Scans in this study were 142 sagittal slices 1 mm thick covering the entire brain (128×128, FOV 20 cm, TE 4.4, TR 13, voxel size 1.2×1.2×1 mm). A trained and masked investigator (F.A.K.) assessed the shortest distance from the coil to the nearest prefrontal cortex (D-PFC) using MEDx 2.1 software (Sensor Systems, Alexandria, VA) The details of these methods employed in our laboratory have been described elsewhere.53
Statistical Analyses
For the SPECT data analysis we used a two-stage approach. Both approaches used SPM96 software, which does not distinguish between hypothesis-driven and more exploratory analyses. The data were compared across groups (active, placebo) and/or conditions (bline, during) using a threshold of P<0.01, a cluster extent with a P<0.5, a gray matter threshold of 0.6, and proportional scaling of the grand mean at 50. The following analyses were performed to test hypotheses regarding specific regions, including prefrontal cortex near the TMS coil (DLPFC), and specific parts of the limbic and paralimbic systems (cingulate, caudate, anterior temporal poles, inferior frontal, orbitofrontal, and medial temporal cortex). Figure 1 diagrams the different analyses performed.
| 1. | To test the hypothesis that active rTMS would affect brain activity at the site of stimulation and in connected paralimbic areas, we a) generated two separate maps (active, placebo) using two-tailed paired Student's t-tests comparing baseline activity with activity during stimulation; and b) generated a map using two-tailed unpaired Student's t-tests comparing activity during the 5th stimulation session between the active and placebo groups. | ||||
| 2. | To test the hypothesis that changes in rCBF in limbic regions with active or placebo rTMS will be different over time, we directly compared the differences in brain activity between active and placebo over time and across conditions. | ||||
| 3. | To test the hypothesis that slow and fast stimulation would affect rCBF in different patterns at the moment of stimulation, we generated a map using two-tailed unpaired Student's t-tests comparing activity during stimulation at high and low frequencies within the active group only. | ||||
| 4. | To test the hypothesis that local brain activity induced by rTMS (active—fast, slow) correlates with the distance from coil to prefrontal cortex, relative blood flow during the 5th stimulation session was compared with measurements of D-PFC distance, using Pearson's correlations. | ||||
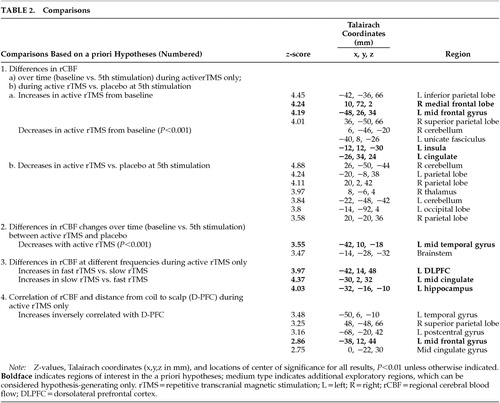
This was the full extent of the hypothesis-driven analyses. These regions are listed in boldface in Table 2. Because SPM performs analyses on all regions regardless of a priori hypotheses, we report changes in other regions as well for all contrasts performed (in the table as medium type). We also report clusters that met the criteria for intensity with a P<0.01 but failed to meet the extent threshold of P<0.5. As these were not hypothesis-driven, they must be considered exploratory and await further testing in later studies.
RESULTS
Fourteen subjects received active rTMS. Nine (4 antidepressant responders) received 20 Hz rTMS, and 5 (3 antidepressant responders) received 5 Hz rTMS. The placebo group consisted of 9 subjects, all nonresponders. Active and placebo groups had no statistically significant differences in age, baseline Ham-D, or exit Ham-D. They significantly differed in the percentage of improvement (P=0.022) and the number of responders (7/14 vs. 0/9; χ2=4.67, df=1). Within the 14 subjects who received active stimulation, those who received fast compared with slow stimulation did not significantly differ, although the fast stimulation group had a smaller percentage of bipolar subjects: 2 of 9 bipolar subjects in the depressed phase compared with 4 of 5 bipolar subjects in the slow stimulation group.
| 1. | rCBF changes for active or placebo groups during rTMS relative to baseline: Active rTMS (n=14) showed relatively increased activity during rTMS compared with baseline in the right medial frontal lobe and left middle frontal gyrus. Active rTMS showed relatively decreased activity in the left cingulate, left uncus, and left insula. Placebo (n=9) stimulation compared with baseline showed no significant changes in rCBF across conditions that met criteria for both intensity and extent of cluster. | ||||
| 2. | rCBF changes between active and placebo stimulation: Active rTMS subjects (n=14, ignoring frequency) showed significantly less relative activity in the right thalamus and parietal lobe bilaterally, when compared with the placebo group (n=9). Active rTMS showed no significant rCBF increases, when compared with placebo, that met criteria for both intensity and extent of cluster. | ||||
| 3. | Differences in rCBF changes from baseline between active TMS and placebo: Those receiving active rTMS had significantly decreased activity in the left middle temporal gyrus from baseline (Figure 3) compared with the difference in brain activity over time within the placebo group. A scatterplot of the data from this region by group and time (Figure 5) suggests that this difference results from an unequal initial difference in activity at this region; those in the placebo cell for some reason had lower initial values. | ||||
| 4. | Subgroup analysis of differences during fast and slow stimulation: Subjects with 20 Hz rTMS (n=9) showed relatively increased rCBF in left DLPFC at the site of stimulation and decreased rCBF in the left mid cingulate and left hippocampus (Figure 4) compared with those receiving 5 Hz TMS (n=5). This small sample comparison could not be matched across groups for gender, diagnosis, or treatment response. | ||||
| 5. | Correlation between normalized rCBF scans during active stimulation (5 and 20 Hz; n=9) and distance from coil to outer cortex (D-PFC) in millimeters: There was a significant inverse correlation of left DLPFC rCBF and D-PFC (r=0.786, slope factor=–1.216). That is, those who had the smallest distance from coil to outer cortex showed the greatest increase in brain activity at the site of stimulation. | ||||
DISCUSSION
This study has examined the effects of prefrontal TMS on rCBF in the context of an antidepressant treatment trial. There are three major findings.
| 1. | Compared with baseline, after 5 days of active treatment, rTMS increased rCBF at the site of stimulation (left middle frontal gyrus) and in the right medial frontal lobe, whereas there were no changes over time in those receiving placebo. Five days of rTMS compared with baseline was also associated with decreased activity in the anterior cingulate and anterior temporal poles. | ||||
| 2. | In a subgroup analysis within those receiving active treatment, rTMS delivered at different frequencies (5 Hz, 20 Hz) for 5 days over the left DLPFC had different effects on blood flow directly below the coil. Specifically, after 18 minutes of stimulation (and following 4 daily sessions), those receiving fast stimulation had increased blood flow directly below the TMS coil, compared with those receiving slow TMS. Further, fast TMS was associated with decreased activity in the mid-cingulate gyrus and left paralimbic area compared with slow TMS. | ||||
| 3. | Blood flow under the TMS coil during active treatment (both frequencies combined) declines with increasing distance. Specifically, after 18 minutes of stimulation (and following 4 daily sessions), blood flow at the site of stimulation inversely correlated with increased distance from scalp to outer cortex. | ||||
The Effect of TMS on Local and Distributed Brain Activity
The results of this study support the notion that TMS is an active, relatively noninvasive neuropsychiatric probe and that placebo stimulation daily for 5 days (as administered in this study with a figure-eight coil and a 45° angle) does not cause significant changes in brain activity.48 Multiple studies have found that TMS induces neuronal depolarization in superficial cerebral cortex under the TMS coil, and that this local depolarization causes remote changes through cell–cell communication. This principle of local stimulation initiating a circuit with remote effects is easily demonstrated by stimulation over primary motor cortex, which can induce movement in the contralateral body. The prefrontal cortex is behaviorally silent compared with primary motor or sensory cortex (although sophisticated prefrontal TMS studies do show immediate behavioral effects of rTMS on memory and emotion recognition). The results in the present study suggest that left DLPFC rTMS stimulates a corticosubcortical circuit, similar to those proposed by Alexander et al.44
The Role of Frequency
Our findings imply that higher frequency prefrontal cortex stimulation (20 Hz) at MT over 5 days increases blood flow underneath the coil compared to slow stimulation (5 Hz), while also decreasing blood flow in the cingulate and hippocampus. An equally plausible interpretation of the data are that 5 days of low-frequency prefrontal stimulation lowers local blood flow and increases cingulate and hippocampal blood flow, compared with high-frequency stimulation. These provocative results in a small unmatched sample should be treated with caution until and if they are replicated. Interestingly, however, a recent PET study40 showed that in a depressed heterogeneous group, 20 Hz prefrontal rTMS at 80% MT increased the global absolute cerebral blood flow, whereas 1 Hz TMS decreased absolute blood flow. But contrary to our hypothesis, limbic regional activity decreased at the time of the 5th rTMS session. These deeper limbic regions have been implicated in regulation of mood and appear to be candidate regions in rTMS's therapeutic mechanism of action in depression. A previous report from our same depressed cohort shows that paralimbic activity is low at baseline and that 10 daily rTMS sessions over 2 weeks normalizes it.41
The present report adds to our prior findings and poses the question whether this improvement relies on accessing the paralimbic areas during the stimulation session and temporarily decreasing their activity during stimulation and at the end of the 5th session, with a later rebound in activity at the final scan taken three days after the last (10th) session. This cross-sectional design at three time points makes it difficult to fully test dynamic effects over serial sessions. The finding of decreased cingulate activity in those receiving high-frequency stimulation are consistent with a recently advanced hypothesis by Mayberg et al.54 suggesting that reconfiguring limbic and prefrontal interactions is the critical element that mediates the improvement in depression, rather than a specific change in a given region's activity. These reconfigurations are initiated through a “bottom-up model” (as in pharmacotherapy) or a “top-down model” (initially conceived of with cognitive therapy). Our findings support the notion that rTMS could act through another top-down mechanism, affecting deeper limbic structures by directly stimulating connected cortical areas.
The Role of Increasing Distance from Skull to Outer Cortex
It is known that the magnetic intensity generated underneath a TMS coil declines exponentially,2 and neurophysiological studies suggest that stimulations with insufficient intensity will not cause neuronal depolarization. This study does point out the relevant role played by the distance from site of stimulation and local brain activity. In an earlier report, we have found that although distances from scalp to both motor cortex and prefrontal cortex increase with age and do correspond to each other, the distance to prefrontal cortex appears to increase faster with age than the distance to motor cortex. Given the fact that the intensity of stimulation in this study was tailored to the MT, it does raise the question whether the lack of clinical antidepressant responses in the elderly across TMS studies is due to nonadjusted prefrontal intensities.55
With small samples and unequal initial distribution, we failed to show differences between the active and placebo groups in how their rCBF changed across time.
Limitations of the Present Study
Several limitations of the current study are important in interpreting the results. The experimental design was conducted in a depressed cohort. It is not clear whether one can extrapolate these findings to nondepressed subjects. Furthermore, the second SPECT scan took place during the 5th rTMS session. Thus, any change from baseline could represent specific responses related to the underlying illness and its response course or to effects of the previous four treatments, or to the effects of the previous 18 minutes of TMS. The intracerebral localization of Tc-99m bicasate requires up to 60 seconds for regional perfusion and deesterification of the parent compound. Maximizing the on/off ratio of rTMS to coincide with radiotracer settlement in brain tissue does not guarantee the “during-stimulation” design. That is, the actual scan represents an average of brain activity over several minutes, some of which was during stimulation and some of which was during rest between stimulations. Recent studies with fMRI show that locally and remotely, blood flow during TMS changes from rest to stimulation with only a standard 3-second lag.56,57 Additionally, the differences seen in fast versus slow TMS at the site of stimulation could be the result of the prior 18 minutes (since it is the same parameters during the last 2 minutes), or the additive effect of five sessions from the start of treatment. The exact amount of time represented by the image is also unclear, varying between 30 and 180 seconds. Furthermore, perfusion SPECT can yield information only about brain changes relative to other brain regions, not about absolute brain activity.
The study also suffers from a small sample size and a heterogeneous group of depressed subjects (3 on concomitant mood stabilizers), which could influence the results. Our small numbers limit the interpretation of the results found by comparing the frequency of rTMS and relative blood flow, but they hint at differences. Finally, the relationship observed between the distance from TMS coil to cortex and local brain activity was with both frequencies combined, even though both were equally distributed. This does not allow one to address the contribution of each frequency to such correlation.
Findings From Other Research
There have been other imaging studies examining the effect of rTMS on prefrontal cortex activity. Using an FDG PET split-dose design, Kimbrell et al.27 found that slow (1 Hz) rTMS over 20 minutes compared with a baseline or sham condition was associated with global reductions in glucose metabolism. Further, there were localized relative reductions in activity in the left dorsolateral prefrontal cortex (the TMS site), and connected regions such as the caudate, the orbitofrontal cortex bilaterally, and the cerebellum. Our group at MUSC recently used perfusion SPECT in 8 healthy adults58 to image cerebral blood flow during fast (20 Hz) left DLPFC rTMS, following the same modification in stimulation parameters as in the present study. Compared with a control scan with sham TMS, George et al. reported relative decreases in the right prefrontal cortex, anterior cingulate and bilateral anterior temporal cortices. rTMS produced relative increases in blood flow in the orbitofrontal cortex (L≥R), hypothalamus, brainstem, and cerebellum. Contrary to the pre-study hypothesis, there was no increase in rCBF at the coil site compared with baseline. Recently, Loo et al.59 presented pilot work detailing the effect of 3 minutes of 15-Hz left prefrontal rTMS in 5 depressed subjects and found increased activity in the prefrontal cortex (L≥R) and anterior left temporal lobe compared to a control scan with sham TMS. Recently, a PET study40 showed that in a depressed heterogeneous group, 20 Hz rTMS increased the global absolute cerebral blood flow, whereas 1 Hz TMS decreased blood flow and therefore cerebral activity. And as mentioned above, in an analysis of different scans of the same cohort as in the present study (before and after the 2 weeks of treatment), Teneback et al.41 reported the effect of 2 weeks of left prefrontal rTMS in a depressed cohort and found greater differences in inferior frontal blood flow in responders compared with nonresponders, and negative correlations between depression severity and limbic and prefrontal blood flow, initially found at baseline, disappeared. At MUSC, we have recently performed 1 Hz prefrontal TMS interleaved with functional magnetic resonance imaging (fMRI) in healthy controls. This method suggests a local increase in blood-oxygen-level-dependent (BOLD) signal underneath the coil following 20 seconds of stimulation, as well as increases in distant regions that is bilateral and dose dependent.57
Potential for Research
Examination of the regional brain activity changes produced by prefrontal rTMS offers the potential for understanding TMS regional neuroanatomic mechanisms of action, although clearly much more work is needed both in conjunction with antidepressant trials and in healthy subjects. Perfusion SPECT has many relative disadvantages (poor temporal and spatial resolution; involves radiation) but can address some hypotheses about TMS brain effects. With SPECT, one can inject the radiotracer virtually anywhere, and later transport the subject to the actual scanner. Thus there is no concern about whether the TMS coil produces artifacts in the scan—a concern in interleaved PET and MRI TMS studies. More research into the regional brain effects of TMS will likely also provide information about the antidepressant effect of TMS compared with other antidepressant treatments such as antidepressant medications and electroconvulsive therapy.60,61
ACKNOWLEDGMENTS
This work received support from DuPont Pharma (grant in kind for the SPECT tracer), Young Investigator and Independent Investigator Awards (Dr. George), The National Alliance for Research in Schizophrenia and Depression, and The Stanley Foundation (Dr. George).

FIGURE 1. Illustration of the different comparisons used in SPM to generate activation maps

FIGURE 2. Illustration of the sequence of events in acquiring the SPECT scan during the 5th rTMS session

FIGURE 3. Changes in rCBF during active left prefrontal rTMS from baseline compared with the changes in placebo stimulation from baselinerCBF decreases in the left middle temporal gyrus (blue; P=0.001). Note the unequal initial distribution in rCBF in baseline groups, which likely is the cause of the between-group differences.

FIGURE 4. Specific changes related to different frequencies: superimposed increases in left prefrontal (red) and decreases in left mid-cingulate and left hippocampus (blue) in rCBF during fast left prefrontal TMS compared with slow rTMSNote the site underneath the coil (42, 14, 48).

FIGURE 5. Normalized rCBF (SPECT) below left dorsolateral prefrontal cortex stimulation site in 9 depressed subjectsNegative correlation with distance of scalp (TMS coil) to outer cortex.
 |
 |
1 Saypol JM, Roth BJ, Cohen LG, et al: A theoretical comparison of electric and magnetic stimulation of the brain. Ann Biomed Eng 1991; 19:317-328Crossref, Medline, Google Scholar
2 Bohning DE: Introduction and overview of TMS physics, in Transcranial Magnetic Stimulation in Neuropsychiatry, edited by George MS, Belmaker RH. Washington, DC, American Psychiatric Press, 2000, pp 13-44Google Scholar
3 George MS, Lisanby SH, Sackeim HA: Transcranial magnetic stimulation: applications in neuropsychiatry. Arch Gen Psychiatry 1999; 56:300-311Crossref, Medline, Google Scholar
4 Ziemann U, Hallett M: Basic neurophysiological studies with TMS, in Transcranial Magnetic Stimulation in Neuropsychiatry, edited by George MS, Belmaker RH. Washington, DC, American Psychiatric Press, 2000, pp 45-98Google Scholar
5 George MS, Wassermann EM, Williams W, et al: Changes in mood and hormone levels after rapid-rate transcranial magnetic stimulation of the prefrontal cortex. J Neuropsychiatry Clin Neurosci 1996; 8:172-180Link, Google Scholar
6 Dhuna A, Gates JR, Pascual-Leone A: Induction of seizures but lack of activation of epileptic foci in epileptic patients with rapid transcranial magnetic stimulation (abstract). Ann Neurol 1990; 28:264Google Scholar
7 Pascual-Leone A, Valls-Sole J, Brasil-Neto JP, et al: Akinesia in Parkinson's disease, II: effects of subthreshold repetitive transcranial motor cortex stimulation. Neurology 1994; 44:892-898Crossref, Medline, Google Scholar
8 Greenberg BD, George MS, Dearing J, et al: Effect of prefrontal repetitive transcranial magnetic stimulation (rTMS) in obsessive-compulsive disorder: a preliminary study. Am J Psychiatry 1997; 154:867-869Crossref, Medline, Google Scholar
9 Nahas Z, McConnell K, Collins S, et al: Could left prefrontal rTMS modify negative symptoms and attention in schizophrenia? (abstract). Biol Psychiatry 1999; 45:37S #120Google Scholar
10 George MS, Wassermann EM, Williams WA, et al: Daily repetitive transcranial magnetic stimulation (rTMS) improves mood in depression. NeuroReport 1995; 6:1853-1856Crossref, Medline, Google Scholar
11 Greenberg BD, George MS, Dearing J, et al: Effect of repetitive transcranial magnetic stimulation on mood, anxiety and obsessive compulsive symptoms in OCD (abstract). American Psychiatric Association 148th Annual Meeting: New Research Program 1995; 191Google Scholar
12 Pascual-Leone A, Rubio B, Pallardo F, et al: Beneficial effect of rapid-rate transcranial magnetic stimulation of the left dorsolateral prefrontal cortex in drug-resistant depression. Lancet 1996; 348:233-237Crossref, Medline, Google Scholar
13 Williams W, Steppel J, George MS, et al: Rapid transcranial magnetic stimulation (rTMS) in prefrontal cortex: mood and neuroendocrine effects (abstract). Neurology 1995; 45:178 #68PCrossref, Medline, Google Scholar
14 Pascual-Leone A, Catala MD, Pascual AP: Lateralized effect of rapid-rate transcranial magnetic stimulation of the prefrontal cortex on mood. Neurology 1996; 46:499-502Crossref, Medline, Google Scholar
15 Hoflich G, Kasper S, Hufnagel A, et al: Application of transcranial magnetic stimulation in treatment of drug-resistant major depression: a report of two cases. Human Psychopharmacology 1993; 8:361-365Crossref, Google Scholar
16 Kolbinger HM, Hoflich G, Hufnagel A, et al: Transcranial magnetic stimulation (TMS) in the treatment of major depression: a pilot study. Human Psychopharmacology 1995; 10:305-310Crossref, Google Scholar
17 George MS, Wassermann EM, Williams WA, et al: Daily left prefrontal rTMS in outpatient depression: initial results of a double-blind placebo controlled crossover trial (abstract). American Psychiatric Association 149th Annual Meeting, 1996; 280Google Scholar
18 Loo C, Mitchell P, Sachdev P, et al: rTMS: A sham-controlled trial in medication-resistant depression (abstract). Biol Psychiatry 1998; 43:95S #317Google Scholar
19 Grunhaus L, Dannon P, Schrieber S: Effects of transcranial magnetic stimulation on severe depression: similarities with ECT (abstract). Biol Psychiatry 1998; 43:76S #254Crossref, Medline, Google Scholar
20 Padberg F, Haag C, Zwanzger P, et al: Rapid and slow transcranial magnetic stimulation are equally effective in medication-resistant depression: a placebo-controlled study (abstract). Collegium Internationale Neuro-Psychopharmacologicum (CINP) Abstracts 1998; 21st Congress:103-st0306Google Scholar
21 Pridmore S, Filho JAF, Nahas Z, et al: Motor threshold in transcranial magnetic stimulation: a comparison of a neurophysiological and a visualization of movement method. J ECT 1998; 14:25-27Crossref, Medline, Google Scholar
22 George MS, Wassermann EM, Williams WE, et al: Mood improvements following daily left prefrontal repetitive transcranial magnetic stimulation in patients with depression: a placebo-controlled crossover trial. Am J Psychiatry 1997; 154:1752-1756Crossref, Medline, Google Scholar
23 Grisaru N, Chudakov B, Yaroslavsky Y, et al: TMS in mania: a controlled study. Am J Psychiatry 1998; 155:1608-1610Crossref, Medline, Google Scholar
24 Berman RM, Narasimhan M, Sanascora G, et al: A randomized clinical trial of repetitive transcranial magnetic stimulation in the treatment of major depression. Biol Psychiatry 2000; 47:332-337Crossref, Medline, Google Scholar
25 George MS, Wassermann EM, Williams W, et al: Changes in mood and hormone levels after rapid-rate transcranial magnetic stimulation of the prefrontal cortex. J Neuropsychiatry Clin Neurosci 1996; 8:172-180Link, Google Scholar
26 Wassermann EM, Kimbrell TA, George MS, et al: Local and distant changes in cerebral glucose metabolism during repetitive transcranial magnetic stimulation (rTMS) (abstract). Neurology 1997; 48:A107-P02.049Google Scholar
27 Kimbrell TA, George MS, Danielson AL, et al: Changes in cerebral metabolism during transcranial magnetic stimulation (abstract). Biol Psychiatry 1997; 41:108S-#374Google Scholar
28 Paus T, Jech R, Thompson CJ, et al: Transcranial magnetic stimulation during positron emission tomography: a new method for studying connectivity of the human cerebral cortex. J Neurosci 1997; 17:3178-3184Crossref, Medline, Google Scholar
29 Paus T, Jech R, Thompson CJ, et al: Dose-dependent reduction of cerebral blood flow during rapid-rate transcranial magnetic stimulation of the human sensorimotor cortex. J Neurophysiol 1997; 79:1102-1107Google Scholar
30 Fox P, Ingham R, George MS, et al: Imaging Human intra-cerebral connectivity by PET during TMS. Neuroreport 1997; 8:2787-2791Crossref, Medline, Google Scholar
31 George MS, Stallings LE, Speer AM, et al: Prefrontal repetitive transcranial magnetic stimulation (rTMS) changes relative perfusion locally and remotely. Human Psychopharmacology 1999; 14:161-170Crossref, Google Scholar
32 George MS, Nahas Z, Bohning DE, et al: Transcranial magnetic stimulation and neuroimaging, in Transcranial Magnetic Stimulation in Neuropsychiatry, edited by George MS, Belmaker RH. Washington, DC, American Psychiatric Press, 1999, pp 253-268Google Scholar
33 Wassermann EM, Wedegaertner FR, Ziemann U, et al: Crossed reduction of motor cortex excitability by 1 Hz transcranial magnetic stimulation. Neurosci Lett 1998; 250:141-144Crossref, Medline, Google Scholar
34 Post RM, Kimbrell TA, McCann UD, et al: Repetitive transcranial magnetic stimulation as a neuropsychiatric probe tool: present status and future potential. J ECT 1999; 15:39-59Crossref, Medline, Google Scholar
35 Malenka RC, Nicoll RA: Long-term potentiation: a decade of progress? Science 1999; 285(5435):1870-1974Google Scholar
36 Malenka RC, Kauer JA, Perkel DJ, et al: The impact of postsynaptic calcium on synaptic transmission: its role in long-term potentiation. Trends Neurosci 1989; 12:444-450Crossref, Medline, Google Scholar
37 Bear MF: Homosynaptic long-term depression: a mechanism for memory? Proc Natl Acad Sci USA 1999; 96:9457-9458Crossref, Medline, Google Scholar
38 Linden DJ: The return of the spike: postsynaptic action potentials an the induction of LTP and LTD. Neuron 1999; 22:661-666Crossref, Medline, Google Scholar
39 Chen R, Classen J, Gerloff C, et al: Depression of motor cortex excitability by low-frequency transcranial magnetic stimulation. Neurol 1997; 48:1398-1403Crossref, Medline, Google Scholar
40 Kimbrell TA, Little JT, Dunn RT, et al: Frequency dependence of antidepressant response to left prefrontal repetitive transcranial magnetic stimulation (rTMS) as a function of baseline cerebral glucose metabolism. Biol Psychiatry 1999; 46:1603-1613Crossref, Medline, Google Scholar
41 Teneback CT, Nahas Z, Speer AM, et al: Changes in prefrontal cortex and paralimbic activity in depression following two weeks of daily left prefrontal TMS. J Neuropsychiatry Clin Neurosci 1999; 11:426-435Abstract, Google Scholar
42 Hamilton M: A rating scale for depression. J Neurol Neurosurg Psychiatry 1960; 12:56-62Crossref, Google Scholar
43 Kozel FA, Nahas Z, DeBrux C, et al: How coil-cortex distance relates to age, motor threshold, and antidepressant response to repetitive transcranial magnetic stimulation. J Neuropsychiatry Clin Neurosci 2000; 12:376-384Link, Google Scholar
44 Alexander GE, DeLong MR, Strick PL: Parallel organization of functionally segregated circuits linking basal ganglia and cortex. Annu Rev Neurosci 1986; 9:357-381Crossref, Medline, Google Scholar
45 Lorberbaum JP, Wassermann EM: Safety concerns of transcranial magnetic stimulation, in Transcranial Magnetic Stimulation in Neuropsychiatry, edited by George MS, Belmaker RH. Washington, DC, American Psychiatric Press, 2000, pp 141-162Google Scholar
46 Nahas Z, Speer AM, Molloy M, et al: Role of stimulation frequency in the antidepressant effect of left prefrontal rTMS (abstract). Biol Psychiatry 1999; 45:79S #256Google Scholar
47 Lisanby SH, Luber B, Finck D, et al: Primate models of transcranial magnetic stimulation (abstract). Biol Psychiatry 1998; 41:76SGoogle Scholar
48 Loo CK, Taylor JL, Gandevia SC, et al: Transcranial magnetic stimulation (TMS) in controlled treatment studies: are some “sham” forms active? Biol Psychiatry 2000; 47:325-331Crossref, Medline, Google Scholar
49 Lisanby SH, Sackeim HA: TMS in major depression, in Transcranial Magnetic Stimulation in Neuropsychiatry, edited by George MS, Belmaker RH. Washington, DC, American Psychiatric Press, 1998, pp 185-200Google Scholar
50 Lisanby SH, Luber B, Schroeder C, et al: Intracerebral measurement of rTMS and ECS induced voltage in vivo (abstract). Biol Psychiatry 1998; 43:100SCrossref, Google Scholar
51 Friston KJ, Passingham RE, Nutt JG, et al: Localisation in PET images: direct fitting of the intercommissural (AC-PC) line. J Cereb Blood Flow Metab 1989; 9:690-695Crossref, Medline, Google Scholar
52 Malonek D, Grinvald A: Interactions between electrical activity and cortical microcirculation revealed by imaging spectroscopy: implications for functional brain mapping. Science 1996; 272:551-554Crossref, Medline, Google Scholar
53 Kozel FA, Nahas Z, DeBrux C, et al: Scalp to prefrontal cortex distance increases with age and might influence the antidepressant effect of left prefrontal rTMS (abstract). American Psychiatric Association 152nd Annual Meeting, 1999; 112-NR181Google Scholar
54 Mayberg HS, Liotti M, Brannan SK, et al: Reciprocal limbic-cortical function and negative mood: converging PET findings in depression and normal sadness. Am J Psychiatry 1999; 156:675-682Medline, Google Scholar
55 Figiel GS, Epstein C, McDonald WM, et al: The use of rapid-rate transcranial magnetic stimulation (rTMS) in refractory depressed patients. J Neuropsychiatry Clin Neurosci 1998; 10:20-25Link, Google Scholar
56 Bohning DE, Shastri A, McConnell K, et al: A combined TMS/fMRI study of intensity-dependent TMS over motor cortex. Biol Psychiatry 1999; 45:385-394Crossref, Medline, Google Scholar
57 Nahas Z, Lomarev M, Roberts DR, et al: Left prefrontal transcranial magnetic stimulation produces intensity dependent bilateral effects as measured with interleaved BOLD fMRI (abstract). Hum Brain Mapp 2000; 11:520Google Scholar
58 Stallings LE, Speer AM, Spicer KM, et al: Combining SPECT and repetitive transcranial magnetic stimulation (rTMS): left prefrontal stimulation decreases relative perfusion locally in a dose-dependent manner (abstract). Neuroimage 1997; 5:S521Google Scholar
59 Loo CK, Taylor JL, Gandevia SC, et al: Transcranial magnetic stimulation in depression (abstract). Biol Psychiatry 1999; 45:133SCrossref, Google Scholar
60 Mayberg HS, Brannan SK, Mahurin RK, et al: Cingulate function in depression: a potential predictor of treatment response. Neuroreport 1997; 8:1057-1061Crossref, Medline, Google Scholar
61 Nobler MS, Sackeim HA, Prohovnik I, et al: Regional cerebral blood flow in mood disorders, III: treatment and clinical response. Arch Gen Psychiatry 1994; 51:884-897Crossref, Medline, Google Scholar