Temporal Lobe Deficits in Murderers
Abstract
This study evaluates electroencephalography (EEG) and positron emission tomography (PET) in the same subjects. Fourteen murderers were assessed by using both PET (while they were performing the continuous performance task) and EEG during a resting state. EEG revealed significant increases in slow-wave activity in the temporal, but not frontal, lobe in murderers, in contrast to prior PET findings that showed reduced prefrontal, but not temporal, glucose metabolism. Results suggest that resting EEG shows empirical utility distinct from PET activation findings.
Early electroencephalographic (EEG) studies on violence reported general abnormalities and increases in slow-wave activity.1 Whereas earlier studies were generally more qualitative, EEG technology has become increasingly more advanced, allowing for detailed quantitative computerized analyses in place of clinical visual inspection. Results from these types of studies have specifically indicated temporal and/or frontal abnormalities in violent subjects,2–8 and some studies have prospectively noted the ability of these deficits to predict later violent and criminal behavior.9,10 Thus, evidence indicates that both frontal and temporal EEG abnormalities are associated with violent behavior.
Despite advances in EEG technology, EEG studies of antisocial groups have become less common over the last several years. The development of more advanced functional brain imaging techniques such as PET and fMRI has begun to dominate the field and bring into question the clinical and research utility of EEG. These relatively newer techniques provide better spatial resolution and allow for the examination of specific subcortical structures instead of relying on the summation of relatively diffuse activity as EEG does.11 Results with imaging studies of this type have generally confirmed earlier EEG findings in violent and aggressive subjects. Although both frontal and temporal abnormalities have been consistently noted in brain imaging studies of violent subjects, not all studies have observed deficits in both regions.12–16 With the increased spatial resolution of these techniques, subcortical structures have also been noted to show reduced metabolism in violent patients.14
Some studies have made use of activation tasks during imaging or glucose uptake to activate those brain areas hypothesized to be dysfunctional in violent offenders.17 Recently, Raine et al.18 reported on 41 murderers pleading not guilty by reason of insanity. These subjects all received fluorodeoxyglucose (FDG) PET scans in which they performed the continuous performance task (CPT), a frontal lobe challenge. These subjects were found to have bilaterally reduced glucose utilization in the prefrontal cortex, increased glucose metabolism in the occipital cortex, and no difference in the temporal cortex compared with matched control subjects. Murderers also showed significantly lower left and greater right amygdala and hippocampus glucose metabolism compared with control subjects. Using neuropsychological tasks to activate specific areas of the brain during imaging may illustrate dysfunction that is specific to the performance of those regions and that may not be detected in a resting state.
Because of the relatively higher regional spatial resolution provided by these newer imaging techniques, it is tempting to assume that they will provide more information than can be obtained with EEG. Some studies have begun to compare information obtained by both EEG and PET in the same subjects to determine what, if any, relationship exists between them.19–21 Results for some studies have shown that EEG and activation PET convey similar information regardless of whether the EEG was taken simultaneously to glucose uptake or separately in a resting state.19,20 One study found the combination of EEG and PET to reach higher diagnostic sensitivity than either method alone, suggesting that each is contributing unique information.21 Results from this study suggest that it is possible that the information obtained from EEG is qualitatively different from that obtained with PET, and that more diagnostic information could potentially be rendered by combining the findings from the two techniques.
We had an opportunity to address this issue in a sample of murderers. Of the 41 murderers examined by Raine, 14 had undergone resting EEG. This situation allows a test of the possibility that EEG provides incremental information over and above PET. Alternatively, EEG may provide information that is the same as that conveyed by PET, as has been suggested.19,20 If EEG and PET are measuring similar activation and conveying the same information, results of EEG analyses in this sample should demonstrate a bilateral increase in slow-wave activity over the frontal lobe, which would reflect the reduction in prefrontal glucose metabolism detected by PET in the original study.18 Likewise, an increase in fast wave (beta) activity would appear in the occipital cortex corresponding with the increase in metabolism found earlier with PET, and no differences would be evident in the temporal lobes. However, if EEG does provide information beyond what can be obtained from activation-state PET, a different pattern of abnormality could arise. This study tests these competing predictions.
METHODS
Subjects
The experimental group consisted of 14 murderers (12 male, 2 female) with a mean age of 34.5±6.90 years (mean±SD reported throughout). The murderer group consisted of subjects undergoing medical evaluation at the University of California, Irvine, imaging center as a part of their plea of not guilty by reason of insanity, or during the penalty phase of the trial. Details have been published previously.18
A control group was matched as closely as possible for age and gender. Control subjects also consisted of 12 male and 2 female subjects, with a mean age of 36.9±8.72 years. A two-tailed t-test revealed no significant difference between the groups for age (t=−0.817, df=1,26, P=0.421). Chi-square analyses revealed no significant differences for gender (mean±SD: murderers, 1.14±0.36; control subjects, 1.14±0.36; χ2=0.000, df=1,1, P=1.0), ethnicity (murderers, 1.79±1.12; control subjects, 1.21±0.58; χ2=4.229, df=1,3, P=0.238) or handedness (murderers, 1.86±0.36; control subjects, 2.00±0.00; χ2=2, 154, df=1,1, P=0.142). All subjects were informed of the procedures and signed consent forms approved by the University of California, Irvine, Human Subjects Committee.
Because this subject sample represents only a portion of the subjects involved in the original PET study, analyses were conducted to determine if the subgroup of 14 subjects with EEG and PET data differed significantly from the remaining 27 original subjects with only PET data. No significant differences were found between the groups for age, gender, ethnicity, handedness, head injury, temporal glucose metabolism, or prefrontal glucose metabolism (all P>0.20).
EEG Procedure
EEG was recorded while the subjects rested with their eyes closed and prior to PET scanning. Full details of EEG recording have been published previously.19 Briefly, EEG epochs were visually screened for eye movement and other artifacts blind to knowledge of group membership, and artifacted epochs were deleted. Power spectrum estimates were computed by using a fast Fourier transform and expressed as magnitude values in microvolts (square root of power). EEG values were normalized by subtracting the mean of all leads within a frequency band from the raw power value for each lead and dividing by the standard deviation of all other leads within that frequency.19,20 Values were z-transformed in order to account for individual ranges of variation, and to create transformations analogous to the PET data collected from the same subjects. Five bands of EEG activity were measured: delta (0.78–4.30 cps), theta (4.34–7.80 cps), alpha (8.20–12.90 cps), beta1 (13.30–19.90 cps), and beta2 (20.00–30.00 cps).
PET Procedure
Full details on PET scanning procedures have been published previously.18 Briefly, fluorodeoxyglucose (FDG) was injected into the subject in the test room and taken up by the brain for a 32-minute period during which the subject completed a degraded stimulus version of the CPT.22 This task was employed because it has been shown to produce increases in relative glucose metabolism in the frontal lobes in normal control subjects, as well as increases in right temporal and parietal lobes.23 Brain regions were identified using the cortical peel and box techniques.23,24
Statistical Analysis
We selected 20 of the 32 leads and entered them into a 4×5 matrix. Factors in the design include 5 “lobes” or leads grouped together in the anterior–posterior direction and 4 “hemispheres,” leads grouped together in the medial–lateral position. Significant main effects for either factor were to be followed up with individual t-tests in order to determine the specific location of the effect. See Figure 1 for a visual depiction of the design.19 A repeated-measures multivariate analysis of variance (MANOVA)25 was performed with a 2 (group) by 4 (column) by 5 (row) design. The grouping factor is between subjects and the other two factors within subjects. The 4 columns of leads are designed to test medial–lateral effects and the 5 rows of leads are designed to test anterior–posterior effects. Follow-up t-tests were two-tailed in every case.
RESULTS
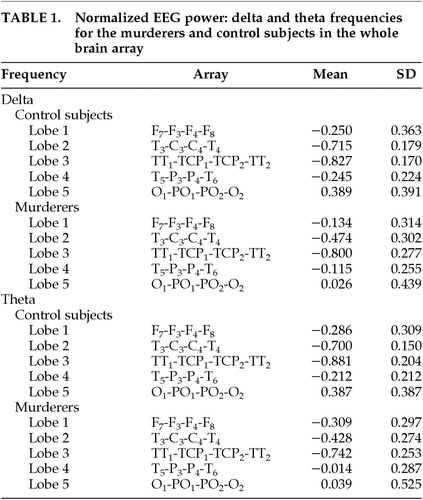
Means for normalized EEG power at delta and theta frequencies in the whole brain array are shown in Table 1.
Delta
No main effect for group was found (F=0.903, df=1,26, P=0.351). However, a significant group-by-lobe interaction effect was obtained in the delta frequency (F=4.96, df=4,23,P=0.005). Follow-up t-tests revealed that the effect existed for lobes 2 and 5 of the matrix. This corresponds to murderers having an increase of delta in the temporal-central leads in row 2 (T3, C3, C4, T4) compared with control subjects (means: murderers, −0.474; control subjects, −0.715; t=−2.575, df=1,26, P=0.016). The effect for lobe 5 (O1, PO1, PO2, O2) corresponds to a decrease in delta for the murderers compared with control subjects (means: murderers, 0.026; control subjects, 0.389; t=2.311, df=1,26, P=0.029). There were no significant interactions with hemisphere (all P>0.13).
Because lobe 2 consists of both temporal and central leads, t-tests were conducted to specify the region of the brain that differs between murderers and control subjects. The temporal leads T3 and T4 were averaged together to create a measure of temporal lobe because there were no laterality effects. The same was done with the central leads C3 and C4. We conducted t-tests for the temporal and the central lobe measures, and results indicate that the temporal leads differ significantly, with murderers showing an increase in delta in these leads (means: murderers, −1.04; control subjects, −1.43; t=−2.502, df=1,26, P=0.019). Central leads did not differ significantly (means: murderers, 0.092; control subjects, −0.003; t=−0.834, df=1,26, P=0.412).
Theta
No main effect for group was found (F=2.039, df=1,26, P=0.165). However, a significant group-by-lobe interaction effect was obtained for theta activity (F=5.63, df=4,23, P=0.003). Follow-up t-tests revealed the effects to be due to lobes 2 and 4 of the matrix. Murderers had an increase in theta for the temporal-central leads of lobe 2 (T3, C3, C4, T4), compared with control subjects (means: murderers, −0.428; control subjects, −0.699; t=−3.242, df=1,26, P=0.003). A similar result was found for temporal-parietal leads of lobe 4 (T5, P3, P4, T6), with murderers showing an increase in theta (means: murderers, −0.014; control subjects, −0.212; t=−2.080, df=1,26, P=0.048). The parietal-occipital lobe 5 (O1, PO1, PO2, O2) showed a decrease in theta for the murderers that was similar to the effect for delta described above, but in this case the effect was marginal (t=1.996, df=1,26, P=0.056). There was no lateralization effect for the theta frequency, since there were no interactions with hemisphere (all P>0.31).
As with the delta frequency, t-tests were run to determine the specific regions of the brain producing differences in lobes 2 (between central and temporal) and lobe 4 (between temporal and parietal). Leads within each lobe were averaged to create one measure, since no laterality effects were found. Results of the t-test for lobe 2 indicate that murderers show greater theta in the temporal leads than control subjects (means: murderers,−1.155; control subjects, −1.539; t=−2.860, df=1,26, P=0.008). Results for central leads were not significant (means: murderers, 0.298; control subjects, 0.1411; t=−1.525, df=1,26, P=0.139). For lobe 4, neither the temporal nor the parietal leads were significant (all P>0.12).
Alpha
No main group effect was found (F=0.002, df=1,26, P>0.97). There were also no interaction effects for lobe or hemisphere (all P>0.27).
Beta
No main group effect was found for the beta1 or beta2 frequencies (respectively, F=0.012, df=1,26, P=0.914; and F=1.082, df=1,26, P=0.31). A significant interaction effect for lobe by group was found for beta1 (F=4.74, df=4,23, P=0.006). Follow-up t-tests revealed that the effect was specific to lobe 4 (temporal-parietal areas T5, P3, P4, T6; t=−2.384, df=1,26, P=0.025), with murderers showing an increase in beta1 compared with control subjects (means: murderers, 0.216; control subjects, −0.056). No interaction effects were found for beta2 activity (all P>0.13).
Relationship of EEG to Other Temporal PET Measures
EEG findings suggest a deficit in the temporal area (indicated by an increase in slow-wave activity) not apparent from PET. However, EEG largely provides information on lateral cortical activity, whereas PET provides information on subcortical as well as cortical activity. It is therefore possible that the mesial temporal findings in murderers from PET (reduced left relative to right amygdala and hippocampal activity) relate to the temporal findings in EEG. To examine this possibility, a logistic regression analysis was conducted using the temporal-central (lobe 2) theta and left amygdala and hippocampus measures to predict group differences. Left amygdala and left hippocampus values were entered into the logistic regression in step 1, using forced entry. EEG measures were then added, using the forward Wald method. The temporal-central leads theta (consisting of leads T3, C3, T4, C4) predicted group membership over and above variance accounted for by the PET measures (χ2= 9.92, df=1, P=0.002). Overall these variables are able to predict group membership with 82.14% accuracy. Conducting this regression using delta in the temporal-central leads also shows that delta in these leads predicts group membership above variance accounted for by PET measures (χ2=7.05, df=1, P=0.008). These variables are able to predict group membership with an accuracy of 75.00%. These results suggest that temporal EEG findings are not accounted for by any mesial temporal glucose metabolism measured in the original PET study. Therefore EEG appears to be detecting new information not reflected in PET measures.
DISCUSSION
Results from this study suggest that activation PET and resting EEG provide different information regarding brain dysfunction in murderers. EEG temporal-central dysfunction could not be explained by PET findings previously reported, which include reduced prefrontal, left amygdala, left hippocampus, left angular gyrus, and increased occipital glucose metabolism.18 Conversely, slow-wave EEG was not detected in frontal leads, yet as indicated in the previous PET study, glucose metabolism was lowered in the prefrontal cortex.18 However, decreases in EEG slow-wave activity in the occipital lobe may relate to increased glucose metabolism in the PET findings of the murderers. These findings are of potential importance because studies of violent offenders do not use multiple imaging techniques, and thus may miss potentially important findings. These methodological differences may also contribute significantly to the conflict in findings between various studies.
The neurological literature on violent behavior indicates that dysfunction in the frontal or the temporal lobe may result in violence.26 Consistent with these reports, the subjects presented in this study also showed functional deficits in both the frontal and temporal regions of the brain, when assessed with different imaging techniques and modalities. One possible explanation for the current discrepant findings is that EEG measures a neurophysiological process distinct from that measured by PET. EEG is thought to measure the postsynaptic potential of neurons in the cortex, and thus to represent electrical activity.27 PET, on the other hand, measures utilization of glucose by the neurons.28 Therefore, the findings may be explained by the different neurophysiological processes to which these imaging techniques are sensitive.
A second possible explanation is that differences may be accounted for by the different activation states between the two assessments. The prefrontal PET findings previously reported in murderers were obtained from a frontal neuropsychological challenge task (CPT) during glucose uptake. This task is specifically designed to assess the function of the frontal lobe. Conversely, EEG, which identified temporal deficits, was obtained in a resting condition. One possibility is that CPT activation will reveal frontal deficits, while resting states will illuminate temporal deficits. This same explanation was offered by Seidenwurm and colleagues,15 who found reduced temporal glucose in a resting state PET but failed to obtain the reduced prefrontal metabolism found in Raine et al.18 On the other hand, several functional imaging studies have been able to detect frontal deficits even in a resting state.14,29,30 Therefore, it is possible that the discrepancy between resting and activation states does not entirely account for the differences noted in this study.
Advances in the field of brain imaging have provided exciting techniques for studying neural activation. Although advanced brain imaging techniques such as PET are expensive and invasive, they are superior to EEG for assessing subcortical structures suspected to be involved in violence, as well as offering better spatial resolution. While EEG does not have these same attributes, it may still offer potentially unique information. Several researchers have begun to compare EEG and PET data in the same groups of subjects,19–21 with varied results. Results from this study indicate that in order to maximize the different utility of each method, one may combine activation and resting states. Because of the radioactivity involved in PET research, it is often not feasible to assess subjects with two PET scans. Therefore, one possible solution is to use resting EEG to supplement activation studies with these other techniques. The study presented here provides evidence that EEG is sufficiently sensitive to detect group differences, even in relatively small sample sizes. Thus, resting EEG may continue to be an important tool in the neurological assessment of violent subjects despite the technical superiority of imaging technology.
Caution must be taken in interpreting these findings, however. Having subjects evaluated with two different imaging techniques in two different states of activation creates obvious problems in the identification of the causes of the findings. However, results from this study do suggest that utilizing both resting EEG and activation PET may be useful to researchers wishing to increase the amount of information gathered without substantially increasing time, cost, or threat to subject. Future research could explore this relationship in more detail by comparing both a resting and an activation PET with EEG data collected simultaneously to FDG uptake. Additionally, the subject population presents a problem with generalization. Subjects' sanity was brought into question during the course of their trial; however, details about psychological diagnoses are not known for these subjects, making it impossible to match control subjects on this variable. In addition, this may represent an extreme or selected group that may not generalize to other murderers or violent criminals. Future studies using multiple techniques and conducted on a less selected group of violent offenders have the potential to add substantially to knowledge on brain mechanisms subserving violence.
ACKNOWLEDGMENTS
This study was supported by NIMH Mental Health National Research Service Award 1-F31 MH12352-01A1 to L.M.G.-K. and by NIMH Independent Scientist Award K02 MH01114-01 to A.R. This work was previously presented at the 11th Annual Meeting of the American Neuropsychiatric Association, Fort Myers, FL, February 20–22, 2000.

FIGURE 1. Visual depiction of the 4×5 matrix design testing medial-lateral and anterior-posterior factors
 |
1 Volavka J: Neurobiology of Violence. Washington, DC, American Psychiatric Press, 1995Google Scholar
2 Volavka J: Aggression, electroencephalography, and evoked potentials: a critical review. Neuropsychiatry Neuropsychol Behav Neurol 1990; 3:249-259Google Scholar
3 Convit A, Czobor P, Volavka J: Lateralized abnormality in the EEG of persistently violent psychiatric inpatients. Biol Psychiatry 1991; 30:363-370Crossref, Medline, Google Scholar
4 Volkow ND, Tancredi L: Neural substrates of violent behaviour: a preliminary study with positron emission tomography. Br J Psychiatry 1987; 151:668-673Crossref, Medline, Google Scholar
5 Wong M, Lumsden J, Fenton GW, et al: Electroencephalography, computed tomography and violence ratings of male patients in a maximum-security mental hospital. Acta Psychiatr Scand 1994; 90:97-101Crossref, Medline, Google Scholar
6 Tancredi LR, Volkow N: Neural substrates of violent behavior: implications for law and public policy. Int J Law Psychiatry 1988; 11:13-49Crossref, Medline, Google Scholar
7 Fishbein DH, Herning RI, Pickworth WB, et al: EEG and brainstem auditory evoked response potentials in adult male drug abusers with self-reported histories of aggressive behavior. Biol Psychiatry 1989; 26:595-611Crossref, Medline, Google Scholar
8 Krynicki VE: Cerebral dysfunction in repetitively assaultive adolescents. J Nerv Ment Dis 1978; 166:59-67Crossref, Medline, Google Scholar
9 Lewis DO, Moy E, Jackson LD, et al: Biopsychosocial characteristics of children who later murder: a prospective study. Am J Psychiatry 1985; 142:1161-1167Crossref, Medline, Google Scholar
10 Raine A, Venables PH, Williams M: Relationships between central and autonomic measures of arousal at age 15 years and criminality at age 24 years. Arch Gen Psychiatry 1990; 47:1003-1007Crossref, Medline, Google Scholar
11 Swick D, Kutas M, Neville HJ: Localizing the neural generators of event-related brain potentials, in Localization and Neuroimaging in Neuropsychology, edited by Kertesz A. San Diego, CA, Academic Press, 1994, pp 73-121Google Scholar
12 Raine A: The Psychopathology of Crime. San Diego, CA, Academic Press, 1993Google Scholar
13 Henry B, Moffitt TE: Neuropsychological and neuroimaging studies of juvenile delinquency and adult criminal behavior, in Handbook of Antisocial Behavior, edited by Stoff DM, Breiling J, Maser JD. New York, Wiley, 1997, pp 280-288Google Scholar
14 Volkow ND, Tancredi LR, Grant C, et al: Brain glucose metabolism in violent psychiatric patients: a preliminary study. Psychiatry Res Neuroimaging 1995; 61:243-253Crossref, Medline, Google Scholar
15 Seidenwurm D, Pounds TR, Globus A, et al: Abnormal temporal lobe metabolism in violent subjects: correlation of imaging and neuropsychiatric findings. Am J Neuroradiol 1997; 18:625-631Medline, Google Scholar
16 Wong M, Fenwick P, Lumsden J, et al: Repetitive and non-repetitive violent offending behavior in male patients in a maximum security mental hospital: clinical and neuroimaging findings. Med Sci Law 1997; 37:150-160Crossref, Medline, Google Scholar
17 Intrator J, Hare R, Stritzke P, et al: A brain imaging (single photon emission computerized tomography) study of semantic and affective processing in psychopaths. Biol Psychiatry 1997; 42:96-103Crossref, Medline, Google Scholar
18 Raine A, Buchsbaum M, LaCasse L: Brain abnormalities in murderers indicated by positron emission tomography. Biol Psychiatry 1997; 42:495-508Crossref, Medline, Google Scholar
19 Guich SM, Buchsbaum MS, Burgwald L, et al: Effect of attention on frontal distribution of delta activity and cerebral metabolic rate in schizophrenia. Schizophr Res 1989; 2:439-448Crossref, Medline, Google Scholar
20 Valladares-Neto DC, Buchsbaum MS, Evans WJ, et al: EEG delta, positron emission tomography, and memory deficit in Alzheimer's disease. Biol Psychiatry 1995; 31:173-181Google Scholar
21 Szelies B, Mielke R, Herholz K, et al: Quantitative topographical EEG compared with FDG PET for classification of vascular and degenerative dementia. Electroencephalogr Clin Neurophysiol 1994; 91:131-139Crossref, Medline, Google Scholar
22 Nuechterlein KH, Parasuraman R, Jiang Q: Visual sustained attention: image degradation produces rapid decrement over time. Science 1983; 220:327-329Crossref, Medline, Google Scholar
23 Buchsbaum MS, Nuechterlein KH, Haier RJ: Glucose metabolic rate in normals and schizophrenics during the continuous performance test assessed by positron emission tomography. Br J Psychiatry 1990; 156:216-227Crossref, Medline, Google Scholar
24 Buchsbaum MS, Gillin JC, Wu J: Regional cerebral glucose metabolic rate in human sleep assessed by positron emission tomography. Life Sci 1989; 45:1349-1356Crossref, Medline, Google Scholar
25 Vasey WM, Thayer JF: The continuing problem of false positives in repeated measures ANOVA in psychophysiology: a multivariate solution. Psychophysiology 1987; 24:479-486Crossref, Medline, Google Scholar
26 Weiger WA, Bear DM: An approach to the neurology of aggression. J Psychiatr Res 1988; 22:85-98Crossref, Medline, Google Scholar
27 Barlow JS: The Electroencephalogram: Its Patterns and Origins. Cambridge, MA, MIT Press, 1993Google Scholar
28 Horwitz B: Neural modeling and positron emission tomography, in Functional Neuroimaging: Technical Foundations, edited by Thatcher RW, Hallett M, Zeffiro T, et al. San Diego, CA, Academic Press, 1994, pp 9-18Google Scholar
29 Kuruoglu AC, Arikan Z, Karatas M, et al: Single photon emission computerized tomography in chronic alcoholism: antisocial personality disorder may be associated with decreased frontal perfusion. Br J Psychiatry 1996; 169:348-354Crossref, Medline, Google Scholar
30 Goyer P, Andreason P, Semple W, et al: Positron-emission tomography and personality disorders. Neuropsychopharmacology 1994; 10:21-28Crossref, Medline, Google Scholar