Spatiotemporal Visual Processing in Schizophrenia
Abstract
Studies examining visual processing in schizophrenia have provided inconsistent results. In this study, the authors measured static and dynamic visual contrast sensitivity (CS) in patients with schizophrenia (n=20) and control subjects (n=15). Extrapyramidal symptoms were evaluated with the Simpson-Angus scale. In the static condition, the patients with schizophrenia showed reduced CS in the spatial frequency range of 2.9–14.4 cycles per degree of visual angle (c/d). In the dynamic condition, CS loss was present over the whole range tested (0.5–14.4 c/d). Higher Simpson-Angus scores and higher doses of antipsychotic medication were associated with more severe CS deficits. These results suggest that the hypodopaminergic state induced by antipsychotic medication may produce parkinsonian visual impairments in schizophrenia patients.
Progress in basic sciences fertilized the research on visual information processing in schizophrenia. One of the most important frameworks is the concept of transient and sustained visual channels, which are thought to be the functional equivalents of primate magnocellular (M) and parvocellular (P) pathways, respectively.1–4 These parallel routes are segregated from both morphological and functional points of view. The retinal origin of the M pathways comprises large ganglion cells projecting to the magnocellular layers of the lateral geniculate and then to layer 4C alpha of the primary visual cortex (V1). In contrast, the retinal origin of the P pathways includes small ganglion cells projecting to the parvocellular layers of the lateral geniculate and then to layer 4C beta of V1. Although evidence suggests that the parallel pathways interact at the level of V1,5,6 recent data suggest a definitive functional separation even at higher levels of visual information processing.7,8 The M system is responsible for the analysis of motion and spatial location, whereas the P system is related to the processing of pattern and color.1–4
Physiological data from animals and humans suggest that certain experimental parameters allow a relatively predominant stimulation of the parallel pathways. Transient channels show a higher sensitivity for stimuli with low spatial frequencies (<3 cycles per degree of visual angle [c/d]) and high temporal frequencies (4–15 Hz), whereas sustained channels can be better stimulated with patterns having high spatial and low temporal frequencies9–12 (Figure 1).
Contrast is one of the most important parameters for perceiving a stimulus against its background. For example, we are able to detect a black letter depicted on a white background because of the luminance contrast between them. However, if the letter becomes paler (i.e., the contrast is decreased), it is more difficult to read. One can measure the minimal contrast necessary for the recognition of a stimulus. This is contrast threshold, and its reciprocal is contrast sensitivity (CS). Lower thresholds mean higher sensitivities.
By measurements of CS, it is possible to set both spatial and temporal stimulus parameters to a wide range (Figure 1). This makes the method powerful in examining different functional units in the visual system.13–16 It must be noted, however, that achromatic stimuli with low contrast are especially suitable for the investigation of transient channels but allow only a limited possibility to draw conclusions regarding the functioning of sustained channels.1–4
To date, relatively few studies have been designed to specifically investigate transient and sustained channels in schizophrenia, and the results are inconsistent. Some findings suggest a transient channel dysfunction, and a number of studies also report impaired sustained channel functions.17–27 Several factors may contribute to the inhomogeneity of data, including methodological differences, patient selection, and medication effects.
It has been well established that dopamine modulates spatiotemporal CS functions.16 Early studies indicated that parkinsonian hypodopaminergic state in the visual system is accompanied by CS reductions at spatial frequencies up to 4.8 c/d, with a loss of physiological attenuation at low spatial frequencies.28 At the same time, some authors found a predominant deficit when low spatial-frequency stimuli were temporally modulated, leading to the hypothesis of transient channel dysfunction in Parkinson's disease.29–31 Several aspects of these findings were recapitulated in participants receiving dopamine antagonist drugs.32–34 The main conclusion from these studies is that the effects of dopamine antagonists may interact with sui generis visual processing abnormalities in schizophrenia patients. More specifically, in patients with predominantly negative symptoms and higher doses of antipsychotic medication, which are both associated with decreased dopaminergic transmission,35 one can expect a parkinsonian visual CS impairment. In this study, we used CS measurements in medicated patients with schizophrenia and normal control subjects. The relationship between CS anomalies and clinical parkinsonism was also evaluated.
METHODS
Participants
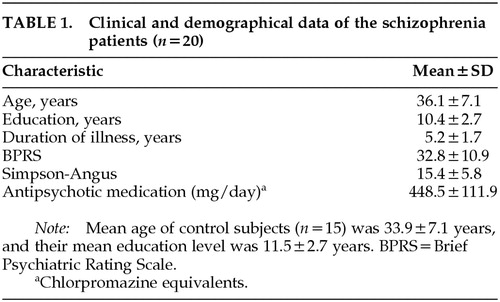
Participants were 20 patients with schizophrenia and 15 healthy control subjects. They all fulfilled the following criteria: clear ocular media; normal intraocular pressure; no history of diabetes, hypertension, substance abuse, or neurological disorders; and visual acuity better than 0.9 with or without correction. History of electroconvulsive therapy or Mini-Mental State Examination scores less than 25 were also among the exclusion criteria. All of the participants gave their informed consent. The patients with schizophrenia (11 males, 9 females) were diagnosed according to the DSM-IV criteria.36 All patients lived in the community at the time of testing and were recruited from the Schizophrenia Outpatient Care Unit at the Department of Psychiatry, University of Szeged, Hungary. Clinical symptoms were assessed with the Brief Psychiatric Rating Scale (BPRS).37 The severity of extrapyramidal symptoms was evaluated with the Simpson-Angus scale.38 All patients received antipsychotic medication for more than 6 months (12 patients zuclopenthixol, 8 patients haloperidol). Five patients received benzodiazepines (alprazolam and clonazepam), and 8 patients received anticholinergic medication (procyclidine). The control group comprised 15 healthy volunteers (9 males, 6 females) from the university staff (assistants and their relatives) without any history of neurological, ophthalmological, or mental disorders. The mean age and the mean duration of education did not differ between the control subjects and schizophrenic patients (t-test, P>0.2). Clinical and demographic data are shown in Table 1.
Stimuli and Apparatus
Visual patterns were generated by using a standard Venus system (Neuroscientific Corporation, USA). Stimuli were horizontal luminance-contrast gratings with a sinusoidal luminance profile. Two temporal frequencies (0 Hz in the static test; 8 Hz in the dynamic test) and 9 spatial frequencies (0.5, 1.2, 1.9, 2.9, 3.6, 4.8, 5.7, 7.2, and 14.4 c/d) were included. The stimulus display subtended 13°×13° from a viewing distance of 1 m. The luminance of the display (20 cd/m2) was held constant during the experiment. A small central dot on the monitor enhanced fixation. The stimuli and procedures are further described in the legend to Figure 1.
Procedure
The procedure included a two-alternative forced-choice method, also used by other investigators to measure CS in schizophrenia patients.22 A trial consisted of two consecutive observation periods, each initiated by a brief tone. The duration of an observation period was 1 second. The grating was presented randomly either in the first or the second observation period immediately after the initiating tone. The subject's task was to indicate whether the stimulus appeared after the first or second tone by pressing one of the two response buttons on a separate response pad. The exposure time of the gratings was 500 ms. Responses were accepted from the onset of a stimulus up to 10 s after the completion of the trial. The next trial was not initiated without a response (Figure 2).
At the beginning, the contrast was set at 10 dB above the normal values. The computer automatically decreased or increased the contrast by 3 dB when the subject gave, respectively, 2 right or 2 wrong consecutive responses at a given spatial frequency. If a pair of correct and incorrect responses was given, the computer repeated the measurement without the modification of the contrast level. In this way the minimal contrast (threshold) that was indispensable for the detection of a grating was determined. In other words, contrast threshold was the minimal contrast level at which subjects were able to give 2 consecutive correct responses. CS was defined as the reciprocal of the contrast threshold. The sequence of spatial frequency presentation was randomized. At each spatial frequency, 4 threshold measurements were performed, and the final value was the average of these values. Before the test, participants were given a practice run to ensure that they were able to perform the task.
Data Analysis
Raw CS data were log10 transformed and were entered into a 2 (group) by 9 (spatial frequency) analysis of variance (ANOVA). Separate ANOVAs were used for the data from static and dynamic tests. A three-way ANOVA, 2 (group) by 2 (temporal frequency) by 9 (spatial frequency), was also conducted to examine higher-order interactions. Tukey's honestly significant difference (HSD) tests were used for post hoc comparisons. To assess the effect of clinical status on CS functions, correlation coefficients were calculated between the CS values and the scores of clinical rating scales.
Motion gain was also determined. Motion gain is defined as the ratio of dynamic and static CS values at a given spatial frequency. We calculated this ratio at the three lowest spatial frequencies (0.5, 1.2, and 1.9 c/d) because these provide specific information about the integrity of transient channels.16 Motion gain values were treated with a 2 (group) by 3 (spatial frequency) ANOVA.
RESULTS
Visual Contrast Sensitivity
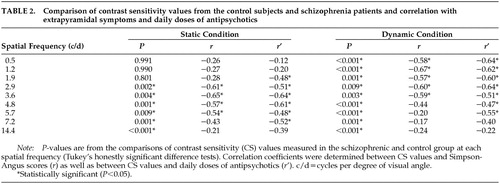
In the static condition, there were significant main effects of group (F=13.93, df=1,33, P<0.001) and spatial frequency (F=131.78, df=8,264, P<0.0001). The group by spatial frequency interaction was also significant (F=2.28, df=8,264, P<0.05). Post hoc comparisons revealed reduced CS values in the schizophrenia group at medium and high spatial frequencies (2.9–14.4 c/d; Figure 3 and Table 2).
In the dynamic condition, there were main effects of group (F=99.03, df=1,33, P<0.0001) and spatial frequency (F=288.86, df=8,264, P<0.0001). The two-way interaction did not reach the level of statistical significance (P>0.5). Tukey's HSD tests indicated CS losses in the patients with schizophrenia in the whole spatial frequency range tested (Figure 4 and Table 2).
The different pattern of CS deficit observed in the static and dynamic conditions was confirmed by a three-way ANOVA, which demonstrated a significant group by temporal frequency by spatial frequency interaction (F=2.19, df=8,264, P<0.05).
Analysis of Transient Channel Functions: Motion Gain
Motion gain was significantly affected by both the experimental group (F=16.34, df=1,33, P<0.001) and spatial frequency (F=37.02, df=2,66, P<0.001). The two-way interaction was not significant (P>0.2). Figure 5 shows that motion gain values exceeded 1, which demonstrates that temporal modulation enhanced CS at the three lowest spatial frequencies. However, in this respect there was a substantial difference between the two experimental groups. Tukey's HSD tests revealed that motion gain values were lower in the schizophrenia group at 0.5 and 1.2 c/d (P<0.02), but not at 1.9 c/d (P>0.5). This indicates that at the two lowest spatial frequencies, temporal modulation increased the CS less in the schizophrenia patients than in the control group.
Correlations With the Clinical and Demographical Parameters
The CS values did not correlate with the duration of illness or the mean BPRS score (P>0.2). In the static and dynamic conditions, a negative relationship was found between the daily dose of antipsychotic medication and the CS values (static: 1.9–7.2 c/d; dynamic: 0.5–5.7 c/d; Table 2). Similarly, there were significant negative correlations between the Simpson-Angus scores and CS values. In the static condition, this was restricted to medium and high spatial frequencies (2.9–5.7 c/d), whereas in the dynamic condition, correlations were observed at low and medium spatial frequencies (0.5–3.6 c/d; Table 2). Separate ANOVAs indicated no significant differences between the female and male patients (P>0.5). The results remained essentially the same when the patients receiving benzodiazepines and anticholinergic medications were excluded from the data analysis.
DISCUSSION
Similarity of Visual Deficit in Schizophrenia Patients to Parkinsonian CS Impairments
The contrast sensitivity (CS) impairments in patients with schizophrenia were highly similar to that found in Parkinson's disease. In the static condition, there was a marked medium and high spatial frequency CS loss, which is consistent with original observations from Parkinson's disease and parkinsonism induced by antipsychotic medication.28,32 In the dynamic condition, the CS loss also affected temporally modulated low spatial frequencies, which was not observed in the static condition. The specificity of this dysfunction is reflected by the significant group by temporal frequency by spatial frequency interaction. The finding that patients with schizophrenia showed reduced CS for temporally modulated low spatial frequency gratings may be related to transient channel dysfunctions, which has been also expressed in the form of reduced motion gain.16 Strikingly, at certain spatial frequencies lower CS was associated with higher doses of antipsychotic medication and higher Simpson-Angus scores, indicating a relationship between visual and motor symptoms. However, this finding must be regarded with caution because it is based on pure correlation data. Further studies, using a longitudinal design, are necessary to confirm these findings.
Visual Channel Dysfunction in Schizophrenia
Pioneering studies have suggested that visual information processing deficits are restricted to the transient channels, on the basis that patients with schizophrenia showed CS abnormalities only for temporally modulated gratings.17–19 The hypothesis of transient channel dysfunction was confirmed by other investigators using different methods.20,21,23,26 Other groups have emphasized the distinction between the functioning of subcortical transient channels and higher-level cortical processing mechanisms.25,27 A recent study found CS impairments only at higher spatial frequencies in positive symptom patients, whereas participants with severe negative symptoms showed reduced CS values at both low and high spatial frequencies.22 The conclusion was that in negative-symptom schizophrenia both transient and sustained channels are impaired, while in positive-symptom schizophrenia the impairment is limited only to the sustained channels. At the same time, Chen et al.25 demonstrated only a slight tendency for CS loss, using static low spatial frequency gratings (P=0.14). It is noteworthy that when the same stimuli were temporally modulated, the difference between the schizophrenic and control subjects diminished (P=0.85). This suggests a greater motion gain in the schizophrenia group, consistent with the hypothesis of overreactive transient channels.20,39,40 However, these studies included medicated patients, which makes the interpretation difficult.
In a pilot study including 10 nonmedicated schizophrenia subjects, we found similar effects to those described by Chen et al.;25 that is, an increased motion gain at low spatial frequencies and no differences at higher spatial frequencies.24 This finding raises the possibility that transient channels can indeed be overactive in some patients, but this is highly likely to depend on the current symptoms and medication status. In another sample of chronic medicated patients, we observed a definite CS loss similar to that found in the present study,34 while patients receiving the atypical antipsychotic olanzapine, which has a more advantageous extrapyramidal side effect profile, displayed intact CS values over the whole spatial frequency range tested (0.5–14.4 c/d).41
On the basis of these data, we hypothesize that in schizophrenia patients with predominantly negative symptoms and higher doses of antipsychotic medication, which are both associated with decreased dopaminergic transmission,35 a marked hypofunction of transient channels is observable. In contrast, in patients with positive symptoms, which are believed to be associated with increased dopaminergic transmission, transient channels can be overactive: temporal modulation of low spatial frequencies may lead to an abnormally reduced contrast threshold. In this respect it is worthwhile to note that higher doses of dopamine agonists increase CS16 and that levodopa treatment can induce supranormal CS, mostly evident at 2 c/d in parkinsonian patients.42 Further controlled studies are necessary to explore this hypothesis, taking into consideration that more severely ill patients are likely to receive higher doses of medications and have more severe extrapyramidal side effects. It is important to emphasize, however, that parkinsonian symptoms are present in a proportion of neuroleptic-free schizophrenia patients and may show a significant correlation with negative symptoms,43 suggesting that these phenomena may be linked to similar neurochemical or structural abnormalities.
Limitations
This study has several limitations. First, control subjects with other psychiatric disorders were not included, and their inclusion might have helped control for nonspecific deficits associated with schizophrenia. It is likely that multiple factors may contribute to CS anomalies, including disorders in attention, short-term memory, and stimulus-response coupling. In laboratory tests, schizophrenia patients regularly show greater variability, greater response inconsistency, and more frequent false alarms, often guided by inappropriately strong confidence that a sensory event has really occurred.44 All of these factors may contribute to the CS abnormalities, and the whole pattern of results may suggest a generalized deficit. It must be noted, however, that in the static condition there was a spatial frequency–specific CS loss in the schizophrenia group instead of a generalized decline. Second, in the dynamic condition the control subjects improved their performance for low spatial frequency stimuli, whereas the patients with schizophrenia exhibited a disorder for such stimuli. This effect was not present in the static condition. Third, ranges, variances, and standard deviations were comparable in the case of control subjects and schizophrenia patients, suggesting that the patients showed no extreme fluctuations in the CS task (Figure 3, Figure 4). Fourth, a subpopulation of schizophrenia patients (n=12) demonstrated a relatively modest rate of false alarms in the Continuous Performance Test assessing sustained attention.44 Nevertheless, further studies are warranted to assess the specificity of CS abnormalities in schizophrenia.
An important methodological issue is that the CS sensitivity task may be performed simply by attending to only one observation period and detecting whether the grating was present or not in the attended period. The processing of temporal sequence in the present study may have been redundant. Further studies should use a less attention-demanding paradigm in which the task is simply to press one button if a grating has appeared or another button if it has not.
ACKNOWLEDGMENTS
This work was supported by the Hungarian Research Fund (OTKA 025160).

FIGURE 1. Spatiotemporal characteristics of the visual stimuliVisual patterns are generated on a standard Venus system. Luminance changes periodically to form a horizontal grating comprising phases with minimal luminance (dark bars, Lmin) and maximal luminance (white bars, Lmax). In the static conditions, steady patterns are used. In the dynamic conditions, Lmin and Lmax bars change places several times during a second (phase reversal). In contrast sensitivity measurement, the contrast is gradually decreased to define the minimal contrast that is indispensable for the detection of a grating.
Contrast (C) is defined by using the Michelson formula [C=(Lmax−Lmin)/(Lmin+Lmax)]. Spatial frequency is the number of cycles per 1° of visual angle (c/d). Temporal frequency refers to the number of phase reversals during a second (Hz). See also under Methods in the text.

FIGURE 2. Structure of the experimental procedureOne trial consisted of two consecutive observation periods. Subjects were asked to press different keys to indicate if the grating was paired with the first or the second tone.

FIGURE 3. Mean static contrast sensitivity (sCS) in the schizophrenia and control groupsValues are shown at nine spatial frequencies. Error bars indicate standard deviations. The min-max sCS values were 1.1–3.4 (maximal variance 0.11) in the control group and 0.8–2.7 (maximal variance 0.12) in the schizophrenia group.

FIGURE 4. Mean dynamic contrast sensitivity (dCS) in the schizophrenia and control groupValues are shown at nine spatial frequencies. Error bars indicate standard deviations. The min-max dCS values were 1.1–3.5 (maximal variance: 0.07) in the control group and 0.6–3.4 (maximal variance: 0.08) in the schizophrenia group.

FIGURE 5. Motion gain at the three lowest spatial frequenciesMotion gain is the ratio of dynamic and static contrast sensitivity values at a given spatial frequency. Error bars indicate standard deviations.
 |
 |
1 Lennie P: Parallel visual pathways: a review. Vision Res 1980; 20:561-594Crossref, Medline, Google Scholar
2 Bassi C, Lehmkuhle S: Clinical implications of parallel visual pathways. J Am Optom Assoc 1990; 61:98-109Medline, Google Scholar
3 Breitmeyer BG: Parallel processing in human vision: history, review, and critique, in Application of Parallel Processing in Vision, edited by Brannan JR. Amsterdam, North-Holland, 1992, pp 37-78Google Scholar
4 Shapley R: Parallel cortical channels, in Application of Parallel Processing in Vision, edited by Brannan JR. Amsterdam, North-Holland, 1992, pp 3-36Google Scholar
5 Sawatari A, Callaway EM: Convergence of magno- and parvocellular pathways in layer 4B of macaque primary visual cortex. Nature 1996; 380:442-446Crossref, Medline, Google Scholar
6 Allison JD, Melzer P, Ding Y, et al: Differential contributions of magnocellular and parvocellular pathways to the contrast response of neurons in bush baby primary visual cortex (V1). Vis Neurosci 2000; 17:71-76Crossref, Medline, Google Scholar
7 Kessels RP, Postma A, Haan EH: P and M channel-specific interference in the what and where pathway. Neuroreport 1999; 16:3765-3767Crossref, Google Scholar
8 Hadjikhani N, Tootell RB: Projection of rods and cones within human visual cortex. Hum Brain Mapp 2000; 9:55-63Crossref, Medline, Google Scholar
9 Legge G: Sustained and transient mechanism in human vision: temporal and spatial properties. Vision Res 1978; 18:69-81Crossref, Medline, Google Scholar
10 Wilson HR: Spatiotemporal characterization of transient mechanisms in the human visual system. Vision Res 1980; 20:443-452Crossref, Medline, Google Scholar
11 Green M: Psychophysical relationship among mechanisms sensitive to pattern, motion and flicker. Vision Res 1981; 21:971-982Crossref, Medline, Google Scholar
12 Derrington AM, Henning GB: Pattern discrimination with flickering stimuli. Vision Res 1981; 21:597-602Crossref, Medline, Google Scholar
13 Robson JG: Spatial and temporal contrast sensitivity function of the visual system. J Opt Soc Am 1966; 56:1141-1142Crossref, Google Scholar
14 Kelly DH: Visual contrast sensitivity. Optica Acta 1977; 24:107-129Crossref, Google Scholar
15 Campbell F: Why do we measure contrast sensitivity? Behav Brain Res 1983; 10:87-97Crossref, Medline, Google Scholar
16 Masson G, Mestre D, Blin O: Dopaminergic modulation of visual sensitivity in man. Fundam Clin Pharmacol 1993; 7:449-463Crossref, Medline, Google Scholar
17 Schwartz BD, Winstead DK: Icon formation in chronic schizophrenia. Biol Psychiatry 1985; 20:1015-1018Crossref, Medline, Google Scholar
18 Schwartz BD, Winstead DK: Visual processing deficits in acute and chronic schizophrenics. Biol Psychiatry 1985; 17:1377-1387Google Scholar
19 Schwartz BD, McGuinn T, Winstead DK: Disordered spatiotemporal processing in schizophrenics. Biol Psychiatry 1987; 22:688-698Crossref, Medline, Google Scholar
20 Green MF, Nuechterlein KH, Mintz J: Backward masking in schizophrenia and mania, II: specifying the visual channel. Arch Gen Psychiatry 1994; 51:945-951Crossref, Medline, Google Scholar
21 O'Donnel BF, Swearer JM, Smith LT, et al: Selective deficits in visual perception and recognition in schizophrenia. Am J Psychiatry 1996; 153:687-692Crossref, Medline, Google Scholar
22 Slaghuis WL: Contrast sensitivity for stationary and drifting spatial frequency gratings in positive- and negative-symptom schizophrenia. J Abnorm Psychol 1998; 107:49-62Crossref, Medline, Google Scholar
23 Cadenhead KS, Serper Y, Braff DL: Transient versus sustained visual channels in the visual backward masking deficits of schizophrenia patients. Biol Psychiatry 1998; 43:132-138Crossref, Medline, Google Scholar
24 Kéri S, Antal A, Szekeres G, et al: Transient visual channel functions in schizophrenia (abstract). Int J Psychophysiol 1998; 30:170Crossref, Google Scholar
25 Chen Y, Palafox GP, Nakayama K, et al: Motion perception in schizophrenia. Arch Gen Psychiatry 1999; 56:149-154Crossref, Medline, Google Scholar
26 Schwartz BD, Maron BA, Evans WJ, et al: High velocity visual processing deficits diminish ability of patients with schizophrenia to recognize objects. Neuropsychiatry Neuropsychol Behav Neurol 1999; 12:170-177Medline, Google Scholar
27 Kéri S, Antal A, Szekeres G, et al: Visual information processing in schizophrenia: evidence for the impairment of central mechanisms. Neurosci Lett 2000; 293:69-71Crossref, Medline, Google Scholar
28 Bodis-Wollner I, Marx MS, Mitra S, et al: Visual dysfunction in Parkinson's disease. Brain 1987; 110:1675-1698Crossref, Medline, Google Scholar
29 Regan D, Maxner C: Orientation-selective visual loss in patients with Parkinson's disease. Brain 1987; 110:414-432Crossref, Google Scholar
30 Mestre D, Blin O, Serratrice G, et al: Spatio-temporal contrast sensitivity differs in normal aging and Parkinson's disease. Neurology 1990; 40:1710-1718Crossref, Medline, Google Scholar
31 Giaschi D, Lang A, Regan D: Reversible dissociation of sensitivity to dynamic stimuli in Parkinson's disease: is magnocellular function essential to reading motion-defined letters? Vision Res 1997; 37:2531-2534Crossref, Google Scholar
32 Bulens C, Meerwaldt JD, van der Wildt GJ, et al: Visual contrast sensitivity in drug-induced parkinsonism. J Neurol Neurosurg Psychiatry 1989; 52:341-345Crossref, Medline, Google Scholar
33 Harris JP, Calvert JE, Leendertz JA, et al: The influence of dopamine on spatial vision. Eye 1990; 4:806-812Crossref, Medline, Google Scholar
34 Kéri S, Antal A, Szekeres G, et al: Tests on basic visual functions in the evaluation of extrapyramidal side effects of antipsychotic medication. Orv Hetil 1998; 139:235-238Medline, Google Scholar
35 Grace AA: Cortical regulation of subcortical dopamine systems and its possible relevance to schizophrenia. J Neural Transm 1993; 91:11-134Crossref, Google Scholar
36 American Psychiatric Association: Diagnostic and Statistical Manual of Mental Disorders, 4th edition. Washington, DC, American Psychiatric Association, 1994Google Scholar
37 Overall JE, Gorham DR: Brief Psychiatric Rating Scale. Psychol Rep 1962; 10:799-812Crossref, Google Scholar
38 Simpson GM, Angus JWS: A rating scale for extrapyramidal side effects. Acta Psychiatr Scand 1970; 212:11-19Crossref, Google Scholar
39 Shuck JR, Lee RG: Backward masking, information processing, and schizophrenia. Schizophr Bull 1989; 15:491-500Crossref, Medline, Google Scholar
40 Merritt RD, Balogh DW: Backward masking spatial frequency effects among hypothetically schizotypal individuals. Schizophr Bull 1989; 15:573-583Crossref, Medline, Google Scholar
41 Antal A, Kéri S, Szekeres G, et al: The atypical antipsychotic olanzapine does not induce parkinsonian visuo-perceptual deficits (abstract). Eur Neuropsychopharmacol 1999; 9(suppl 5):S259Google Scholar
42 Tagliati M, Brannan JR, Bodis-Wollner I: Contrast sensitivity in Parkinson's disease (letter). Neurology 1992; 42:1126-1127Crossref, Medline, Google Scholar
43 Chatterjee A, Chakos M, Koreen A, et al: Prevalence and clinical correlates of extrapyramidal signs and spontaneous dyskinesia in never-medicated schizophrenic patients. Am J Psychiatry 1995; 152:1724-1729Crossref, Medline, Google Scholar
44 Nuechterlein KH, Buchsbaum MS, Dawson ME: Neuropsychological vulnerability to schizophrenia, in The Neuropsychology of Schizophrenia, edited by David AS, Cutting JC. Hove, Psychology Press, 1994, pp 53-78Google Scholar