Changes in Regional Cerebral Blood Flow After Repetitive Transcranial Magnetic Stimulation of the Left Dorsolateral Prefrontal Cortex in Treatment-Resistant Depression
Imaging studies in patients with depression have shown both an abnormal functioning of the frontal lobe, especially the dorsolateral prefrontal cortex and the anterior cingulate, 17 – 19 and changes in regional cerebral blood flow (rCBF) and metabolism that accompany improvement in symptoms of depression. 20 – 22 However, there are only a few studies on the effect of high-frequency rTMS on rCBF and metabolism in patients with treatment-resistant depression, and the results are not consistent. 23 , 24
The aim of the present study was to evaluate the changes in rCBF by using 99m Tc-ECD single photon emission computed tomography (SPECT) to reveal any alteration of neuroanatomical function that was associated with the manifestation of an antidepressant effect of rTMS over the left dorsolateral prefrontal cortex in male patients with treatment-resistant unipolar depression.
METHOD
Subjects
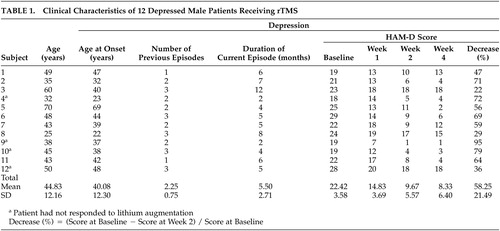
Twelve right-handed male inpatients who met DSM-IV criteria for major depressive disorder (unipolar depression) participated in the study ( Table 1 ). Inclusion criteria were a 17-item Hamilton Depression Rating Scale (HAM-D) 25 score of greater than 18. Exclusion criteria included significant medical illnesses or neurological disorders, a history of substance abuse or dependence, convulsive disorders, active suicidal ideation, and previous rTMS or ECT treatments. All patients had failed to respond to a minimum of two distinctly different classes of antidepressant medications (stage II or III, definition of Thase and Rush 26 ), and 4 of 12 patients also had not responded to lithium augmentation. Patients were not deliberately withdrawn from medication before the trial, but their medical treatments were not allowed to have changed in the 6 weeks before the commencement of the study or during the trial. All patients were taking medication during the trial: 7 patients were taking a tricyclic antidepressant (3 were receiving amoxapine; 2, clomipramine; and 2, amitriptyline); 1, a selective serotonin reuptake inhibitor (paroxetine); 1, a serotonin-noradrenaline reuptake inhibitor (milnacipran); 1, another class of medication (sulpiride); and 2 patients were taking a combination of antidepressants (mianserin and clomipramine or paroxetine). Three patients were taking lithium carbonate, 2 were taking clonazepam, and 4 patients were taking antipsychotic medications (2, levomepromazine; 1, risperidone; and 1, olanzapine). Ten patients were receiving benzodiazepines such as hypnotic or anxiolytic agents.
 |
After a complete description of the study had been given to the patients and their families, written informed consent was obtained from all patients on a form approved by the Ethics Committee of the Kyorin University School of Medicine.
rTMS Treatment
rTMS was administered by using a Magstim Super Rapid magnetic stimulator (Magstim Company, Whitland, UK) with hand-held 70-mm figure-of-8 coils that were interchanged to allow cooling at times during the treatment sessions. At the first rTMS treatment session, single-pulse TMS was used to determine the resting motor threshold in the right hand by using a visualization of movement method. 27 The stimulation site during the rTMS treatment sessions was defined as a 0.5 cm anterior in a parasagittal line to the motor cortex. Twenty-five-second trains were applied at 10 Hz (total of 1000 stimuli per session) and at 100% of the resting motor threshold over the left dorsolateral prefrontal cortex. Ten treatment sessions were administered within a 2-week period.
Clinical Assessment and Data Analysis
All patients were assessed with the 17-item HAM-D at 4 time points: before rTMS (baseline), at week 1, at week 2, and at week 4 (2 weeks after the rTMS treatment). These measures were rated at same time in each patient by an expert investigator. Response criteria were defined as a >25% decrease in the score of the HAM-D from baseline to week 2. One-way repeated-measures analysis of variance (ANOVA) was used to compare the scores of the HAM-D and to estimate the main effect of time (baseline, week 1, week 2, and week 4). Statistical analysis was conducted using SPSS for Windows 14.0 (SPSS Inc., Chicago) and the level of statistical significance was set at p<0.05.
SPECT Procedure and Analysis
SPECT images were acquired within 48 hours before the first rTMS treatment and within 48 hours after the last rTMS treatment after injection of 600 MBq 99m Tc-ECD in the resting state via a venous cannula previously inserted in the right arm. Patients rested supine in a quiet room before the injection was administered with their eyes closed and their ears unplugged. Image acquisition started 10 minutes after the injection was given, by using a triple-detector gamma camera GCA-9300A/HG (Toshiba Corporation, Tokyo) with low energy super high resolution fan beam collimators. The matrix size was 128×128, and data were collected in 30 frames at 4° steps over 120° with a pixel width of 1.72 mm and a slice thickness of 3.45 mm. Scanned data were prefiltered by using a Butterworth filter (order 8 and a cutoff at 0.08–9 cycle/pixel) and reconstructed with a Ramp filter. Scatter and attenuation corrections were performed, respectively, by the triple-energy window correction and Sorenson method.
Statistical analysis was conducted on a voxel-by-voxel basis by using statistical parametric mapping (SPM2, http://www.fil.ion.ucl.ac.uk/spm). SPECT images were realigned and spatially normalized to the standard stereotactic space, which was based on the Montreal Neurological Institute template, and smoothed with an isotropic 12-mm full-width half-maximum Gaussian filter to improve the signal-to-noise ratio. rCBF comparisons between patients before and after rTMS treatment were performed by using the paired t test. The height threshold was set a priori to p<0.01, and the extent threshold was set to p<0.05 after correction for multiple comparisons by SPM2. To evaluate changes in rCBF that correlated with the improvement of depressive symptoms, we analyzed the scans within responders using the scores of the HAM-D at baseline and week 2 as covariates of interest. Brain regions were identified as a cluster level of p<0.05 and significant at a threshold of p<0.01 (corresponding to Z score equal to or greater than 2.33). Stereotactic coordinates were based on Talairach and Tournoux atlas coordinates, 28 converted from Montreal Neurological Institute coordinates. 29
RESULTS
ANOVA for the score of the HAM-D showed a significant main effect of time [F (3, 33)=54.2, p<0.001]. Multiple comparisons using Bonferroni’s correction showed that the mean of the scores of the HAM-D significantly decreased to 14.83 (SD=3.69) after 1 week (p<0.001), to 9.67 (SD=5.57) after 2 weeks (p<0.001), and to 8.33 (SD=6.40) after 4 weeks (p<0.001) from the baseline of 22.42 (SD=3.58). However, there was no significant difference between the scores at week 2 and week 4 ( Table 1 ).
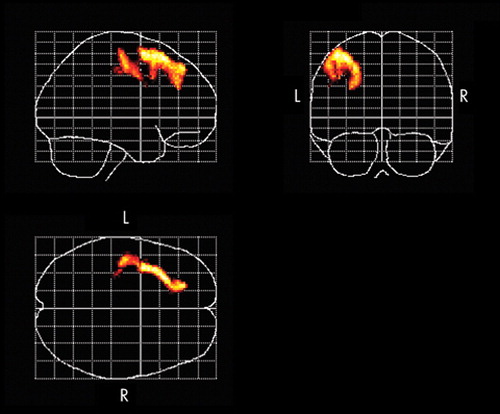
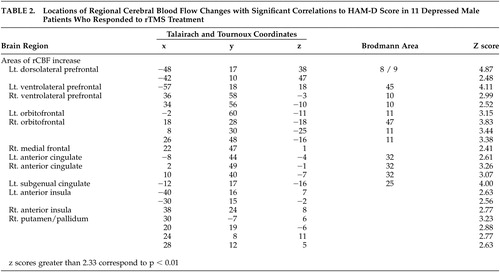
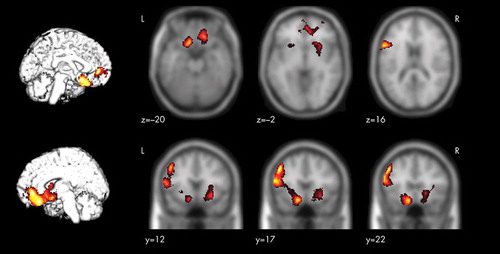
A significantly increased rCBF occurred in left dorsolateral prefrontal cortex, the region stimulated by the rTMS treatment and premotor area ( Figure 1 ), whereas no significant relative decrease of the rCBF was found. As shown in Table 2 and Figure 2 , among 11 responders (91.7%), areas of significant negative correlations between rCBF and the change of the scores of the HAM-D were observed in the left dorsolateral prefrontal cortex, the ventrolateral prefrontal cortex, the right-dominant orbitofrontal cortex, the anterior cingulate, the left subgenual cingulate, the anterior insula, and the right putamen/pallidum. No region showed a significant positive correlation between rCBF and the change of the scores of the HAM-D.
 |
Two subjects out of 12 complained of discomfort in the stimulated region during the rTMS treatments; however, after the completion of the stimulation the discomfort disappeared. No serious adverse events that could discontinue the treatment occurred in this trial.
DISCUSSION
The present study of high-frequency rTMS of the left dorsolateral prefrontal cortex in 12 patients with treatment-resistant depression measured changes in rCBF by SPECT before and after the treatment. After the rTMS treatment, the HAM-D score decreased significantly (mean of −58.25%) and an improvement in the symptoms of depression was observed.
Changes in rCBF
Successful rTMS treatment was associated with a significant increase in rCBF in the left dorsolateral prefrontal cortex in the stimulated region. Furthermore, the present study revealed that there was a relationship between the improvement in symptoms of depression and the increase in rCBF in the left dorsolateral prefrontal cortex, the ventrolateral prefrontal cortex, the orbitofrontal cortex, the anterior cingulate, the left subgenual cingulate, the anterior insula, and the right putamen/pallidum.
It has been suggested that TMS has different effects on neuroanatomical function depending on its frequency, that is, the excitement of the cerebral cortex is enhanced by stimulation from high-frequency TMS and suppressed by stimulation from low-frequency TMS. 10 , 30 The activation of the cortex is not limited to the stimulated region but can be transferred to remote regions via the intracerebral networks. 30 , 31 According to a study on healthy male subjects after stimulation of the left dorsolateral prefrontal cortex with fast and slow rTMS, increases in CBF in the stimulated regions were observed in both cases. Slow rTMS induced an increase in CBF in the contralateral right caudate body and the anterior cingulate and a decrease in CBF in the ipsilateral orbitofrontal cortex. Fast rTMS applied over the right dorsolateral prefrontal cortex was associated with an increase in the CBF in the stimulated region, the bilateral orbitofrontal cortex, and the left medial thalamus. 32 Speer et al. 30 reported increases in the rCBF in the left-dominant bilateral prefrontal and the limbic and paralimbic regions after a high-frequency rTMS of the left dorsolateral prefrontal cortex in patients with depression. Some studies of high-frequency rTMS for treatment-resistant depression have shown inconsistent results, 23 , 24 partly because these studies used different designs in patient selection and treatment methods.
Functional imaging studies show decreases in rCBF and metabolism in the dorsolateral prefrontal cortex 17 , 19 and in the left-dominant hypofrontality 18 in patients with depression, and also show changes in rCBF and metabolism according to improvement in symptoms of depression. 20 , 22 The results obtained in the present study support those of previous reports, and it is assumed that the direct activation of the cerebral cortex through high-frequency rTMS and the resultant changes in neuroanatomical function associated with the improvement in depressive symptoms are responsible for increasing the rCBF of the left dorsolateral prefrontal cortex after rTMS treatment. Previous studies have demonstrated that the limbic-paralimbic regions are reciprocally connected with the prefrontal and the subcortical regions and are involved in the regulation of mood and affect. 21 , 33 , 34 In the present study, among patients who responded to rTMS treatment, significant relative increases of rCBF occurred in the ipsilateral dorsolateral prefrontal cortex toward the stimulated region, the limbic-paralimbic regions including the left subgenual cingulate (Brodmann area 25), and the right basal ganglia, whereas no region showed significant relative decrease of rCBF that was correlated with the change of the scores of the HAM-D. Drevets et al. 35 reported a decrease in rCBF and glucose metabolism in the subgenual prefrontal cortex (Brodmann area 25) and a decrease in the volume of the left subgenual prefrontal cortex in patients with familial bipolar and unipolar depression. In addition, there is a report in which marked decreases in the blood flow in the paralimbic regions, especially in the inferior frontal and cingulate cortex, were noted in patients with severe treatment-resistant depression, but there was no decrease in CBF in the parietal or occipital lobe. 36 The anterior cingulate (Brodmann areas 24 and 32) is reciprocally connected with the prefrontal and the limbic-paralimbic regions, and previous reports show that rCBF and metabolism in the anterior cingulate decrease in patients with depression and increase with an improvement in symptoms of depression. 20 , 22 In addition, the activation of the rostral anterior cingulate may predict treatment response in depression. 37 , 38 The present study showed an increase in rCBF in the anterior cingulate and an improvement in symptoms of depression after successful rTMS treatment of the left dorsolateral prefrontal cortex. Several studies 22 , 34 , 39 have reported that decreases in rCBF and metabolism in the subgenual cingulate (Brodmann area 25) and the limbic-paralimbic regions such as the anterior insula and the putamen/pallidum are associated with improvement of depression. Acting on the postulation that the subgenual cingulate region is metabolically overactive in treatment-resistant depression, Mayberg et al. 40 reported that deep brain stimulation resulted in a decrease in metabolic activities in this region and in the limbic-paralimbic regions and improved symptoms in these patients. Our findings of increased rCBF in the subgenual cingulate and the limbic-paralimbic regions after successful rTMS treatment are different and have not been previously reported. In most previous studies, rCBF and metabolism were evaluated 6 weeks after the commencement of the trials, whereas in the present study, the rCBF was measured with the SPECT within 48 hours after the completion of the rTMS treatment. Hence, the difference in the timing of the evaluation of the neuroanatomical function during the convalescence from the depression and the manner of the antidepressant treatment may have influenced the findings obtained in the present study.
There are several limitations in the present study. First, a placebo effect due to rTMS treatment cannot be excluded because of the nonblinded design. Second, because pharmacologic treatment was continued during rTMS, the effects of these medications on depression and rCBF should be considered. We believe further studies are necessary to clarify whether the results of the present study are specific findings of the treatment of depression with high-frequency rTMS over the left dorsolateral prefrontal cortex or are due to changes in neuroanatomical function during the time course of convalescence from depression.
In conclusion, we conducted high-frequency rTMS over the left dorsolateral prefrontal cortex in patients with treatment-resistant depression and found changes in rCBF associated with a reduction in symptoms of depression. The results of this study suggest that the manifestation of an antidepressant effect of high-frequency rTMS of the left dorsolateral prefrontal cortex in patients with treatment-resistant depression is related to changes in the neuroanatomical function of the left dorsolateral prefrontal cortex as well as of the ipsilateral subgenual cingulate (Brodmann area 25), the ventrolateral prefrontal cortex, the orbitofrontal cortex, the anterior cingulate, the anterior insula, and the right putamen/pallidum.
1 . Belmaker RH, Fleischmann A: Transcranial magnetic stimulation: a potential new frontier in psychiatry. Biol Psychiatry 1995; 38:419–421Google Scholar
2 . George MS, Lisanby SH, Sackeim HA: Transcranial magnetic stimulation: applications in neuropsychiatry. Arch Gen Psychiatry 1999; 56:300–311Google Scholar
3 . Chouinard PA, Van Der Werf YD, Leonnard G, et al: Modulating neural networks with transcranial magnetic stimulation applied over the dorsal premotor and primary motor cortices. J Neurophysiol 2003; 90:1071–1083Google Scholar
4 . Barker AT, Jalinous R, Freeston IL: Non-invasive magnetic stimulation of human motor cortex. Lancet 1985; 1:1106–1107Google Scholar
5 . Höflich G, Kasper S, Hufnagel A, et al: Application of transcranial magnetic stimulation in treatment of drug-resistant major depression: a report of two cases. Hum Psychopharmacol 1993; 8:361–365Google Scholar
6 . Pascual-Leone A, Rubio B, Pallardo F, et al: Rapid-rate transcranial magnetic stimulation of left dorsolateral prefrontal cortex in drug-resistant depression. Lancet 1996; 348:233–237Google Scholar
7 . George MS, Wassermann EM, Kimbrell TA, et al: Mood improvement following daily left prefrontal repetitive transcranial magnetic stimulation in patients with depression: a placebo-controlled crossover trial. Am J Psychiatry 1997; 154:1752–1756Google Scholar
8 . George MS, Nahas Z, Molloy M, et al: A controlled trial of daily left prefrontal cortex TMS for treating depression. Biol Psychiatry 2000; 48:962–970Google Scholar
9 . Klein E, Kreinin I, Chistyakov A, et al: Therapeutic efficacy of right prefrontal slow repetitive transcranial magnetic stimulation in major depression: a double-blind controlled study. Arch Gen Psychiatry 1999; 56:315–320Google Scholar
10 . Fitzgerald PB, Brown TL, Marston NA, et al: Transcranial magnetic stimulation in the treatment of depression: a double-blind, placebo-controlled trial. Arch Gen Psychiatry 2003; 60:1002–1008Google Scholar
11 . Grunhaus L, Schreiber S, Dolberg OT, et al: A randomized controlled comparison of electroconvulsive therapy and repetitive transcranial magnetic stimulation in severe and resistant nonpsychotic major depression. Biol Psychiatry 2003; 53:324–331Google Scholar
12 . Avery DH, Holtzheimer PE III, Fawaz W, et al: A controlled study of repetitive transcranial magnetic stimulation in medication-resistant major depression. Biol Psychiatry 2006; 59:187–194Google Scholar
13 . Gershon AA, Dannon PN, Grunhaus L: Transcranial magnetic stimulation in the treatment of depression. Am J Psychiatry 2003; 160:835–845Google Scholar
14 . Keck ME, Welt T, Muller MB, et al: Repetitive transcranial magnetic stimulation increases the release of dopamine in the mesolimbic and mesostriatal system. Neuropharmacology 2002; 43:101–109Google Scholar
15 . Pridmore S: Rapid transcranial magnetic stimulation and normalization of the dexamethasone suppression test. Psychiatry Clin Neurosci 1999; 53:33–37Google Scholar
16 . Szuba MP, O’Reardon JP, Rai AS, et al: Acute mood and thyroid stimulating hormone effects of transcranial magnetic stimulation in major depression. Biol Psychiatry 2001; 50:22–27Google Scholar
17 . Baxter LR Jr, Schwartz JM, Phelps ME, et al: Reduction of prefrontal cortex glucose metabolism common to three types of depression. Arch Gen Psychiatry 1989; 46:243–250Google Scholar
18 . Bench CJ, Friston KJ, Brown RG, et al: Regional cerebral blood flow in depression measured by positron emission tomography: the relationship with clinical dimensions. Psychol Med 1993; 23:579–590Google Scholar
19 . Biver F, Goldman S, Delvenne V, et al: Frontal and parietal metabolic disturbances in unipolar depression. Biol Psychiatry 1994; 36:381–388Google Scholar
20 . Bench CJ, Frackowiak RS, Dolan RJ: Changes in regional cerebral blood flow on recovery from depression. Psychol Med 1995; 25:247–261Google Scholar
21 . Mayberg HS, Liotti M, Brannan SK, et al: Reciprocal limbic-cortical function and negative mood: converging PET findings in depression and normal sadness. Am J Psychiatry 1999; 156:675–682Google Scholar
22 . Kennedy SH, Evans KR, Kruger S, et al: Changes in regional brain glucose metabolism measured with positron emission tomography after paroxetine treatment of major depression. Am J Psychiatry 2001; 158:899–905Google Scholar
23 . Catafau AM, Perez V, Gironell A, et al: SPECT mapping of cerebral activity changes induced by repetitive transcranial magnetic stimulation in depressed patients: a pilot study. Psychiatry Res 2001; 106:151–160Google Scholar
24 . Nadeau SE, McCoy KJ, Crucian GP, et al: Cerebral blood flow changes in depressed patients after treatment with repetitive transcranial magnetic stimulation: evidence of individual variability. Neuropsychiatry Neuropsychol Behav Neurol 2002; 15:159–175Google Scholar
25 . Hamilton M: A rating scale for depression. J Neurol Neurosurg Psychiatry 1960; 23:56–62Google Scholar
26 . Thase ME, Rush AJ: When at first you don’t succeed: sequential strategies for antidepressant nonresponders. J Clin Psychiatry 1997; 58(suppl 13):23–29Google Scholar
27 . Pridmore S, Fernandes Filho JA, Nahas Z, et al: Motor threshold in transcranial magnetic stimulation: a comparison of a neurophysiological method and a visualization of movement method. J ECT 1998; 14:25–27Google Scholar
28 . Talairach J, Tournoux P: Co-Planar Stereotaxic Atlas of the Human Brain: Three-Dimensional Proportional System. New York, Thieme Medical, 1988Google Scholar
29 . Brett M, Johnsrude IS, Owen AM: The problem of functional localization in the human brain. Nat Rev Neurosci 2002; 3:243–249Google Scholar
30 . Speer AM, Kimbrell TA, Wassermann EM, et al: Opposite effects of high and low frequency rTMS on regional brain activity in depressed patients. Biol Psychiatry 2000; 48:1133–1141Google Scholar
31 . Loo CK, Sachdev PS, Haindl W, et al: High (15 Hz) and low (1 Hz) frequency transcranial magnetic stimulation have different acute effects on regional cerebral blood flow in depressed patients. Psychol Med 2003; 33:997–1006Google Scholar
32 . Knoch D, Treyer V, Regard M, et al: Lateralized and frequency-dependent effects of prefrontal rTMS on regional cerebral blood flow. Neuroimage 2006; 31:641–648Google Scholar
33 . Soares JC, Mann JJ: The functional neuroanatomy of mood disorder. J Psychiatr Res 1997; 31:393–432Google Scholar
34 . Goldapple K, Segal Z, Garson C, et al: Modulation of cortical-limbic pathways in major depression: treatment-specific effects of cognitive behavior therapy. Arch Gen Psychiatry 2004; 61:34–41Google Scholar
35 . Drevets WC, Price JL, Simpson JR Jr, et al: Subgenual prefrontal cortex abnormalities in mood disorders. Nature 1997; 386:824–827Google Scholar
36 . Mayberg HS, Lewis PJ, Regenold W, et al: Paralimbic hypoperfusion in unipolar depression. J Nucl Med 1994; 35:929–934Google Scholar
37 . Mayberg HS, Brannan SK, Mahurin RK, et al: Cingulate function in depression: a potential predictor of treatment response. Neuroreport 1997; 8:1057–1061Google Scholar
38 . Pizzagalli D, Pascual-Marqui RD, Nitschke JB, et al: Anterior cingulate activity as a predictor of degree of treatment response in major depression: evidence from brain electrical tomography analysis. Am J Psychiatry 2001; 158:405–415Google Scholar
39 . Mayberg HS, Brannan SK, Tekell JL, et al: Regional metabolic effects of fluoxetine in major depression: serial changes and relationship to clinical response. Biol Psychiatry 2000; 48:830–843Google Scholar
40 . Mayberg HS, Lozano AM, Voon V, et al: Deep brain stimulation for treatment-resistant depression. Neuron 2005; 45:651–660Google Scholar