EEG Power Spectra Differentiate Positive and Negative Subgroups in Neuroleptic-Naive Schizophrenia Patients
Several studies have demonstrated a decrease in total alpha, low alpha, and high alpha power 3 – 5 as well as reductions in alpha frequency 6 in chronic schizophrenia. However, studies with neuroleptic-naive schizophrenia patients have shown higher alpha power in schizophrenia patients relative to comparison subjects. 7 , 8 An increase in alpha1 power and a decrease in alpha2 activity in the posterior regions has been reported in untreated/drug-free schizophrenia patients realtive to healthy comparison subjects. 7 , 9 , 10 Increased delta power has been shown in unmedicated/drug-free schizophrenia patients relative to healthy comparison subjects. 6 , 9 , 10 – 12 Even though some studies have shown that there is a frontal predominance of the delta increase in unmedicated schizophrenia patients during rest, 13 , 14 others have reported that the delta increase is widespread and does not show a frontal accentuation. 6 , 9 , 10 , 12 Omori et al. 7 did not find theta power abnormalities in never-treated schizophrenia patients relative to comparison subjects. Most previous studies have shown an increase in beta power in schizophrenia patients relative to comparison subjects, 6 , 9 , 10 , 12 – 14 even though there have been reports of decreased beta power as well. 15
The possible reasons for inconsistencies in spectral power findings in schizophrenia include confounding effects of medications, heterogeneity in symptom profiles of the study samples, chronicity, and gender differences of the patients studied. Differences in recording techniques and data analyses may also interfere with the comparability of results across studies. In a majority of studies, the EEG was recorded in medicated patients with varying degrees of chronicity of illness following a drug-free period. However, there are reported differences in EEG spectral power between drug-naive and medicated patients 5 , 7 , 10 , 16 as well as between chronic and acute schizophrenia patients. 4 , 8 , 9 , 17 Gender differences have also been reported in spectral power. 18 , 19
Categorical subtyping and dimensional approaches have been proposed in the search for a satisfactory alternate conceptualization of schizophrenia psychopathology that could also reflect the pathophysiological heterogeneity of the disease, given the substantial symptom heterogeneity in schizophrenia. 20 Crow, 21 Andreasen and Olsen, 22 and Liddle 23 have been the pioneers of the above approaches. The most consistently replicated among the dimensional approaches is the three-dimensional model proposed by Liddle 23 comprising reality distortion (positive), psychomotor poverty (negative) and disorganization dimensions, whereas the classical type I (positive)-Type II (negative) dichotomy put forth by Crow 21 and Andreasen and Olsen 22 still holds the maximum heuristic value for subdividing schizophrenia into homogeneous symptom subgroups. EEG spectral power shows different profiles in the various subtypes of schizophrenia. 8 , 24 , 25
In an attempt to overcome the above-mentioned limitations of previous studies of resting EEG in schizophrenia patients, we studied EEG spectral power in neuroleptic-naive, recent-onset schizophrenia (NRS) patients, and healthy comparison subjects in the resting eyes closed condition. We further subdivided the larger schizophrenia sample comprised of heterogeneous symptom profiles, into more homogeneous subgroups with predominance of positive or negative symptoms for spectral power comparisons, while controlling for gender effects. In our sample of NRS patients, we hypothesized that higher alpha1, lower alpha2 and higher delta power would be noted relative to comparison subjects. In view of the equivocal findings from previous research with respect to theta power and beta power in the resting eyes closed condition in neuroleptic-naive schizophrenia patients, we assumed the null hypothesis in those cases. Additionally, we hypothesized that, in keeping with putatively distinct neurobiological mechanisms underlying positive and negative syndromes, 8 , 24 , 25 the spectral power would show characteristic profiles in the positive symptom and negative symptom subgroups.
METHODS
Patients
Twenty-eight consecutively recruited patients fulfilling the DSM-IV criteria for schizophrenia or schizophreniform disorder 26 were selected for the study from among those who attended the outpatient department the National Institute of Mental Health and Neurosciences (NIMHANS), in Bangalore, India. The diagnosis of schizophrenia was arrived at using criteria from the DSM-IV based on the consensus of a research psychiatrist who conducted a semistructured interview and a trained research assistant who used the Mini International Neuropsychiatric Interview (MINI) Plus. 27 The inclusion criteria were: age between 17 and 45 years; age of onset of illness more than or equal to 17 years; duration from onset less than or equal to 3 years; right-handedness (as assessed by modified Annett’s inventory 28 ) and an Mini-Mental State Examination (MMSE) score of ≥21. The exclusion criteria were: other DSM-IV axis I disorders (as ascertained by administration of MINI-Plus); previous exposure to psychotropic drugs; significant suicidal or homicidal risk or other disruptive behavior which warranted immediate interventions; history of ECT within the previous 6 months; history of institutionalization, defined as continuous hospital stay for more than 6 months and prominent catatonic features.
Comparison Subjects
Twenty-five randomly selected healthy participants, between the ages of 17 and 45 years old served as the comparison group. These participants, predominantly constituted by hospital staff and bystanders of hospitalized patients, were interviewed by an experienced psychiatrist and ascertained to have no present or past neuropsychiatric disorders; in addition, there was no history of psychotic disorders in their first degree relatives.
Both groups of participants were ascertained to have no unstable medical or neurological conditions, history of significant head injury or substance dependence (excluding tobacco) meeting DSM-IV criteria. Written informed consent was obtained from all the subjects after complete description of the study to the subjects and their significant relatives. The study was approved by the ethical review board of NIMHANS.
EEG Recording and Data Processing
Both neuroleptic-naive, recent-onset schizophrenia (NRS) patients and healthy comparison subjects were asked to avoid alcoholic beverages for at least 3 days prior to the EEG recording as well as to avoid use of nicotine for at least 3 hours prior to the recording. In the case of patients, all of whom were hospitalized and accompanied by a close relative (as is the case with all patients in our setting), abstinence from the above substances was ensured under supervision by the accompanying relative as well as the nurse-in-charge. However, for both patients and comparison subjects, we did not carry out a urine drug screen prior to the EEG recording. Further, no specific instructions regarding caffeine consumption prior to EEG recording was given. The EEGs were recorded between 3 p.m. and 6 p.m.
The participants were seated in a comfortable reclining chair with a head rest in a dimly lit, sound-attenuated, and electrically shielded room. They were given a half hour to acclimatize with the conditions. The EEG Electro-cap was fixed and electro-conducting gel was applied for all the electrodes. Three minutes of EEG was acquired while the subjects were seated with their eyes closed in an alert, quiet, and relaxed state. The participants were instructed to minimize blinking and roving movements of their eyes.
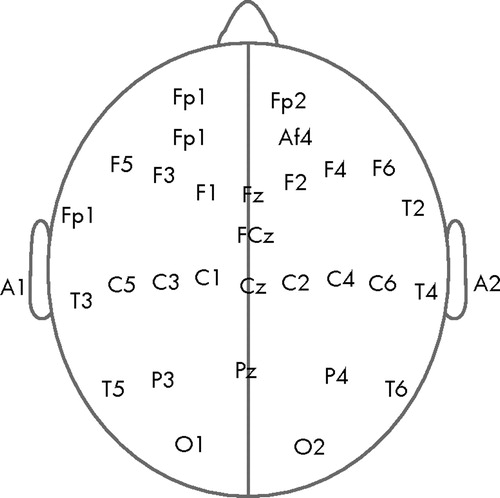
The EEG recording was performed with a 32-channel bioamplifier system (band pass filter: 0.5–30 Hz) of the Nihon-Kohden type using the EEG-SYS software. 29 The amplifiers were calibrated with a 50 μV sin wave in the 4–8 Hz frequency band, generated by the Nihon-Kohden signal generator. The EEG was recorded from 30 cephalic locations (FP1, FP2, AF3, AF4, F5, F3, F1, Fz, F2, F4, F6, T1, FCz, T2, T3, C5, C3, C1, Cz, C2, C4, C6, T4, T5, P3, Pz, P4, T6, O1, O2) positioned according to the 10/20 International System ( Figure 1 ). Eye movements were monitored using electrodes placed 1/2 inch lateral to the outer canthi of both eyes and connected to the horizontal oculogram channel, as well as with electrodes positioned 1/2 inch above and 1/2 inch below both eyes and connected to the vertical oculogram channel. The electronically linked averaged ear-lobe signal ([A1 + A2]/2) was used as the reference signal. The impedance of all electrodes was kept below 5 kilo ohms. A ground electrode was placed 3 cm anterior to Fz. The signals were digitized at a rate of 256 Hz and converted into ASCII format for further processing and analysis.
Baseline correction of the digital EEG signal was achieved using an autoregressive filter with coefficient 0.97. The 50 Hz and other high frequency noises were removed using a bidirectional 150-order Finite Impulse Response (FIR) digital filter with a bandwidth of 0.5–30 Hz (time constant: 0.3 second). Epochs contaminated by artifacts due to eye movements, eye blinking, drowsiness, muscle tension, sweat, or technical errors were excluded offline by careful visual inspection of the record by a researcher who was blind to the group status of the subjects. Prior to this, interrater reliability of artifact rejection was established. An average artifact-free EEG length of 75.43±26.05 seconds and 72.88±35.59 seconds was obtained in the comparison group and schizophrenia group, respectively. It has been shown by previous research that reliable EEG power values in all frequency bands could be obtained in both schizophrenia patients and healthy comparison subjects from a minimum of 32 seconds of artifact-free data. 30 For each participant, the artifact-free EEG signals were then subjected to Fast Fourier Transformation 1 by averaging over each 2-second epoch using a Hanning window to obtain the spectral power in the following nonoverlapping frequency bands: delta: 0.5 Hz–4.0 Hz; theta: 4.5 Hz–8.0 Hz; alpha1: 8.5 Hz–10 Hz; alpha2: 10.5 Hz–12.5 Hz; beta1: 13.0 Hz–17.5 Hz; beta2: 18.0 Hz–21.0 Hz; beta3: 21.5 Hz–30.0 Hz. These band widths were defined in accordance to the factor solution of Herrmann et al., 31 generated from resting eyes closed EEG. Both absolute and relative power (absolute power/total power) in all the bandwidths were computed, following which the weighted relative power for each band 32 at each electrode position was computed by multiplying (i.e., weighting) the relative power value of a given band and site by the number of artifact-free 2-second epochs of EEG available within each 180-second eyes closed EEG record of every subject. The relative power was used for statistical analysis considering that NRS patients had significantly higher total power compared to healthy comparison subjects ( Table 1 ). EEG signal processing and computation of power values were carried out using MATLAB, version 5.3.1. 33
 |
Psychopathology Ratings and Subgrouping of the Schizophrenia Patient Sample
The symptoms in schizophrenia patients were assessed using the Scale for the Assessment of Negative Symptoms (SANS) 34 and the Scale for the Assessment of Positive Symptoms (SAPS). 35 The psychopathology ratings for all the patients were carried out by one psychiatrist who had sufficient training and experience in administering the scales. The schizophrenia patient sample was subgrouped based on their SANS and SAPS scores into “positive” and “negative” according to the guidelines suggested by Andreasen et al. 36 Briefly, those subgrouped as positive schizophrenia had at least one of the following present to a marked degree (rating of ≥4 on SAPS): (1) hallucinations; (2) delusions; (3) formal thought disorder; or (4) bizarre behavior. Additionally, none of the following SANS items were present to a marked degree (rating of ≥4): (a) alogia; (b) affective flattening; (c) avolition-apathy; (d) anhedonia-asociality; or (e) attentional impairment. On the other hand, in those subgrouped as “negative” schizophrenia, at least two of the SANS items mentioned as (a)-(e) above were present to a marked degree, while none of the SAPS items mentioned as (1)-(4) above were present to a marked degree. The mixed subgroup (n=9) which included those patients who did not meet criteria for either positive or negative schizophrenia or who met criteria for both were excluded from subgroup analysis. Further, the psychopathological dimension scores were calculated from the total scores of SANS and SAPS subitems as follows: psychosis = delusions + hallucinations; negative = affective blunting + alogia + avolition + anhedonia; disorganization = formal thought disorder + bizarre behavior + inappropriate affect. 37 A more detailed description of the pattern of psychopathological dimensions observed in neuroleptic-naive, recent-onset schizophrenia patients from India is given elsewhere. 38
Statistical Analysis
Normal distribution of the weighted relative spectral power values was assessed using Shapiro-Wilks test of normality. Since most of the power values were non-normally distributed, nonparametric statistical tests (Mann-Whitney U test and Kruskal-Wallis test) were used initially to make group and subgroup (Bonferroni corrected) comparisons of delta, theta, alpha1, alpha2, beta, and total power at individual electrode locations for purposes of graphical representation of power values in the individual bands.
Primary Analysis
Log 10 x-transformed weighted relative power in the total, delta, theta, alpha1, alpha2, and beta bands were analyzed using a repeated measures analysis of covariance (ANCOVA) model containing seven regions (left frontal, right frontal, central, left temporal, right temporal, left centro-parieto-occipital, and right centro-parieto-occipital), each comprised of four channels, with group and gender as between-subject factors, electrode locations as within-subjects factors, and age as covariate. This method of data analysis has been previously employed for analysis of individual frequencies of the resting EEG. 39 , 40 Similarly, group comparisons were carried out between the symptom subgroups as well.
Secondary Analyses
Following the above, a two-way analysis of covariance (ANCOVA) with group and gender as between-subject factors and age as covariate was used as a post-hoc assessment to analyze topographic group differences for log-transformed power at the seven scalp regions mentioned above. Secondary analyses also included assessing differences in relative weighted power in the seven scalp regions between the positive symptom subgroup, the negative symptom subgroup, and healthy comparison subjects using a similar procedure that included the Bonferroni correction for multiple comparisons. The statistical analyses were carried out using SPSS, Version 11.5.0.
RESULTS
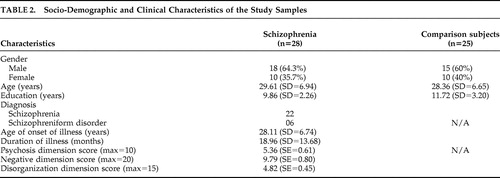
The sociodemographic and clinical characteristics of the subjects are summarized in Table 2 . The patient group and the comparison group did not differ significantly with respect to age and male:female ratio. However the NRS patients and healthy comparison (HC) subjects differed significantly (NRS<HC) in educational status (t=2.472, p<0.017). Within the patient sample, the positive symptom subgroup comprised of 10 patients, the negative symptom subgroup included nine patients, and nine patients were classified under the mixed subgroup. The positive symptom subgroup was comprised of patients with predominant positive symptoms of schizophrenia [positive score=7.00 (SE=0.67); negative score=5.80 (SE=0.65); disorganization score=4.20 (SE=0.85)], whereas the patients in the negative symptom subgroup had predominant negative symptoms [positive score=2.00 (SE=0.47); negative score=13.67 (SE=0.71); disorganization score=6.11 (SE=0.72)].
 |
Schizophrenia Patients Versus Healthy Comparison Subjects
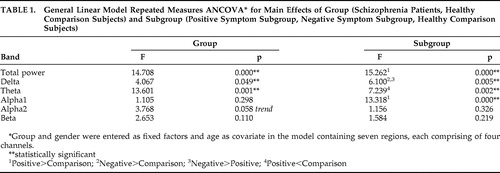
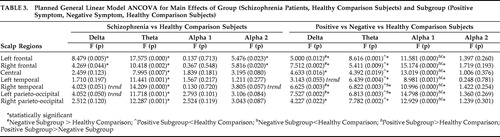
The F values and significance levels for the group main effect using repeated measures ANCOVA are summarized in Table 1 . Neuroleptic-naive, recent-onset schizophrenia (NRS) patients had significantly higher total and delta power and lower theta, as well as a trend toward lower alpha2 relative to healthy comparison subjects, as analyzed using repeated measures ANCOVA with group and gender entered as fixed factors and age as covariate in the model containing seven regions, each comprising four channels as mentioned earlier. Beta power showed no differences between NRS and healthy comparison subjects. On performing subsequent univariate ANCOVA ( Table 3 ), NRS patients showed higher delta power and lower alpha2 power in the left and right frontal regions as well as lower theta power in all seven regions. There were no regional differences noted between NRS and healthy comparison subjects in alpha1 power.
 |
Positive Versus Negative Subgroups Versus Healthy Comparison Subjects
The F values and significance levels for the main effect of symptom subgroups using repeated measures ANCOVA are given in Table 1 . There were significant differences between the subgroups in total, delta, theta, and alpha1 power. Univariate ANCOVA ( Table 3 ) showed significantly higher delta power in the left and right frontal, right temporal and left parieto-occipital regions in the negative symptom subgroup relative to healthy comparison subjects. Theta power was lower in the left and right frontal, central, and left temporal regions in the positive symptom subgroup and lower in both positive symptom and negative symptom subgroups in the right temporal and left parieto-occipital regions, relative to healthy comparison subjects. The positive symptom subgroup had higher alpha1 power in all the regions relative to both healthy comparison subjects and negative symptom subgroups. There were no regional differences in alpha2 power across the subgroups.
Spectral power maps generated using the mean relative weighted power values at the 30 locations in the four spectral bands (delta, theta, alpha1, and alpha2) which showed significant differences between groups/subgroups are shown in the (a) panels of Figure 1 , Figure 2 , Figure 3 , and Figure 4 . These maps were plotted using the “griddata (v4)” method on MATLAB version 5.3.1. Power values in the delta, theta, and alpha2 in the NRS patients and healthy comparison subject groups, and symptom subgroups, as well as in the alpha1 band in the subgroups, at electrode locations where significant group/subgroup differences were noted using Mann-Whitney U test or Kruskal-Wallis test, are represented graphically in in the (b) and (c) panels of Figure 1 , Figure 2 , Figure 3 , and Figure 4 .
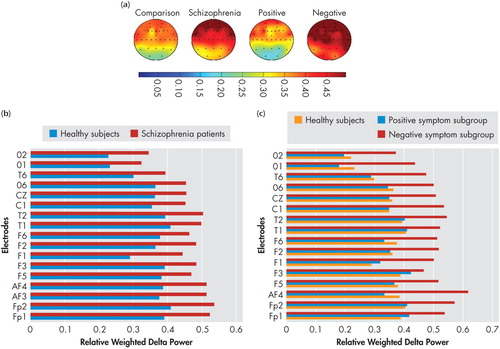
(a) Spectral power maps generated using the mean relative weighted delta power values at the 30 scalp locations in healthy comparison subjects (n=25), schizophrenia patients (n=28), the positive symptom subgroup (n=10), and the negative symptom subgroup (n=9). The maps were generated using the “griddata (v4)” method on MATLAB version 5.3.1.
(b) Comparison of mean relative weighted delta power values between schizophrenia patients and healthy comparison subjects at electrode locations where significant group differences were noted using Mann-Whitney U test.
(c) Comparison of mean relative weighted delta power values between positive, negative, and healthy comparison subjects at electrode locations where significant subgroup differences were noted using Kruskal-Wallis test.
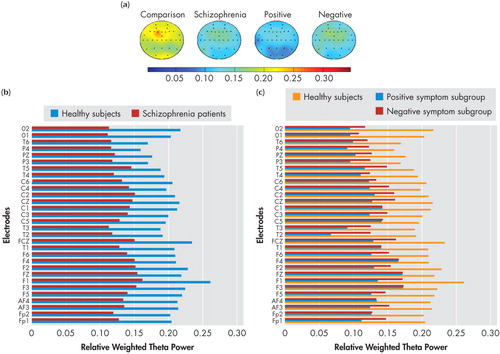
(a) Spectral power maps generated using the mean relative weighted theta power values at the 30 scalp locations in healthy comparison subjects (n=25), schizophrenia patients (n=28), the positive symptom subgroup (n=10), and the negative symptom subgroup (n=9). The maps were generated using the“griddata (v4)” method on MATLAB version 5.3.1.
(b) Comparison of mean relative weighted theta power values between schizophrenia patients and healthy comparison subjects at electrode locations where significant group differences were noted using Mann-Whitney U test.
(c) Comparison of mean relative weighted theta power values between positive, negative, and healthy comparison subjects at electrode locations where significant subgroup differences were noted using Kruskal-Wallis test.
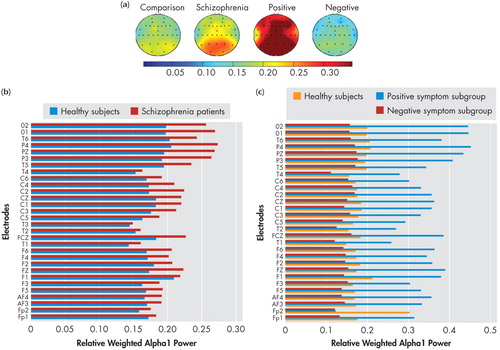
(a) Spectral power maps generated using the mean relative weighted alpha1 power values at the 30 scalp locations in healthy comparison subjects (n=25), schizophrenia patients (n=28), the positive symptom subgroup (n=10), and the negative symptom subgroup (n=9). The maps were generated using the“griddata (v4)” method on MATLAB version 5.3.1.
(b) Comparison of mean relative weighted alpha1 power values between schizophrenia patients and healthy comparison subjects.
(c) Comparison of mean relative weighted alpha1 power values between positive, negative, and healthy comparison subjects at electrode locations where significant sub-group differences were noted using Kruskal-Wallis test.
DISCUSSION
EEG activity in the resting state defines a baseline for brain activity, which allows for studying different brain regions governed by the same “dynamic” process. 41 Further, resting EEG has been demonstrated to be a heritable trait across the entire frequency spectrum. 42 Previous studies that have looked at differences in resting EEG power between healthy comparison subjects and chronic medicated schizophrenia patients have yielded intriguing results. We attempted to refine and extend the findings of the previous approaches by studying spectral power in neuroleptic-naive, recent-onset schizophrenia (NRS) patients. We also examined these variables in the positive symptom and negative symptom subgroups derived from the overall sample, thus attempting to link spectral power with the positive and negative symptom dimensions of schizophrenia.
Since functional differences have been reported between low alpha and high alpha, 43 , 44 we computed alpha spectral power values in the following bandwidths: alpha1 (8.5–10 Hz) and alpha2 (10.5–12.5 Hz). It is well-known that the classical posterior alpha rhythm denotes a state of relaxed wakefulness 45 and also seems to reflect attentional processes. 46 Memory performance including working memory, short-term memory and probably long-term memory has a positive relationship with mean alpha frequency 47 , 48 and thus, alpha2 may underlie performance of such cognitive tasks. Specifically, upper alpha band is involved in semantic long-term memory. 46 , 49
While NRS and healthy comparison subjects did not show significant differences in alpha1 power in the resting state, the positive symptom subgroup showed higher alpha1 power in all the seven regions—left and right frontal, central, left and right temporal as well as left and right parieto-occipital—than healthy comparison subjects and negative symptom subgroup. Thus the results of our study indicate higher alpha1 power is associated with the positive symptom dimension in NRS patients. In contrast to the alpha1 findings, NRS patients showed a reduction of alpha2 power relative to healthy comparison subjects in the frontal regions, replicating earlier reports of decreased alpha2 power in NRS patients. 5 , 7 Further, the negative symptom subgroup had lower alpha2 power in the two isolated channels in the right frontal and temporal regions, while region-wise comparisons did not yield significant subgroup differences.
Alpha power has been shown to be inversely related to brain activation in healthy subjects (i.e., an increase in alpha power is linked to decreased cortical activation 50 and cognitive dysfunction). 51 However, in the presence of brain disease, alpha activity has been shown to be positively associated with brain perfusion. 50 , 52 , 53 Therefore the higher alpha1 power noted in the resting state in the positive symptom subgroup can be inferred to indicate higher brain activity levels in the lower alpha frequency range in the resting state due to the presence of positive symptoms such as hallucinations and delusions.
The opposite direction of differences in alpha1 and alpha2 (increase of alpha1 and decrease of alpha2) noted in the present study replicates the results of Omori et al. 7 and Miyauchi et al. 9 in untreated schizophrenia subjects. Thus it may be noted that the results of our study are broadly in concordance with those of previous studies with neuroleptic-naive patients. Most of the previous studies that have investigated alpha power in chronic medicated schizophrenia patients, however, have shown a decreased alpha power relative to comparison subjects. 3 , 17 , 54 Reduction in alpha power and slowing of EEG have been observed in the medicated state in schizophrenia patients, when compared with the neuroleptic-naive state, 5 , 7 , 10 , 16 and in chronic schizophrenia patients in comparison with acutely ill schizophrenia patients. 4 , 8 , 9 , 17 Our observation of an increased power in the lower alpha band and a reduction in power in the higher alpha band is compatible with the findings of Karson et al., 55 who reported a slowing of the alpha frequency in schizophrenia patients. Additionally, Omori et al. 7 reported a relationship between positive symptoms and slowing of alpha frequency in never-treated schizophrenia patients. Considering that alpha2 underlies performance of memory tasks, the relevance of low frontal alpha2 in NRS patients in the resting state is not clear and warrants further investigation. Nevertheless, lower alpha2 has been shown to predict treatment resistance, whereas higher alpha1 power was associated with good response to treatment. 56 The relationship between high alpha1 to positive symptoms and low alpha2 to negative symptoms fits in with the understanding that presence of negative symptoms predicts poorer response to treatment and vice versa. 57
Increase in delta activity, which is more pronounced in the frontal regions during rest, 13 , 14 is suggested to represent the electrophysiological correlate of metabolic hypofrontality reported by previous functional imaging studies. 11 , 58 , 59 However, Karson et al. 6 demonstrated that there is an important eye movement contribution to the apparent frontal predominance of delta. The results of Miyauchi et al., 9 Kemali et al., 10 and Galderisi et al. 12 further confirmed that the delta increase in untreated schizophrenia patients is widespread and does not show a frontal accentuation. Our findings are in agreement with previous research that linked delta power with negative dimension of schizophrenia symptoms. 60 – 62 The widespread increase in delta power noted in the schizophrenia sample in the present study is likely attributable to the negative symptom subgroup as indicated by increased delta power in the negative symptom subgroup relative to comparison subjects as well as the positive symptom subgroup, thus linking negative symptoms with diffuse cortical hypometabolism. Delta power is shown to decrease with initiation of pharmacotherapy. 63 Further, lower delta power has been shown to be associated with better treatment response. 56 The results of our study which link higher delta power with negative symptoms may suggest an expected poorer treatment response in such patients. 57
Theta power in the resting awake condition underlies higher mental functions including memory formation and retrieval. 49 , 64 Specifically, theta power may underlie episodic encoding processes in working memory. 65 Gundel and Wilson 66 demonstrated a positive relationship between theta activity and increasing task difficulty on a Sternberg paradigm. Gevins et al. 67 proposed an anteromedial cortical origin for theta activity (frontal-midline theta) that underlies working memory functions, hypothesized to be deranged in schizophrenia. 68 Thus the finding of decreased theta power in the present study would reflect an underlying dysfunction of the frontal-midline theta activity. Reduced theta power could be considered as a hallmark of the schizophrenia state, considering that it was noted in both the positive symptom and negative symptom subgroups. This reduction in theta power along with the reduced alpha2 power mentioned earlier, may underlie the cognitive dysfunction in schizophrenia. Our findings replicate the reduced theta power reported in a previous study on neuroleptic-naive schizophrenia patients. 5 Increased theta power found in other studies on medicated schizophrenia patients may have been due to the effect of psychotropics. Interestingly, Knott et al. 68 demonstrated that increments in relative theta power at the end of 6 weeks of clozapine treatment paralleled improvement in the symptom dimensions of the Positive and Negative Syndrome Scale. Further, decreased global field synchronization in the theta band has been suggested as a state-related phenomenon in neuroleptic-naive schizophrenia patients in the symptomatic phase, which reverses within 2–8 weeks of treatment in those who respond to neuroleptics. 69
The beta power is most prominent in the eyes open condition and is linked to cortical arousal. Therefore, beta power on the scalp-recorded EEG in the resting eyes closed condition would be expectedly less when compared to other frequency bands; accordingly, we did not find any significant differences in beta power between NRS patients and healthy comparison subjects ( Table 1 ). Thus, the findings of our study indicate that beta activity may not yield consistent enough results when analyzed in the resting eyes closed condition to be of use in differentiating schizophrenia patients or the symptom subgroups from comparison subjects.
A limitation of the present study is the relatively small sample size of the positive symptom and negative symptom subgroups, even though the overall sample size is comparable with that of most previous reports on NRS patients. The results of the study should therefore be confirmed in larger samples of positive symptom and negative symptom subgroups in neuroleptic-naive schizophrenia patients. Further, considering our sampling frequency of 256 Hz, we restricted our bandwidth for power estimation to 0.5 Hz–30 Hz for obtaining reliable results, thereby excluding gamma frequency, which has been shown to be abnormal in schizophrenia patients especially following cognitive activation. 70 , 71
In conclusion, our results demonstrate that neuroleptic-naive, recent-onset schizophrenia patients show significant differences in resting eyes closed spectral power relative to healthy comparison subjects. Our findings also highlight the characteristic spectral profiles of positive symptom and negative symptom subgroups of schizophrenia that should lead to hypothesis-driven studies of QEEG correlates of positive and negative symptom dimensions of schizophrenia, which in turn could shed further light on the neurobiological underpinnings of these symptom dimensions. Further, the pattern of change in the relationship between EEG power spectra and symptom dimensions with treatment could throw more light on the pathophysiology of the symptom dimensions and the effects of treatment.
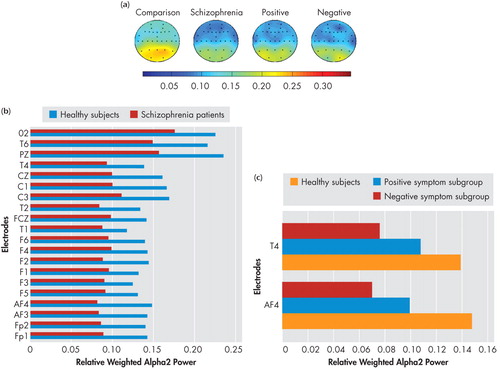
(a) Spectral power maps generated using the mean relative weighted alpha2 power values at the 30 scalp locations in healthy comparison subjects (n=25), schizophrenia patients (n=28), the positive symptom subgroup (n=10), and the negative symptom subgroup (n=9). The maps were generated using the “griddata (v4)” method on MATLAB version 5.3.1.
(b) Comparison of mean relative weighted alpha1 power values between schizophrenia patients and healthy comparison subjects at electrode locations where significant group differences were noted using Mann-Whitney U test.
(c) Comparison of mean relative weighted alpha2 power values between positive, negative, and healthy comparison subjects at electrode locations where significant subgroup differences were noted using Kruskal-Wallis test.
1. Cooley J, Tukey J: An algorithm for the machine calculation of complex Fourier series. Mathematics of Computation 1965; 19:297–301Google Scholar
2. Hughes JR, John ER: Conventional and quantitative electroencephalography in psychiatry. J Neuropsychiatry Clin Neurosci 1999; 11:190–208Google Scholar
3. Giannitrapani D, Kayton L: Schizophrenia and EEG spectral analysis. Electroencephalogr Clin Neurophysiol 1974; 36:377–386Google Scholar
4. Sponheim SR, Clementz BA, Iacono WG, et al: Resting EEG in first-episode and chronic schizophrenia. Psychophysiology 1994; 31:37–43Google Scholar
5. Nagase Y, Okubo Y, Toru M: Electroencephalography in schizophrenic patients: comparison between neuroleptic-naive state and after treatment. Biol Psychiatry 1996; 40:452–456Google Scholar
6. Karson CN, Coppola R, Morihisa JM, et al: Computed electroencephalographic activity mapping in schizophrenia: the resting state reconsidered. Arch Gen Psychiatry 1987; 44:514–517Google Scholar
7. Omori M, Koshino Y, Murata T, et al: Quantitative EEG in never-treated schizophrenic patients. Biol Psychiatry 1995; 38:305–309Google Scholar
8. Miyauchi T, Endo S, Kajiwara S, et al: Computerized electroencephalogram in untreated schizophrenics: a comparison between disorganized and paranoid types. Psychiatry Clin Neurosci 1996; 50:71–78Google Scholar
9. Miyauchi T, Tanaka K, Hagimoto H, et al: Computerized EEG in schizophrenic patients. Biol Psychiatry 1990; 28:488–494Google Scholar
10. Kemali D, Galderisi S, Maj M, et al: Computerized EEG topography findings in schizophrenic patients before and after haloperidol treatment. Int J Psychophysiol 1992; 13:283–290Google Scholar
11. Buchsbaum MS, Ingvar DH, Kessler R, et al: Cerebral glucography with positron tomography: use in normal subjects and in patients with schizophrenia. Arch Gen Psychiatry 1982; 39:251–259Google Scholar
12. Galderisi S, Mucci A, Mignone ML, et al: CEEG mapping in drug-free schizophrenics: differences from healthy subjects and changes induced by haloperidol treatment. Schizophr Res 1991; 6:15–23Google Scholar
13. Morihisa JM, Duffy FH, Wyatt RJ: Brain electrical activity mapping (BEAM) in schizophrenic patients. Arch Gen Psychiatry 1983; 40:719–728Google Scholar
14. Morstyn R, Duffy FH, McCarley RW: Altered topography of EEG spectral content in schizophrenia. Electroencephalogr Clin Neurophysiol 1983; 56:263–271Google Scholar
15. Guenther W, Moser E, Petsch R, et al: Pathological cerebral blood blow and corpus callosum abnormalities in schizophrenia: relations to EEG mapping and PET data. Psychiatry Res 1989; 29:453–455Google Scholar
16. Itil TM, Patterson CD, Keskiner A, et al: Comparison of phenothiazine and nonphenothiazine neuroleptics according to psychopathology, side effects and computerized EEG. Adv Biochem Psychopharmacol 1974; 9:499–509Google Scholar
17. Fenton GW, Fenwick PB, Dollimore J, et al: EEG spectral analysis in schizophrenia. Br J Psychiatry 1980; 136:445–455Google Scholar
18. Marosi E, Harmony T, Becker J, et al: Sex differences in EEG coherence in normal children. Int J Neurosci 1993; 72:115–121Google Scholar
19. Wada Y, Takizawa Y, Jiang ZY, et al: Gender differences in quantitative EEG at rest and during photic stimulation in normal young adults. Clin Electroencephalogr 1994; 25:81–85Google Scholar
20. Liddle PF: The multidimensional phenotype of schizophrenia, in Schizophrenia in a Molecular Age: Review of Psychiatry Series, Vol. 18. Edited by Tamminga CA. American Psychiatric Press, Washington, DC, 1999, pp 1–28Google Scholar
21. Crow TJ: Molecular pathology of schizophrenia: more than one process? Br Med J 1980; 280:66–68Google Scholar
22. Andreasen NC, Olsen S: Negative vs. positive schizophrenia: definition and validation. Arch Gen Psychiatry 1982; 39:789–794Google Scholar
23. Liddle PF: The symptoms of schizophrenia: a re-examination of the positive-negative dichotomy. Br J Psychiatry 1987; 151:145–151Google Scholar
24. Kessler C, Kling A: EEG power variation in schizophrenic subgroups: effects of emotionally salient stimuli. Biol Psychiatry 1991; 30:335–348Google Scholar
25. Begic D, Hotujac LJ, Jokic-Begic N: Quantitative EEG in “positive” and “negative” schizophrenia. Acta Psychiatr Scand 2000; 101:307–311Google Scholar
26. American Psychiatric Association: Diagnostic and Statistical Manual of Mental Disorders, 4th ed. American Psychiatric Press, Washington, DC, 1994Google Scholar
27. Sheehan DV, Lecrubier Y, Sheehan KH, et al: The Mini-International Neuropsychiatric Interview (M.I.N.I): the development and validation of a structured diagnostic psychiatric interview for DSM-IV and ICD-10. J Clin Psychiatry 1998; 59(suppl 20):22–33Google Scholar
28. Annett M: A coordination of hand preference and skill replicated. Br J Psychol 1976; 67:587–592Google Scholar
29. Hartwell JW: EEGSYS (Version 5.7). Friends Medical Science Research Center, Inc., Baltimore, MD, 1995Google Scholar
30. Sponheim SR, Clementz BA, Iacono WG, et al: Clinical and biological concomitants of resting state EEG power abnormalities in schizophrenia. Biol Psychiatry 2000; 48:1088–1097Google Scholar
31. Herrmann WM, Fichte K, Kubicki S: [The mathematical rationale for the clinical EEG frequency bands. 3. Factors structure under treatment with psychotropid drugs (author’s translation)]. EEG EMG Z Elektroenzephalogr Elektromyogr Verwandte Geb 1978; 9:200–205 (German)Google Scholar
32. Tomarken AJ, Davidson RJ, Wheeler RE, et al: Psychometric properties of resting anterior EEG asymmetry: temporal stability and internal consistency. Psychophysiology 1992; 29:576–592Google Scholar
33. MATLAB. 5.3.1. Ed, Mathwork, Inc, 1999Google Scholar
34. Andreasen NC: The Scale for the Assessment of Negative Symptoms (SANS). University of Iowa, Iowa, 1983Google Scholar
35. Andreasen NC: The Scale for the Assessment of Positive Symptoms (SAPS). University of Iowa, Iowa, 1984Google Scholar
36. Andreasen NC, Flaum M, Swayze VW 2nd, et al: Positive and negative symptoms in schizophrenia: a critical reappraisal. Arch Gen Psychiatry 1990; 47:615–621Google Scholar
37. Andreasen NC, Arndt S, Alliger R, et al: Symptoms of schizophrenia: methods, meanings and mechanisms. Arch Gen Psychiatry 1995; 52:341–351Google Scholar
38. John JP, Khanna S, Thennarasu K, et al: Exploration of dimensions of psychopathology in neuroleptic-naive patients with recent-onset schizophrenia/schizophreniform disorder. Psychiatry Res 2003; 121:11–20Google Scholar
39. Rangaswamy M, Porjesz B, Chorlian D, et al: Resting EEG in offspring of male alcoholics: beta frequencies. Int J Psychophysiol 2004; 51:239–251Google Scholar
40. Rangaswamy M, Porjesz B, Chorlian D, et al: Theta power in the EEG of alcoholics. Alcohol Clin Exp Res 2003; 27:607–615Google Scholar
41. Elbert T, Lutzenberger W, Rockstroh B, et al: Physical aspects of the EEG in schizophrenics. Biol Psychiatry 1992; 32:595–606Google Scholar
42. Smit CM, Wright MJ, Hansell NK, et al: Genetic variation of individual alpha frequency (IAF) and alpha power in a large adolescent twin sample. Int J Psychophysiol 2006; 61:235–243Google Scholar
43. Pfurtscheller G, Lopes Da Silva FH: Event-related EEG/MEG synchronization and desynchronization: basic principles. Clin Neurophysiol 1999; 110:1842–1857Google Scholar
44. Verstraeten E, Cluydts R: Attentional switching-related human EEG alpha oscillations. Neuroreport 2002; 13:681–684Google Scholar
45. Niedermeyer E: Alpha rhythms as physiological and abnormal phenomena. Int J Psychophysiol 1997; 26:31–49Google Scholar
46. Klimesch W: EEG-alpha rhythms and memory process. Int J Psychophysiol 1997; 26:319–340Google Scholar
47. Klimesch W, Schimke H, Ladurner G, et al: Alpha frequency and memory performance. J Psychophysiol 1990; 4:381–390Google Scholar
48. Basar E, Basar-Eroglu C, Roschke J, et al. The EEG is a quasi-deterministic signal anticipating sensory-cognitive tasks, in Brain Dynamics: Progress and Perspectives. Edited by Basar E, Bullock TH. Springer-Verlag, Berlin, 1989, pp 43–71Google Scholar
49. Klimesch W, Doppelmayr M, Russegger H, et al: Theta band power in the human scalp EEG and the encoding of new information. Neuroreport 1996; 7:1235–1240Google Scholar
50. Leuchter AF, Uijtdehaage SH, Cook IA, et al: Relationship between brain electrical activity and cortical perfusion in normal subjects. Psychiatry Res 1999; 90:125–140Google Scholar
51. Crawford HJ, Vasilescu P: Differential EEG pattern activity of low and high sustained attention adults during decision-making tasks. Psychophysiology 1995; 31(suppl 1):S26Google Scholar
52. Sloan EP, Fenton GW, Kennedy NS, et al: Electroencephalography and single photon emission computed tomography in dementia: a comparative study. Psychol Med 1995; 25:631–638Google Scholar
53. Nagata K, Tagawa K, Hiroi S, et al: Electroencephalographic correlates of blood flow and oxygen metabolism provided by positron emission tomography in patients with cerebral infarction. Electroencephalogr Clin Neurophysiol 1989; 72:16–30Google Scholar
54. Gruzelier JH: Brain function in psychiatric disorders reconsidered. Arch Gen Psychiatry 1985; 42:421–422Google Scholar
55. Karson CN, Coppola R, Daniel DG, et al: Computerized EEG in schizophrenia. Schizophr Bull 1988; 14:193–197Google Scholar
56. Ramos J, Cerdan LF, Guevara MA, et al: Abnormal EEG patterns in treatment-resistant schizophrenic patients. Int J Neurosci 2001; 109:47–59Google Scholar
57. Fenton WS, McGlashan TH: Antecedents, symptom progression and long-term outcome of the deficit syndrome in schizophrenia. Am J Psychiatry 1994; 151:351–356Google Scholar
58. Ingvar DH, Franzen G: Distribution of cerebral activity in chronic schizophrenia. Lancet 1974; 2:1484–146Google Scholar
59. Buchsbaum MS: The frontal lobes, basal ganglia, and temporal lobes as sites for schizophrenia. Schizophr Bull 1990; 16:379–389Google Scholar
60. Gattaz WF, Mayer S, Ziegler, et al. Hypofrontality on topographic EEG in schizophrenia: correlations with neuropsychological and psychopathological parameters. Eur Arch Psychiatry Clin Neurosci 1992; 241:328–332Google Scholar
61. Guenther W, Davous P, Godet JL, et al: Bilateral brain dysfunction during motor activation in type II schizophrenia measured by EEG mapping. Biol Psychiatry 1988; 23:295–311Google Scholar
62. Harris AW, Williams L, Gordon E, et al: Different psychopathological models and quantified EEG in schizophrenia. Psychol Med 1999; 29:1175–1181Google Scholar
63. Begic D, Hotujac L, Jokic-Begic N: Quantitative EEG in schizophrenic patients before and during pharmacotherapy. Neuropsychobiology 2000; 41:166–170Google Scholar
64. Burgess AP, Gruzelier JH: Short duration synchronization of human theta rhythm during recognition memory. Neuroreport 1997; 8:1039–1042Google Scholar
65. Klimesch W, Schimke H, Schwaiger J: Episodic and semantic memory: an analysis in the theta and alpha band. Electroencephalogr Clin Neurophysiol 1994; 91:428–441Google Scholar
66. Gundel A, Wilson GF: Topographical changes in the ongoing EEG related to the difficulty of mental tasks. Brain Topogr 1992; 5:17–25Google Scholar
67. Gevins A, Smith ME, McEvoy L, et al: High-resolution EEG mapping of cortical activation related to working memory: effects of task difficulty, type of processing, and practice. Cereb Cortex 1997; 7:374–385Google Scholar
68. Knott V, Labelle A, Jones B, et al: Quantitative EEG in schizophrenia and in response to acute and chronic clozapine treatment. Schizophr Res 2001; 50:41–53Google Scholar
69. Kikuchi M, Koenig T, Wada Y, et al: Native EEG and treatment effects in neuroleptic-naïve schizophrenic patients: time and frequency domain approaches. Schizophr Res 2007; 97:163–172Google Scholar
70. Yeragani VK, Cashmere D, Miewald J, et al: Decreased coherence in higher frequency ranges (beta and gamma) between central and frontal EEG in patients with schizophrenia: a preliminary report. Psychiatry Res 2006; 141:53–60Google Scholar
71. Spencer KM, Nestor PG, Niznikiewicz MA, et al: Abnormal neural synchrony in schizophrenia. J Neurosci 2003; 23:7407–7411Google Scholar