Proteomic Profiling of Plasma and Serum in Elderly Patients With Delirium
The pathophysiology of delirium is still poorly understood although several mechanisms have been proposed. 5 Some studies looked at individual proteins in relation to delirium to unravel the pathophysiology. 6 These candidates were studied based on a priori models of pathophysiology, thus running the risk of missing possible alternative mechanisms. Proteomics, the large-scale study of proteins, provides the opportunity to identify proteins potentially involved in the pathophysiological mechanism, for example, by comparing protein expression profiles. 7 Differences in protein profiles in brain tissue have been found in a rat model of hyperactive delirium. 8 In blood plasma, proteomic techniques have revealed specific oxidized proteins associated with Alzheimer’s disease. 9
We hypothesize that differences in protein profiles also occur in patients who develop delirium. Since orthopedic surgery after a hip fracture is a time-defined trigger for postoperative delirium with in-hospital recovery, this setting provides a good opportunity to study protein expression during the development of delirium in elderly patients. The aim of the current study was to compare the protein profiles found in plasma and serum in patients during a postoperative delirium with the profiles of patients without postoperative delirium and to identify protein(s) corresponding to possible observed discriminating peaks.
METHODS
Patients
All consecutive patients ages 65 years or older suffering from an acute hip fracture and scheduled for operation at the Department of Orthopedic Surgery or Traumatology of the Academic Medical Centre, Amsterdam, were invited to participate in this cohort study from May 2005 until September 2006. We obtained informed consent from the patients or from the substitute decision-makers in cases of cognitive impairment. Patients were excluded if they were unable to speak or understand Dutch or English. The Institutional Medical Ethics Committee approved the study.
We selected a random group of eight patients with delirium and eight patients without delirium as a testing group. We selected the patients without delirium to resemble the delirium patients as much as possible with respect to type of anesthesia (spinal or general), gender, and postoperative day. If this testing group resulted in significant differences in protein profile between patients with and without delirium, a second random group consisting of eight patients with and eight without delirium (validation group) would be selected. If the validation group confirmed the findings from the testing group, both groups would be combined in the subsequent analysis, which then would consist of 16 patients with delirium and 16 patients without delirium.
Procedures
Two geriatric physicians (SR), a fellow in geriatric medicine (BM), and a team of research nurses trained in geriatric medicine collected demographic and clinical data from all study participants. The presence or absence of delirium was scored during weekdays separately by a physician and a nurse using the Confusion Assessment Method. 10 The Confusion Assessment Method has an overall sensitivity of 94% (95% confidence interval [CI]=91%–97%) and specificity of 89% (95% CI=85%–94%) for diagnosing delirium. 11 We based our clinical judgment on psychiatric examination of the patient; medical and nursing records, including the Delirium Observation Screening Scale (DOSS) 12 ; and information given by relatives. When there was disagreement about the diagnosis between nurse and geriatrician, the patient was discussed in the geriatric consultation team to gain consensus.
Possible confounding factors were registered for all patients (e.g., fracture characteristics, type of anesthesia, type of surgery, time between hip fracture and surgery, blood transfusions, demography, number of medications taken before admission, cognitive impairment, and functionality). Anesthetic medication was limited to a protocol for spinal anesthesia and a protocol for general anesthesia. Cognitive functioning was scored by medical history and the Informant Questionnaire on Cognitive Decline. This questionnaire assesses the possible presence of global cognitive decline before admission, based on the response of an informant who had known the patient for at least 10 years. 13 The informant was asked to recollect the situation 2 weeks before the hip fracture and to compare it with the situation 10 years before. Patients with a mean score of 3.9 or more were considered to have preexistent cognitive impairment. 14 To measure functionality we asked the informant to complete the 15-item Katz Index of Independence in Activities of Daily Living scale based on the situation 2 weeks before the hip fracture. 15 The maximum score of 15 indicates severe functional impairment.
For all patients several blood samples, serum, and ethylenediamine tetra-acetic acid (EDTA) plasma were collected under similar strict conditions around 11:00 a.m. Blood samples were taken on average 2 days after surgery for patients with and without delirium. For the patients with delirium we used a sample taken during the delirious episode and an additional blood sample on average six days after the episode. Blood was collected in tubes both with and without anticoagulants and kept on ice. Serum was obtained after allowing the blood samples to clot at room temperature for 30 minutes. After centrifugation for 15 minutes at 4000 RPM (1780 g ) at 4°C, the aliquots were stored at −80°C.
Proteomic Analysis
Protein profiles of serum and EDTA plasma samples were generated using anionic surfaces of CM10 ProteinChip Arrays and cationic surfaces of Q10 ProteinChip Arrays (Ciphergen Biosystems Inc., Fremont, Calif.).
Experiments were blinded for sample type, and samples were applied in random order. ProteinChip Arrays were analyzed using a PBSIIc ProteinChip Reader (Ciphergen Biosystems Inc., Fremont, Calif.), a linear laser desorption/ionization time-of-flight mass spectrometer equipped with time-lag focusing. This resulted in mass spectra composed of mass to charge ratios (m/z values) and intensities of the desorbed (poly)peptide ions. All spectra were acquired in positive-ion mode.
Preprocessing of Seldi-TOF MS Data for Further Analysis
Data were preprocessed using Ciphergen ProteinChip Software 3.1.1. Spectra were calibrated against a mixture of known peptides. Spectra from validation group samples were calibrated with testing group calibration coefficients. Further preprocesssing steps were spot-to-spot calibration, baseline subtraction, and normalization to the average total ion current. A detailed description of preprocessing steps can be found in the Supplementary Information. Peaks in the mass range from 1.7 to 50 kDa were detected using Biomarker Wizard™. Resulting peak intensities were log2-transformed in order to stabilize their variance.
Data Analysis
We tested for differences in demographic and clinical characteristics in patients with and without delirium using t tests, Mann-Whitney tests, and chi-square tests. A two-tailed p value of less than 0.05 was considered statistically significant.
We compared profiles to identify peaks differentially expressed between both groups and corrected them for chip effect, type of anesthesia, and whether patients received a blood transfusion. Between-group comparisons were done using a moderated t test. 16 This test is similar to a standard t test for each peak except that the standard errors are moderated across peaks to ensure more stable inference for each peak. The resulting p values were corrected for multiple testing using the Benjamini-Hochberg False Discovery Rate (FDR) adjustment. 17 Tests were considered to be significant if p<0.05 in all cases.
RESULTS
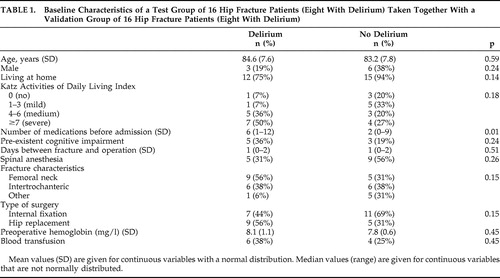
During the inclusion period, 149 patients ages 65 years or older were admitted for acute hip surgery, of which 74 patients gave informed consent for participation in this study with multiple blood sampling. Of these 74 patients, 35 (47%) experienced delirium during admission. For the current study, a group of 16 patients with and 16 patients without postoperative delirium was selected. For the selected patients with delirium the mean age was 85 years old (SD=7.6) and 19% were male, while for the patients without delirium the mean age was 83 years (SD=7.8) and 38% were male. The number of medications taken before hospital admission was significantly higher in patients with delirium (z=−2.5, p=0.01) ( Table 1 ).
 |
After correction for multiple testing, discriminating peaks were found in overall testing in EDTA plasma and serum applied to the CM10 chip and EDTA plasma applied to the Q10 chip ( Table 2 ). The most discriminating peak of 15.9 kDa was found in EDTA plasma applied to the CM10 chip in samples taken during delirium compared to samples of nondelirious patients (t=−4.1, df=21, p=0.002 [FDR]). The protein profiles of eight patients during and after delirium were compared in a paired analysis: we found a discriminating peak (5.8 kDa) with serum applied to CM10 ProteinChip Array (t=3.7, df=21, p=0.043 [FDR]). No significant differences in protein profile were found with serum applied to Q10 ProteinChip Arrays. For all four combinations of chip type and kind of blood sample, no significant interaction effect of ProteinChip Array and delirium group, type of anesthesia and delirium-group or “preexistent cognitive impairment” and delirium-group was found. Moreover, after stratifying for having had blood transfusions or not, similar results were found (data not shown).
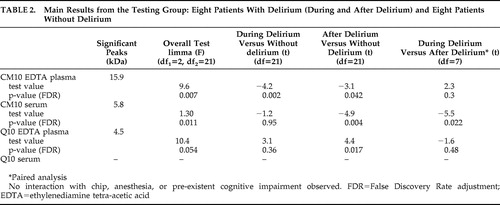 |
Since the largest and most interesting difference was found in the profiles of patients with and without delirium obtained with EDTA plasma applied to CM10 ProteinChip Arrays, we decided to concentrate on this finding (i.e., to validate it). The intensity of the discriminating peaks observed with EDTA plasma of the testing group using CM10 ProteinChip Arrays was also determined in the validation group. The intensity of the 15.9 kDa peak was again significantly different in overall testing (F=2.7, df 1 =2, df 2 =21, p=0.05). The intensity of this peak was also significantly higher during delirium versus patients without delirium (t=2.3, df=21, p=0.03) and after delirium versus patients without delirium (t=2.1, df=21, p=0,041). No significant difference was found for this peak comparing the same patients during and after delirium in paired analysis (t=−0.15, df=21, p=0.88).
Since the results of the testing group were validated in the second group, we considered the two groups to be one study group consisting of 16 delirious patients and 16 patients without delirium for the subsequent analyses. A total of 35 peaks were detected when EDTA plasma was applied to CM10 ProteinChip Arrays. More power led to more significant results; three peaks were significantly different in the overall testing after correction for multiple testing: 15.9 kDa (F=9.19, df 1 =2, df 2 =45, p=0.007 [FDR]), 16.0 kDa (F=10.5, df 1 =2, df 2 =45, p=0.005 [FDR]), and 7.97 kDa (F=8.2, df 1 =2, df 2 =45, p=0.01 [FDR]). We found no significant interaction with chip effect, and adjustment for type of anesthesia or stratification for blood transfusion did not alter our findings. The three peaks with masses of 15.9, 16.0, and 7.97 kDa correlated significantly with each other, with correlation coefficients of 0.91, 0.91 and 0.95, respectively (p<0.001). Figure 1 shows representative SELDI-TOF mass spectra of EDTA plasma samples of a patient during and after delirium and a patient without delirium. In the best spectra, a difference of about 162 Da between the 15.9 and the 16.0 kDa peaks could be measured, which is strongly indicative of glycosylation. The 7.97 kDa peak results from a doubly charged ion of the same protein as detected at 15.9 kDa (singly charged). This could be deduced from the absolute mass values as well as from the correlation in relative intensities of the two peaks (with the 7.97 peak intensities being only a fraction of the 15.9 peak intensities). Based on the observed mass and the efficient glycosylation we deduced that the peak represented hemoglobin-β. The spectra obtained in this mass range closely resemble those obtained previously, including their efficient glycosylation (e.g., with hemoglobin from plasma). 18 , 19 In order to confirm our assumption that the observed peaks represent hemoglobin-β, we attempted to deplete the plasma samples with the aid of antihemoglobin-β antibodies to show that this resulted in the specific disappearance of all three peaks. However, the antibodies did not precipitate efficiently enough for a conclusive experiment in this regard. Mature hemoglobin levels were compared between patients with and without delirium. Hemoglobin levels of delirious patients 2 days after surgery (median 6.7 mg/liter) were comparable to patients without delirium (median 6.1 mg/liter) (z=−0.6, p=0.56). Moreover, there was no correlation between hemoglobin and the total peaks (p=0.24).
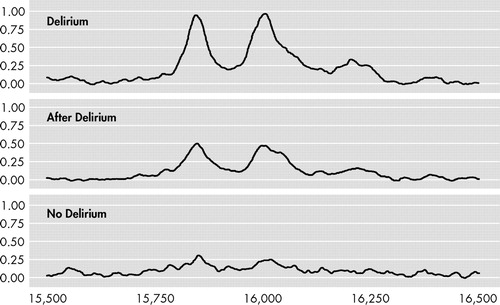
SELDI-TOF=surface-enhanced laser desorption ionization (SELDI) using time-of-flight (TOF) mass spectrometry. Ethylenediamine tetra-acetic acid (EDTA) plasma samples of a patient during and after delirium and a patient without delirium were applied to CM10 ProteinChip Arrays. Representative spectra are shown. Mass ranges=15,500 to 16,500 m/z.
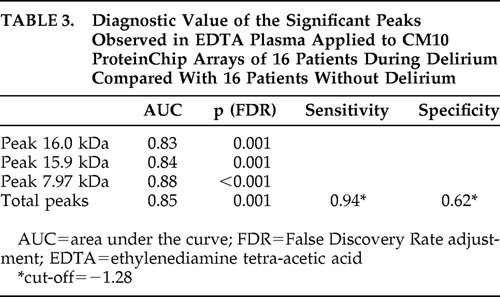
Figure 2 shows the log2-transformed sum of the peak intensities of the combination of 7.97, 15.9, and 16.0 kDa peaks of 16 patients during delirium and after delirium and 16 patients without delirium in EDTA plasma applied to CM10 ProteinChip Arrays. Based on the total intensity of the 15.9 kDa and related peaks, we calculated the diagnostic potential of this candidate bio-marker ( Table 3 ). Diagnostic accuracy expressed as area under the curve showed a good diagnostic value of the three different representatives and the combined value of the significant peaks for all 16 patients during delirium versus 16 patients without delirium, with areas under the curve above 0.83.
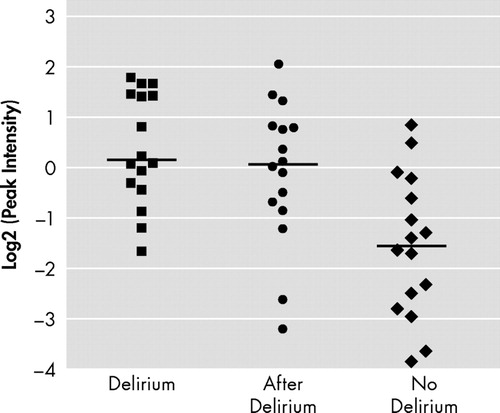
EDTA=Ethylenediamine tetra-acetic acid
 |
DISCUSSION
In this study we found a significantly different protein profile in elderly hip fracture patients experiencing postoperative delirium as compared to patients who underwent the same operation, but did not become delirious. Differences in profiles were based on three discriminating peaks, which we identified as hemoglobin-β, its glycosylated form, and the doubly charged ion of the protein.
In our study population the somatic trigger (a hip fracture combined with surgery) leading to delirium was equal for all patients, and the fraction of patients with delirium (47%) was in line with the expectation based on the literature (16%–62%). 2 Although both groups did not significantly differ in percentage of cognitive impairment, this important risk factor for delirium was not completely similar between both groups. 20 However it is unlikely that the observed differences in SELDI patterns are caused by the preexisting cognitive impairment since hemoglobin-β has never been detected in proteomics research of cognitive impairment. 9
To our knowledge, proteomic research of other known risk factors of delirium has not been performed. Although we do not completely understand the role of elevated hemoglobin-β in patients with delirium, a relation between delirium and low hemoglobin has been described. 21 However, in our study no correlation was found between the intensity of the total hemoglobin-β peak and hemoglobin blood levels. Moreover, hemoglobin levels in patients with and without delirium were comparable. Also, the hemoglobin-β did not originate from the packed cells for transfusion given that after the exclusion of all patients with a blood transfusion, the SELDI pattern still showed significant differences. Only patients with delirium were treated with haloperidol, so hemoglobin-β differences could in theory be related to this treatment and not to the underlying disorder. Haloperidol attaches to the D2 dopamine receptors in the brain, so a direct pathophysiological link with hemoglobin-β levels is hard to envisage.
We are convinced that the peaks indeed represent (different forms of) hemoglobin-β due to the mass value observed, its efficient glycosylation, the characteristics of hemoglobin subunits, and the close similarities with published msec spectra obtained with hemoglobin-β. 22 This identification, however, is not absolutely certain because it is only based on the spectrum as such. Collision-induced fragmentation followed by msec/msec sequencing is not an option with proteins of this size, so we tried to obtain independent confirmation of our identification with the aid of an immunodepletion approach. However, the β-specific antibodies available did not allow us to get detectable levels of precipitation. Hemoglobin A, the predominant hemoglobin in adults, consists of two α chains and two β chains. Although more studies identified only hemoglobin-β, 23 – 25 one would expect comparable intensities for hemoglobin-α (with an estimated mass of 15.1 kDa) and hemoglobin-β. Possible reasons for the absence of a peak representing hemoglobin-α could be the breakdown of hemoglobin-α during sample preparation and/or inefficient ionization.
This SELDI analysis may not have revealed all differences in protein profiles, since there are some limitations of this analysis. First, only a selection of ProteinChip Arrays were used and mainly molecular masses below 20 kDa were detected. In addition, the identification of other differences between both groups could be hampered by the small sample size of the study population, the relatively low amount present of possible differences in protein expression and their ionization efficiency. In general, poor reproducibility of proteomics due to the combination of detection sensitivity, large impact of impurities, and lack of methodological rigor is one of the difficulties that must be overcome in order for proteomic technology to become a robust tool. Finally, as delirium is caused by cerebral processes, it could have been more informative to sample CSF or even brain tissue for identification of proteins involved in the pathophysiology. However, besides the ethical problems of pursuing this approach in confused elderly patients, a possible identified biomarker found in CSF would have very limited value in daily clinical practice.
The first hypothesis of the pathophysiology of delirium showed that delirium is a syndrome of general cerebral insufficiency. 26 Patients with indicators of oxidative dysfunction developed delirium more frequently, and this was not linked to illness severity. 27 , 28 During hypoxemia nitric oxide is responsible for the vasodilatation to enhance oxygen transport after bounding to the cysteine in the hemoglobin-β. 29 In the CNS, nitric oxide has an array of functions, such as the regulation of synaptic plasticity, the sleep-wake cycle, and hormone secretion. 30 Hemoglobin-β has also recently been discovered as a biomarker for early diagnosis of different types of cancer. 23 – 25 This was ascribed to increased susceptibility of erythrocyte membrane to hemolysis due to biochemical modifications in women with ovarian cancer. 23 In our study, it is improbable that patients with delirium experienced more hemolysis than patients without delirium. If this biomarker would reflect common stress factors, it could explain the higher intensity in our hip fracture patients with delirium as compared to patients without delirium, as patients experience delirium as a stressful event. 31
The sensitivity of 0.94 of the three peaks together in diagnosing delirium ( Table 3 ) offers potential as a possible biomarker for the diagnosis of delirium, since delirium is frequently missed. 2 This sensitivity is even higher than that for a screening instrument such as the Delirium Observation Screening Scale. 12 For this purpose a rapid assay measuring hemoglobin-β concentration should be developed. However, future studies with different design are needed to confirm the association between hemoglobin-β and delirium and to elucidate the exact role of hemoglobin-β in its pathophysiological process.
1. Bitsch M, Foss N, Kristensen B, et al: Pathogenesis of and management strategies for postoperative delirium after hip fracture: a review. Acta Orthop Scand 2004; 75:378–389Google Scholar
2. Inouye SK: The dilemma of delirium: clinical and research controversies regarding diagnosis and evaluation of delirium in hospitalized elderly medical patients. Am J Med 1994; 97:278–288Google Scholar
3. Francis J, Kapoor WN: Prognosis after hospital discharge of older medical patients with delirium. J Am Geriatr Soc 1992; 40:601–606Google Scholar
4. Inouye SK: Delirium in older persons. N Engl J Med 2006; 354:1157–1165Google Scholar
5. Flacker JM, Lipsitz LA: Neural mechanisms of delirium: current hypotheses and evolving concepts. J Gerontol A Biol Sci Med Sci 1999; 54:B239–B246Google Scholar
6. Marcantonio ER, Rudolph JL, Culley D, et al: Serum biomarkers for delirium. J Gerontol A Biol Sci Med Sci 2006; 61:1281–1286Google Scholar
7. Xiao Z, Prieto D, Conrads TP, et al: Proteomic patterns: their potential for disease diagnosis. Mol Cell Endocrinol 2005; 230:95–106Google Scholar
8. Geng T, Seitz PK, Thomas ML, et al: Use of surface enhanced laser desorption/ionization-time of flight mass spectrometry (SELDI-TOF MS) to study protein expression in a rat model of cocaine withdrawal. J Neurosci Methods 2006; 158:1–12Google Scholar
9. Lewczuk P, Wiltfang J: Neurochemical dementia diagnostics: state of the art and research perspectives. Proteomics 2008; 8:1292–1301Google Scholar
10. Inouye SK, van Dyck CH, Alessi CA, et al: Clarifying confusion: the confusion assessment method: a new method for detection of delirium. Ann Intern Med 1990; 113:941–948Google Scholar
11. Wei LA, Fearing MA, Sternberg EJ, et al: The Confusion Assessment Method: a systematic review of current usage. J Am Geriatr Soc 2008; 56:823–830Google Scholar
12. Schuurmans MJ, Shortridge-Baggett LM, Duursma SA: The Delirium Observation Screening Scale: a screening instrument for delirium. Res Theory Nurs Pract 2003; 17:31–50Google Scholar
13. Jorm AF: A short form of the Informant Questionnaire on Cognitive Decline in the Elderly (IQCODE): development and cross-validation. Psychol Med 1994; 24:145–153Google Scholar
14. de Jonghe JF: Differentiating between demented and psychiatric patients with the Dutch version of the IQCODE. Int J Geriatr Psychiatry 1997; 12:462–465Google Scholar
15. Weinberger M, Samsa GP, Schmader K et al: Comparing proxy and patients’ perceptions of patients’ functional status: results from an outpatient geriatric clinic. J Am Geriatr Soc 1992; 40:585–588Google Scholar
16. Smyth GK: Linear models and empirical Bayes methods for assessing differential expression in microarray experiments. Stat Appl Genet Mol Biol 2004; 3:3Google Scholar
17. Benjamini Y, Hochberg Y: Controlling the false discovery rate: a practical and powerful approach to multiple testing. Journal of the Royal Statistical Society Series B 2007; 57:289–300Google Scholar
18. Koncarevic S, Bogumil R, Becker K: SELDI-TOF-MS analysis of chloroquine resistant and sensitive plasmodium falciparum strains. Proteomics 2007; 7:711–721Google Scholar
19. Lapolla A, Fedele D, Plebani M, et al: Evaluation of glycated globins by matrix-assisted laser desorption/ionization mass spectrometry. Clin Chem 1999; 45:288–290Google Scholar
20. Korevaar JC, van Munster BC, de Rooij SE: Risk factors for delirium in acutely admitted elderly patients: a prospective cohort study. BMC Geriatr 2005; 5:6Google Scholar
21. Kawaguchi Y, Kanamori M, Ishihara H, et al: Postoperative delirium in spine surgery. Spine J 2006; 6:164–169Google Scholar
22. Lapolla A, Fedele D, Plebani M, et al: Evaluation of glycated globins by matrix-assisted laser desorption/ionization mass spectrometry. Clin Chem 1999; 45:288–290Google Scholar
23. Kozak KR, Su F, Whitelegge JP, et al: Characterization of serum biomarkers for detection of early stage ovarian cancer. Proteomics 2005; 5:4589–4596Google Scholar
24. Roesch-Ely M, Nees M, Karsai S, et al: Proteomic analysis reveals successive aberrations in protein expression from healthy mucosa to invasive head and neck cancer. Oncogene 2007; 26:54–64Google Scholar
25. Woong-Shick A, Sung-Pil P, Su-Mi B, et al: Identification of hemoglobin-alpha and -beta subunits as potential serum bio-markers for the diagnosis and prognosis of ovarian cancer. Cancer Sci 2005; 96:197–201Google Scholar
26. Engel GL, Romano J: Delirium, a syndrome of cerebral insufficiency, 1959. J Neuropsychiatry Clin Neurosci 2004; 16:526–538Google Scholar
27. Seaman JS, Schillerstrom J, Carroll D, et al: Impaired oxidative metabolism precipitates delirium: a study of 101 ICU patients. Psychosomatics 2006; 47:56–61Google Scholar
28. Nollert G, Mohnle P, Tassani-Prell P, et al: Postoperative neuropsychological dysfunction and cerebral oxygenation during cardiac surgery. Thorac Cardiovasc Surg 1995; 43:260–264Google Scholar
29. Kim-Shapiro DB, Schechter AN, Gladwin MT: Unraveling the reactions of nitric oxide, nitrite, and hemoglobin in physiology and therapeutics. Arterioscler Thromb Vasc Biol 2006; 26:697–705Google Scholar
30. Calabrese V, Mancuso C, Calvani M, et al: Nitric oxide in the central nervous system: neuroprotection versus neurotoxicity. Nat Rev Neurosci 2007; 8:766–775Google Scholar
31. O’Malley G, Leonard M, Meagher D, et al: The delirium experience: a review. J Psychosom Res 2008; 65:223–228Google Scholar