Predictors of Performance on the MMSE and the DRS-2 Among American Indian Elders
This constellation of factors suggests that American Indians may be at considerable risk for the development of cognitive disorders associated with aging. As the population of older American Indians continues to increase, so does the need to develop methods by which to identify cognitive impairment and its optimal assessment in this population.
American Indians, Dementia Prevalence, and Cognitive Testing
A handful of small, non-population-based, empirical studies have examined dementia among American Indian and Canadian First Nations people. 3 – 5 , 18 – 24 Overall, most studies of cognitive test performance to date typically have shown little difference between Native and non-Native samples, although most of these investigations have been conducted with relatively acculturated tribes, 3 – 5 , 22 , 25 some of whom also have relatively low levels of genetic American Indian heritage. 21 This is important because acculturation status may affect elders’ performance on cognitive tests. 26
An earlier investigation by this research team 27 examined older American Indians’ scores on the Mini-Mental State Examination (MMSE) 28 and the Mattis Dementia Rating Scale—Second Edition (DRS-2) 29 , 30 compared with age- and education-adjusted norms developed with 18,000 community-dwelling participants (age 18–85+ years) in the NIMH Epidemiological Catchment Area Program survey. 31 For the purpose of that investigation, possible cognitive impairment was defined as performance greater than 2 standard deviations below the mean of each participant’s corresponding age- and education-matched cohort. Utilizing this criterion, 10.9% of the sample had possible cognitive impairment. For the DRS-2, no large-scale, population-representative norms were available, so the most demographically comparable published norms available were employed. These were age-adjusted norms derived from 36 European American and 53 African American urban norms 32 with fairly similar age and education levels (mean age=74 years [SD=5.9], range=62–95; mean education=10.5 years [SD=3.6]). 32 Again employing the criterion of performance greater than two standard deviations below the mean of each participant’s DRS-2 score to an age-matched cohort to define possible impairment, 27.4% of elders had possible cognitive impairment. Gender was significantly associated with performance on both tests and education with the DRS-2, the latter finding accounted for by the lack of education adjustments in the Vangel & Lichtenberg 1995 norms. The article concluded that the examination of the possible effects of ethnicity, socioeconomic status, type/character of education, and language on MMSE and DRS-2 performance is essential in understanding cognitive test performance and developing culturally appropriate norms. 27
Factors Associated With Performance on the MMSE and DRS-2
A number of factors are related to performance on cognitive measures. Age, 32 , 33 education, 32 , 34 , 35 and language 17 are well-known contributors to differential performance on such measures, whether directly, in combination, or reflecting the influence of other variables for which age, education, and language serve as proxies. The effects of ethnicity/race also contribute to performance differences on cognitive measures, although the extent of their contribution is variable. 36 Socioeconomic status has been found to affect performance on the MMSE. 37 Ethnic minorities generally score lower on many cognitive tests, even after correcting for years of education and socioeconomic status. 38 While no definitive explanations can be found for these disparities, possible contributors include lower quality educational experiences 38 and associated socioeconomic deprivations (e.g., poor nutrition, inadequate health care, etc.) that contribute to poorer cognitive health. 36
With this in mind, our work examines performance on the MMSE and the DRS-2 in a community-dwelling American Indian sample. The goal was to investigate the predictors of differential performance on these assessment instruments in this culturally unique population, since it is likely that performance reflects factors other than neurocognitive disease alone. It was hypothesized that several variables, including health factors (e.g., alcohol problems, stroke, head injuries); language proficiency (both English and tribal language); education; boarding school history; indicators of economic need; ethnic identity; age; gender; and blood quantum would be predictive of performance on the two cognitive measures.
METHODS
The setting for data collection was a northern plains reservation; in order to protect tribal confidentiality, the name of the tribe participating in this study will not be specified. 39 This study was approved by the tribe’s government, the Indian Health Service, and the Colorado Multiple Institutional Review Board. All participants signed approved consent forms.
Participants
One hundred forty American Indians 60 years old or older were recruited from 10 Administration on Aging-funded senior nutrition program sites throughout the reservation and several nearby off-reservation trust areas; 137 participants completed the MMSE and 129 of these participants completed the DRS-2.
Criteria for utilizing the senior nutrition program included being age 60 or older, American Indian, and residing within a five-mile-radius of a senior nutrition center. The program served the majority (83%) of the reservation’s older American Indians, excluding those in very remote areas or those who were uninterested. Ninety-three percent of elders invited to participate in the interviews did so.
Procedures
Cognitive Assessments
The study commenced with focus groups conducted on the reservation with elders and senior nutrition program personnel to identify potentially problematic items on the MMSE and DRS-2 with respect to comprehensibility and cultural relevance. When a problematic item was identified, minimal modifications were made (e.g., “room” was substituted for “floor” in the Orientation section of the MMSE since few buildings on the reservation have more than one story). In such cases, retention of the original wording would likely have led to confusion and thus incorrect responses.
This process was followed by administration of the MMSE and DRS-2. The measures were administered in English by trained research assistants who were tribal members. The MMSE was administered using the method described by Folstein et al. 28 The version of the DRS-2 used in this study was the DRS-2™, and the administrative procedures outlined in the manual for this measure were employed. 29 In light of our prior findings identifying problems with the application of currently available norms to the interpretation of MMSE and DRS-2 in this population, 27 the present study used only raw scores on these measures for all statistical analyses.
Demographic, Health, Ethnicity, and Language Assessments
These measures were adapted from those used in the American Indian Service Utilization and Psychiatric Epidemiology Risk and Protective Factors Project (AI-SUPERPFP). 40 The demographic variables included age and gender. The health variables included a self-reported history of diabetes, heart disease, “bad headaches/migraines,” stroke, head injuries/concussion, and “alcohol problems.” The two language variables asked participants, “How well do you speak your Native language?” (0=I do not speak my tribal language, 1=I speak it a little, but not very well, 2=I speak it moderately well, 3=I speak my tribal language very well) and “How well do you speak English?” (0=I do not speak English, 1=I speak it a little, but not very well, 2=I speak it moderately well, 3=I speak English very well). Participants were asked four questions regarding their ethnic identity: how important it was to them that they maintained their tribal identity and their tribe’s values and practices, how important it was to them that they maintained a white identity and white values and practices, to rank the extent to which they followed the tribal way of life, and to rank the extent to which they followed the non-Indian way of life (0=not at all, 1=a little, 2=somewhat, 3=very much).
Two questions focused on education. The first variable differentiated between completed 12 or more years of education and completed fewer than 12 years . The second measure included whether or not the participant reported a history of having attended boarding school . The term “boarding school” refers to residential schools intended to provide a basic education as well as to assimilate American Indian students into American society and to facilitate conversion to Christianity. 41 Nine variables measured participants’ subjective impressions of their economic need: receipt of Temporary Assistance for Needy Families (TANF), General Assistance, or other welfare benefits; Supplemental Security Income (i.e., a federal program that provides cash for basic needs for impoverished aged, blind, and disabled people); 42 Social Security supplement/retirement benefits; or food stamps/an electronic benefits transfer card. The second set of variables measuring economic need asked participants to rank how often they had the following: “enough food to eat,” “the health care you need,” “enough clothes,” “a decent place to live,” and “relatives asking you for money” (0=never, 1=almost never, 2=sometimes, 3=often, 4=almost always).
For self-reported American Indian ancestry, the participant was asked to state his or her blood quantum . On this reservation, as in many American Indian communities, 43 a culturally recognized distinction is made between “full bloods” and so-called “mixed bloods,” but the latter category is not universally associated with any specific blood quantum. Given the myriad possibilities for blood quantum ratios (e.g., one-fourth, one-half, three-fourths, etc.), a decision was made to draw the cutoff at greater than three-fourths. Approximately 55% of the sample reported a blood quantum in this range.
Analyses
Statistical analysis was performed using SPSS version 17.0 44 and mainly included descriptive statistics, as well as t tests and correlations for continuous data. Univariate regression models determined the strength of individual variables’ associations, including health factors, language fluency, ethnic identity, education, indicators of economic need, age, gender, and blood quantum, with raw MMSE and DRS-2 scale scores. Using backward elimination, multivariate regression models were run to determine the final models for raw MMSE and DRS-2 scale score prediction.
RESULTS
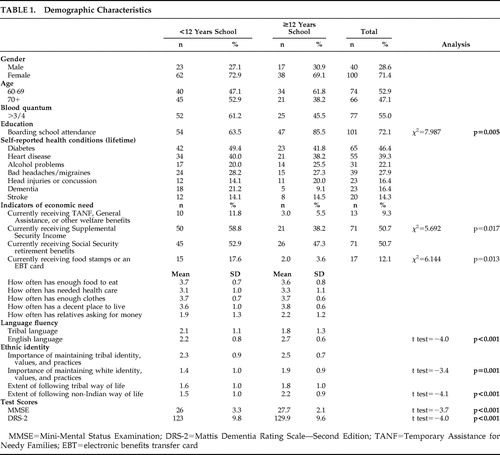
MMSE scores ranged from 16 to 30, while DRS-2 scores ranged from 93 to 143. Approximately 93% of both male and female participants had MMSE scores between 21 and 30. Sample characteristics comparing those with less than or equal to and more than 12 years of education are summarized in Table 1 .
 |
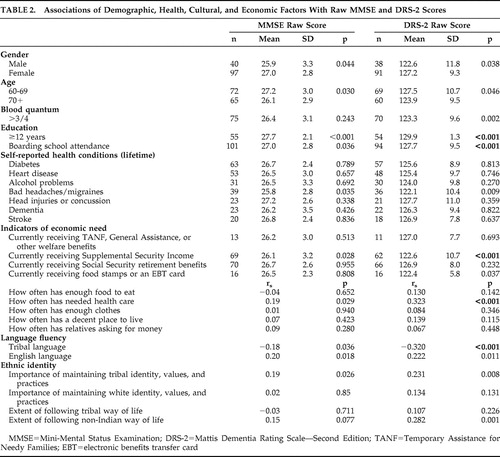
Results demonstrating variables that were individually associated with higher MMSE and DRS-2 scores using t tests and correlations are presented in Table 2 .
 |
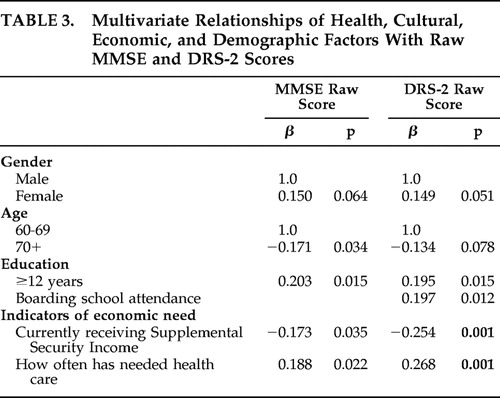
In a multivariate model for the MMSE (after controlling for gender and age), being younger, reporting 12 or more years of education, not receiving Supplemental Security Income, and often having needed health care predicted higher MMSE scores ( Table 3 ). In the DRS-2 multivariate model (after controlling for gender and age), reporting 12 or more years of education, having attended boarding school, not receiving Supplemental Security Income, and often having needed health care predicted higher scores. No significant interactions were identified.
 |
As several culture-related variables were individually associated with higher MMSE and DRS-2 scores but were not significant in the multivariate model, we ran additional analyses to look at the interrelationships of the independent variables to assist in explaining these findings. English proficiency’s univariate relationship to higher MMSE and DRS-2 scores was explained by 12 or more years of school (mean English proficiency =2.71 [SD=0.59] for those with 12 or more years of school compared with mean=2.21 [SD=0.78] for those with 11 or fewer years; t test=−4.23, p<0.001). English proficiency’s univariate relationship to higher DRS-2 scores was explained by a history of attending boarding school (mean English proficiency =2.56 [SD=0.65] among those attending boarding school compared with mean=2.00 [SD=0.86] for those who did not; t test=−3.71, p<0.001). The extent of following the non-Indian way of life’s univariate relationship to higher MMSE and DRS-2 scores was explained by 12 or more years of education (mean non-Indian way of life =2.20 [SD=0.87] for those with 12 or more years of education compared with mean=1.54 [SD=1.00] for those with 11 or fewer years; t test=−4.11, p<0.001). Finally, reporting less than or equal to three-fourths blood quantum’s univariate relationship to higher DRS-2 scores was explained by often having needed health care (mean having needed health care =3.37 [SD=0.86] for those with less than or equal to three-fourths blood quantum compared with mean=3.00 [SD=1.12] for those with greater than three-fourths blood quantum; t test=2.11, p=0.036).
DISCUSSION
In general, education and indicators of economic need predicted higher scores on both the MMSE and DRS-2 in this sample of American Indian elders. Having more formal education was related to better performance on both the MMSE and the DRS-2; in addition, younger age was related to better performance on the MMSE. Age and education have been found to be associated with better performance in previous studies of these measures in other populations. 31 , 32 , 37 , 45 – 47 Additionally, boarding school attendance was related to higher scores on the DRS-2. Since to our knowledge, this is the first study to examine this measure in an American Indian group, it is not clear why those who attended boarding school performed better on the DRS-2, although it is possible that the acculturative aspect of the boarding school experience may have played a role in some way, perhaps by providing a heuristic framework that made it easier for boarding schools attendees to complete measure-specific assessment tasks that reflected a Western, biomedical conceptualization of cognition.
It is worth noting the complex relationship between performance on the cognitive tests, the educational variables, English proficiency, adherence to a non-Indian way of life, and blood quantum. In particular, we found an association between English proficiency and MMSE and DRS-2 scores, although both of these relationships were explained by the 12 or more years of education variable. Those who reported 12 or more years of school were more likely to report greater English proficiency. In addition, we found an association between English language and the DRS-2 scores, which was explained by a history of boarding school attendance. Those who reported a history of boarding school were more likely to report greater English proficiency. It is not clear why this finding occurred with the DRS-2 score only. We found an association between the extent of following the non-Indian way of life and MMSE and DRS-2 scores—again both of these relationships were explained by the 12 or more years of education variable. Finally, we found an association with blood quantum and the DRS-2 score, which was explained by often having needed health care.
Those who reported more frequently receiving needed health care had better scores on both the MMSE and DRS-2. Here it is important to note that rudimentary health care through the Indian Health Service is supposed to be universally available to American Indians on this reservation, although in reality the system is chronically underfunded and struggles to keep up with demand. 48 It follows that those who were able to negotiate their way through this system and receive the care they needed may have been advantaged in other ways as well, including better cognitive health and/or test-taking ability.
The relationship between nonreceipt of Supplemental Security Income and higher MMSE and DRS-2 scores is not surprising given the level of impoverishment of recipients of these benefits. For instance, an individual is prohibited from having more than $2,000 in resources (e.g., cash, bank accounts, land, life insurance, personal property, and vehicle) in order to qualify for the program. 42 Supplemental Security Income recipients may therefore be disadvantaged in a number of ways that might impact their cognitive functioning and/or test-taking aptitude or ability, including early nutrition, educational opportunities, and parental involvement in early education efforts.
Of the seven health variables examined here, bad headaches/migraines was the only health-related variable that was significant at the univariate level. However, this variable dropped out of the final multivariate regression models. That health problems emerged as nonsignificant may reflect the inadequacies of a self-report method of ascertaining their presence/absence. Further, the lack of significance of gender here is striking and is in contrast to our earlier work which used normative data rather than raw scores; 27 however, this finding is consistent with that of others. 31 , 32 , 49 Likewise, we did not find an effect of blood quantum in this study, which is consistent with some studies’ findings of the nonsignificance of race on the DRS-2 in samples of whites and African Americans. 32 , 50
This study has several limitations, one of the most obvious being its focus on one tribe and its use of a purposive sample drawn from senior nutrition program sites. Although these nutrition program sites are believed by many community members to be more universally utilized in reservation settings than comparable programs that serve the general population, the possibility exists that unique characteristics of this sample limit generalizations to the larger American Indian population. Also, socioeconomic status was not assessed comprehensively but was instead evaluated via indicators of economic need. In addition, we were unable to explore possible relationships between gender and ethnic identity, language fluency, and self-reported health conditions. While potentially interesting, such additional analyses are beyond the scope of this study yet are worthy of future investigation. Lastly, this research did not include a clinical neuropsychiatric examination as a source of external validation of neurological (including cognitive), psychiatric, and general health status; accordingly, potentially informative clinical characteristics of study participants may be opaque to detection in the present study and hence not entered into the regression models predicting MMSE and DRS-2 scores in this sample.
Despite these limitations, the present findings suggest that educational factors and economic resources are related to performance on the MMSE and DRS-2 among older American Indians. Such factors must be considered when selecting these measures, and by extension other assessments of cognitive performance, for use and interpretation in these populations.
1. US Department of Health and Human Services: Trends in Indian Health 1998–1999. Rockville, Md, Department of Health and Human Services, 2001Google Scholar
2. Jervis LL, Manson SM: American Indians/Alaska Natives and dementia. Alzheimer Dis Assoc Disord 2002; 16(suppl 2):S89–S95Google Scholar
3. Ferarro FR, Bercier B: Boston Naming Test performance in a sample of Native American elderly adults. Clin Gerontologist 1996; 17:58–60Google Scholar
4. Ferarro FR, Bercier BJ, Holm J, et al: Preliminary normative data from a brief neuropsychological test battery in a sample of Native American elderly, in Minority and Cross-Cultural Aspects of Neuropsychological Assessment. Edited by Ferarro FR. Lisse, Netherlands, Swets & Zeitlinger, 2002, pp 227–240Google Scholar
5. Whyte SR, Cullum CM, Hynan LS, et al: Performance of elderly Native Americans and Caucasians on the Cerad Neuropsychological Battery. Alzheimer Dis Assoc Disord 2005; 19:74–78Google Scholar
6. Spicer P, Beals J, Croy CD, et al: The prevalence of DSM-III-R alcohol dependence in two American Indian populations. Alcohol Clin Exp Res 2003; 27:1785–1797Google Scholar
7. Beals J, Spicer P, Mitchell CM, et al: Racial disparities in alcohol use: comparison of two American Indian reservation populations with national data. Am J Public Health 2003; 93:1683–1685Google Scholar
8. Harris CR, Albaugh B, Goldman D, et al: Neurocognitive impairment due to chronic alcohol consumption in an American Indian community. J Stud Alcohol 2003; 64:458–466Google Scholar
9. Acton KJ, Burrows NR, Geiss LS, et al: Diabetes prevalence among American Indians and Alaska natives and the overall population–United States, 1994–2002. MMWR Morb Mortal Wkly Rep 2003; 52:702–704Google Scholar
10. Centers for Disease Control: Diabetes prevalence among American Indians and Alaska Natives and the overall population–United States, 1994–2002. MMWR Morb Mortal Wkly Rep 2003; 52:702–704Google Scholar
11. Langlois JA, Kegler SR, Butler JA, et al: Traumatic brain injury-related hospital discharges: results from a 14-state surveillance system, 1997. MMWR Surveill Summ 2003; 52:1–20Google Scholar
12. Nelson LA, Rhoades DA, Noonan C, et al: Traumatic brain injury and mental health among two American Indian populations. J Head Trauma Rehabil 2007; 22:105–112Google Scholar
13. Kivipelto M, Ngandu T, Fratigilioni L, et al: Obesity and vascular risk factors at midlife and the risk of dementia and Alzheimer’s disease. Arch Neurol 2005; 62:1556–1560Google Scholar
14. Denny CH, Holtzman D, Cobb N: Surveillance for health behaviors of American Indians and Alaska natives: findings from the behavioral risk factor surveillance system 1997–2000. MMWR Surveill Summ 2003; 52(SS07):1–13Google Scholar
15. US Census Bureau: The American Indian and Alaska Native Population. Census 2000. Brief, 2002Google Scholar
16. Evans GW, Kantrowitz E: Socioeconomic status and health: the potential role of environmental risk exposure. Annu Rev Public Health 2002; 23:303–331Google Scholar
17. Harris JG, Echemendia R, Ardila A, et al: Cross-cultural cognitive and neuropsychological assessment, in Handbook of Psychoeducational Assessment: Ability, Achievement, and Behavior in Children. Edited by Saklofske DH, Janzen HL. San Diego, Academic Press, 2001, pp 391–414Google Scholar
18. Henderson JN: Cultural construction of disease: a “supernormal” construct of dementia in an American Indian tribe. J Cross Cult Gerontol 2002; 17:197–212Google Scholar
19. Henderson JN, Crook R, Crook J, et al: Apolipoprotein E4 and tau allele frequencies among Choctaw Indians. Neurosci Lett 2002; 324:77–79Google Scholar
20. Rosenberg RN, Richter RW, Risser RC, et al: Genetic factors for the development of Alzheimer disease in the Cherokee Indian. Arch Neurol 1996; 54:997–1000Google Scholar
21. Weiner MF, Rosenberg RN, Svetlik D, et al: Dementia diagnosis, treatment, and research with American Indians. Alzheimer Dement 2006; 2:327–329Google Scholar
22. Weiner MF, Hynan LS, Beekly D, et al: Comparison of Alzheimer’s disease in American Indians, whites, and African Americans. Alzheimers Dement 2007; 3:211–216Google Scholar
23. Hall KS, Gao S, Emsley CL, et al: Community Screening Interview for Dementia (CSI`D′): performance in five disparate study sites. Int J Geriatric Psychiatry 2000; 15:521–531Google Scholar
24. Hall KS, Hendrie HC, Brittain HM, et al: The development of a dementia screening interview in two distinct languages. Int J Methods Psychiatr Res 1993; 3:1–28Google Scholar
25. Ferarro FR: Assessment and evaluation issues regarding Native American elderly adults. J Clin Geropsychology 2001; 7:311–318Google Scholar
26. Taussig MK, Ponton M: Issues in neuropsychological assessment for Hispanic older adults, in Ethnicity and the Dementias. Edited by Gallagher-Thompson D, Yeo G. Philadelphia, Taylor & Francis, 1996, pp 47–58Google Scholar
27. Jervis LL, Beals J, Fickenscher A, et al: Performance on the Mini-Mental State Examination and Mattis Dementia Rating Scale among older American Indians. J Neuropsychiatry Clin Neurosci 2007; 19:173–178Google Scholar
28. Folstein MF, Folstein SE, McHugh PR: “Mini-Mental State”: a practical method for grading the cognitive state of patients for the clinician. J Psychiatr Res 1975; 12:189–198Google Scholar
29. Jurica PJ, Leittan CL, Mattis S: DRS-2: Dementia Rating Scale—2 Professional Manual. Lutz, Fla, Psychological Assessment Resources, 2001Google Scholar
30. Mattis S: Mental status examination for organic mental syndrome in the elderly patient, in Geriatric Psychiatry. Edited by Bellack R, Karasu B. New York, Grune & Stratton, 1976, pp 77–121Google Scholar
31. Crum R, Anthony J, Bassett S, et al: Population-based norms for the Mini-Mental State Examination by age and educational level. JAMA 1993; 269:2386–2391Google Scholar
32. Vangel SJJ, Lichtenberg PA: Mattis Dementia Rating Scale: clinical utility and relationship with demographic variables. Clin Neuropsychol 1995; 9:209–213Google Scholar
33. Paolo AM, Troster AI, Glatt SL, et al: Influence of demographic variables on the Dementia Rating Scale. J Geriatr Psychiatry Neurol 1995; 8:38–41Google Scholar
34. Whitfield KE: Studying cognition in older African Americans: some conceptual considerations. Journal of Aging and Ethnicity 1996; 1:41–52Google Scholar
35. Cosentino S, Manly J, Mungas DM: Do reading tests measure the same construct in multiethnic and multilingual older persons? J Int Neuropsychol Soc 2007; 13:228–236Google Scholar
36. Hargrave R: Neurocognitive assessment of dementia in African American elders, in Ethnicity and the Dementias, 2nd ed. Edited by Gallagher-Thompson D, Yeo G. New York, Routledge, 2006, pp 33–53Google Scholar
37. Anderson TM, Sachdev PS, Brodaty H, et al: Effects of sociodemographic and health variables on Mini-Mental State Exam scores in older Australians. Am J Geriatr Psychiatry 2007; 15:467–476Google Scholar
38. Manly JJ, Jacobs DM, Sano M, et al: Cognitive test performance among nondemented elderly African Americans and whites. Neurology 1998; 50:1238–1245Google Scholar
39. Manson SM, Garroutte EM, Goins RT, et al: Access, relevance, and control in the research process: lessons from Indian Country. J Aging Health 2004; 16:58S–77SGoogle Scholar
40. Beals J, Manson SM, Mitchell CM, et al: Cultural specificity and comparison in psychiatric epidemiology: walking the tightrope in American Indian research. Cult Med Psychiatry 2003; 27:259–289Google Scholar
41. Davis MB: Native America in the Twentieth Century: An Encyclopedia. New York, Garland Publishing, 1996Google Scholar
42. Social Security Administration: Supplemental Security Income (SSI), 2006Google Scholar
43. O'Nell T: Disciplined Hearts: History, Identity, and Depression in an American Indian Community. Berkeley, University of California, 1996Google Scholar
44. SPSS I: SPSS 17.0. Chicago, Ill, SPSS, 2008Google Scholar
45. Brayne C, Calloway P: The association of education and socioeconomic status with the Mini-Mental State Examination and the clinical diagnosis of dementia in elderly people. Age Ageing 1990; 19:91–96Google Scholar
46. Bank AL, Yochim BP, MacNeill SE, et al: Expanded normative data for the Mattis Dementia Rating Scale for use with urban, elderly medical patients. Clin Neuropsychol 2000; 14:149–156Google Scholar
47. Friedl W, Schmidt R, Stronegger WJ, et al: The impact of sociodemographic, environmental, and behavioral factors, and cerebrovascular risk factors as potential predictors of the Mattis Dementia Rating Scale. J Gerontol A Biol Sci Med Sci 1997; 52A:M111–M116Google Scholar
48. Gone JP: Mental health services for Native Americans in the 21st century United States. Prof Psychol Res Pr 2004; 35:10–18Google Scholar
49. Chan AS, Choi MK, Salmon DP: The effects of age, education, and gender on the Mattis Dementia Rating Scale performance of elderly Chinese and American individuals. J Gerontol B Psychol Sci Soc Sci 2001; 56:P356–363Google Scholar
50. Woodard JL, Auchus AP, Godsall RE, et al: An analysis of test bias and differential item functioning due to race on the Mattis Dementia Rating Scale. J Gerontol B Psychol Sci Soc Sci 1998; 53B:P370–374Google Scholar