Determining Levels of Unawareness in Dementia Research
Abstract
Clinical methods used to determine unawareness in dementia exist; however, their applicability to empirical research is limited. The authors present a statistically derived approach to determining unawareness that addresses these limitations. Dementia patients (n=32) completed an awareness questionnaire. On an identical questionnaire, collateral sources (relatives or friends; n=32) provided their best estimate of participants' abilities. The authors compared cluster analysis, the proposed empirical approach, to a currently used standard deviation cutoff score approach. Cluster analysis included all participants, displayed sound statistical properties, and was more sensitive to between-group differences in psychotic symptoms than standard deviation cutoff. Cluster analysis appears more appropriate for understanding the overall spectrum of unawareness in dementia research.
Unawareness may be defined as a lack of insight or diminished awareness for sensory, motor, cognitive, or other behavioral deficit.1,2 It is thought to prevent individuals from recognizing their deficits, thus preventing them from avoiding dangerous situations.3 For example, unaware patients with Alzheimer's disease (AD) are less likely to restrict their driving habits than their aware AD counterparts.4 As a result, unawareness of deficit in dementia has become a topic of much research.5,6
Methods to determine unawareness and subsequently categorize patients vary.7 A recent comparison of several available methods revealed significant variation in the presence and severity of participants' unawareness across methods.8 This finding casts doubt on the convergent validity of using multiple methods to define unawareness in dementia research. As a result, researchers agree that there is a need for a more standardized approach to assessing and determining unawareness in dementia.1
Increasingly, investigators are using questionnaires to evaluate unawareness.2,5,7 These questionnaires are given to a patient and a “collateral source,” a relative or friend in frequent contact with the patient. Questions probe such areas as intellectual, cognitive, and emotional functioning. A discrepancy score is calculated by subtracting the patient's questionnaire total score from the associated collateral source's total score on a similar questionnaire probing the patient's abilities.6,9,10 This discrepancy score provides clinicians with an approximation of a patient's level of unawareness. Furthermore, some investigators derive a mean and standard deviation from their existing clinical sample to determine a cutoff score below which patients are deemed aware and one standard deviation above which patients are deemed unaware.9
Although this method increases the ease of clinical categorization, it is somewhat limited when applied to empirical research. The standard deviation cutoff approach excludes the “average” participant whose scores fall within the standard deviation range. Consequently, awareness groups derived from the cutoff approach represent a restricted range of scores because only the upper and lower limits of the distribution are included in group analyses. Thus, using this approach for empirical purposes leads to analyses of the extremes of a particular population.8
Regardless of the approach used, strict reliance on a discrepancy score may fail to account for specific aspects of patient and/or collateral source variability.11 For example, one individual may vastly overestimate his or her abilities when compared with a collateral source and thus be deemed “unaware,” while another may vastly underestimate abilities and be perhaps “hyperaware.”11 Furthermore, identical discrepancy scores may result from different pairings of the participant's and collateral source's total scores—differences not captured by the composite discrepancy score. Thus, an individual with questionnaire totals of 20 (caregiver) and 10 (self) and another individual with higher totals of 40 (caregiver) and 30 (self) will receive the same discrepancy score, 10, but individual scores may suggest subtle variations in levels of unawareness. Capturing this variability may be critical in understanding how patients compare on unawareness and how this manifests functionally.
The purpose of the current investigation is to present a statistically derived approach to operationally defining unawareness for use in empirical research. Our proposed method, cluster analysis, will attempt to address previously mentioned limitations. We hypothesize that cluster analysis, while allowing for the inclusion of all subjects into aware or unaware groups, will provide the same, if not a more detailed, level of accuracy in distinguishing unawareness of deficit in dementia.
METHODS
Participants
Participants were recruited from the outpatient Geriatric Assessment Program (GAP) at Crozer-Chester Medical Center. GAP consists of a comprehensive evaluation of psychological, neuropsychological, and physical health. A social worker, geriatrician, neurologist, psychiatrist, and neuropsychologist examined participants. Patients also received an MRI or CT study of the brain and appropriate laboratory studies.
A description of the cognitive evaluation conducted for diagnostic purposes is outlined in detail elsewhere.12 An interdisciplinary team conference convened to determine dementia status, using NINCDS-ADRDA criteria for Alzheimer's disease (AD)13 or the California Criteria of Chui for probable/possible ischemic vascular dementia (IVD).14 Participants not meeting either of these criteria sets but demonstrating a dementing illness were included if they met the DSM-IV criteria for dementia.15 Patients without dementia were excluded. On the basis of a review of medical records and information provided by patients' families, participants were excluded if there was a positive history of head injury, past or present substance abuse of any kind, or psychiatric disorder including major depression, schizophrenia, late-onset psychosis, or epilepsy. Appropriate laboratory studies identified individuals with vitamin B12, folate, or thyroid deficiency for exclusion.
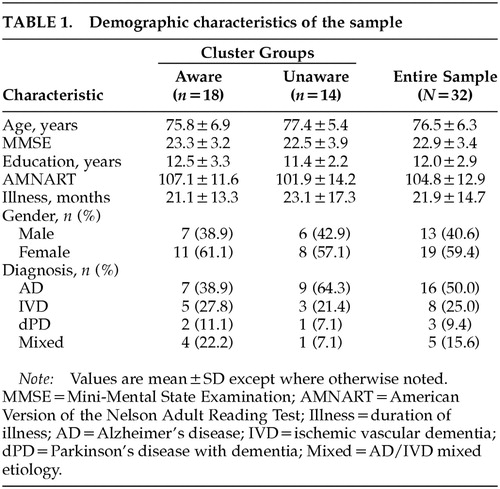
A total of 32 dementia participants (16 AD; 8 IVD; 3 Parkinson's disease with dementia; 5 mixed AD/IVD) originally evaluated through GAP met all study criteria. This study was approved by local institutional review boards, and all subjects gave written informed consent. The overall sample was approximately 76 years old, with women representing 60% of the sample. Scores from the Mini-Mental State Examination (MMSE)16 suggested that the overall sample was in the early or mild stages of dementia.17 Participants' level of education varied, but the majority had completed high school, and premorbid IQ, as measured by the American version of the Nelson Adult Reading Test (AMNART),18 fell within the average range (Table 1). Collateral source estimates of participants' duration of illness, queried during clinical interview, was approximately 21 months.
Apparatus
The Awareness Questionnaire assessed insight into cognitive and behavioral deficits in dementia. We derived our questionnaire from Starkstein and colleagues' Anosognosia Questionnaire used with similar dementia populations.9 We reworded some questions for clarity and ease of comprehension by eliminating medical terminology and jargon. Furthermore, we substituted some questions to target specific cognitive and behavioral areas equally to assess possible variability in the nature of unawareness in dementia. Thus, 7 questions probed each of the following areas: memory and language, activities of daily living, executive functioning, and emotional functioning, for a total of 28 questions. Each response was rated on the following Likert-type scale: 0 (never), 1 (sometimes), 2 (most of the time), 3 (all of the time); higher scores indicated higher perceived impairment. Participant and collateral source total scores were calculated individually by summing Likert scale choices (maximum=84). Total scores were then used to calculate a discrepancy score (collateral source total score minus participant total score).
To assess the ability of the proposed cluster analysis method to provide similar, if not more detailed, between-group differences when compared with current methods, screening measures assessing cognitive and behavioral functions previously associated with unawareness in dementia19,20 were also administered. The MMSE16 assessed overall cognitive status. A psychosis questionnaire probed behavioral disturbances such as paranoia, hallucinations, and delusions to determine if individuals lacking awareness of their deficits also suffered from other forms of altered perception.
Procedure
The Awareness Questionnaire was given to both the patient and an identified collateral source as part of the GAP neuropsychological evaluation. We operationally defined a collateral source as any person currently responsible for, or in regular contact with, the participant. In our study, the collateral source was typically a relative who accompanied the participant to the evaluation.
Clinical psychology doctoral students administered the Awareness Questionnaire to each participant. Questions were read individually and participants were instructed to give their best estimate of their abilities based on the four-point Likert scale. This scale was verbally repeated after each question and simultaneously displayed in large text on an 8½×11 sheet of paper to protect against confusion or short-term memory impairment. Collateral sources provided their best estimate of the participant's level of functioning according to the same four-point scale. Collateral sources also answered the psychosis questionnaire. Items endorsed on the psychosis questionnaire were discussed during clinical interview to clarify initial reports.
Group Determinations
We used participant and collateral source totals to create bivariate data points for each participant. The first component was the discrepancy score (d) and the second component was the collateral source total score (CS). Thus, each data point is a pair of the form (di, CSi) for i (individual) equals 1, 2,…, 32. Through the use of bivariate data points we could consider the impact of negative values on levels of unawareness; negative values might result if a participant endorsed more difficulty relative to the collateral source. Agglomerative hierarchical clustering21 begins with each data point as its own cluster. Next, the distance between any two data points is computed according to a given metric. We examined two metrics (i.e., measurement scales): the Euclidean metric and the Manhattan or “city block” metric. Points separated by the smallest distance are joined to form a cluster. The distance between remaining cases and this new cluster is recalculated, treating the new cluster as a single group. The two closest observations or clusters are then joined to form a new cluster or incorporated with an existing cluster. This process is continued until all observations eventually belong to a single cluster (Figure 1). Both analyses used the compact method of linkage, chosen for its ability to create final clusters based on the maximum difference between clusters.21
We derived standard deviation cutoff criteria from discrepancy scores. On the basis of previously outlined methods,9 we categorized participants as unaware of their deficits if their discrepancy score was greater than one standard deviation above our sample mean. Aware participants had discrepancy scores falling anywhere below the sample mean. Participants within one standard deviation of the mean were not included in standard deviation cutoff groups.
RESULTS
The Manhattan metric and the Euclidean metric produced identical results at the two- and three-cluster level (Figure 2). The two-cluster level provided dichotomous groups of aware and unaware participants (aware=18; unaware=14). All participants were included when forming these groups. The three-cluster level of analysis provided subtle distinctions within the unaware group. As may be seen in Figure 2, one cluster of unaware participants obtained high discrepancy scores (i.e., high levels of unawareness) coupled with collateral source scores indicative of high levels of CS-perceived impairment (HIGH). Likewise, the second cluster of unaware participants demonstrated high discrepancy scores; however, collateral source scores indicated only a moderate degree of CS-perceived impairment (MODERATE). Two participants received identical discrepancy scores (see boldface numbers in Figure 2). At the two-cluster level they were classified as unaware, yet at the three-cluster level they joined different unaware groups because of the variability of individual total scores. Negative values clustered within the aware group; however, within that group a specific “hyperaware” subgroup did not emerge. AD patients appear more likely to be unaware of their deficits than the other dementia subtypes (Table 1). Although a chi-square comparison of AD and non-AD dementia types by awareness level was not statistically significant (P=0.15), our small sample size may be a factor influencing this result.
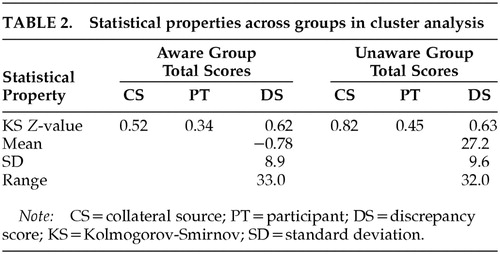
One-sample Kolmogorov-Smirnov (K-S) tests provided evidence regarding the distribution of scores for cluster analysis groups; this evidence is provisional, however, given the power issues inherent with K-S. Results for aware (P>0.84) and unaware (P>0.52) groups suggested normal distributions of scores (Table 2). In addition, group data derived via cluster analysis did not display the restriction of range generally associated with some dichotomous grouping methods, in that no scores were excluded from consideration.
We calculated the mean (11.5) and standard deviation (16.8) for the entire sample in order to determine the appropriate standard deviation cutoff. As a result, participants with discrepancy scores of 28.3 or greater (one standard deviation above the mean) were included in the unaware group. Six participants met this criterion. Participants with discrepancy scores of 11.5 or less (at or below the sample mean) were included in the aware group. Seventeen participants met this criterion. Nine participants did not meet either criterion and were excluded from standard deviation score groups. This method did not provide further distinctions beyond the aware/unaware dichotomy.
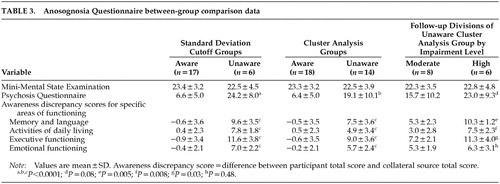
Separate one-way analyses of variance (ANOVAs) compared aware and unaware groups derived via cluster analysis and aware and unaware groups derived from the standard deviation cutoff score method on measures of overall cognitive and behavioral functioning to determine the level of accuracy that cluster analysis provides when compared with the standard deviation cutoff score method. ANOVAs using standard deviation cutoff score groups revealed higher psychosis questionnaire scores for unaware participants when compared with their aware counterparts (F=38.3, df=1,20, P<0.0001), but no group differences on MMSE total score (P=0.62). Similarly, separate one-way ANOVAs using cluster analysis groups revealed higher psychosis questionnaire scores for unaware participants when compared with their aware counterparts (F=20.5, df=1,28, P<0.0001), and no differences in overall cognitive functioning (P=0.54). Results are shown in Table 3. Regardless of the grouping method used, discrepancy scores for all four domains assessed with the awareness questionnaire were highly significant (Table 3). In light of nonsignificant differences between aware and unaware groups for age, education, or premorbid IQ as measured by the AMNART, these variables were not controlled for in the above-mentioned analyses.
We compared the HIGH and MODERATE unaware groups, revealed through cluster analysis, on the psychosis questionnaire. One-way ANOVA results revealed marginally higher scores for the HIGH group when compared with the MODERATE group (P=0.08). In addition, separate one-way ANOVA results revealed elevated discrepancy scores for the HIGH group when compared with the MODERATE group for memory and language functioning (F=11.6, df=1,12, P=0.005), activities of daily living (F=9.9, df=1,12, P=0.008), and executive functioning (F=6.1, df=1,12, P=0.03) only.
DISCUSSION
The purpose of the present investigation was to present a statistically derived approach to defining unawareness of deficit for dementia research that would address current limitations. In general, cluster analysis appears to be a more revealing and empirically applicable method for considering the overall spectrum of unawareness.
Cluster analysis included all participants in aware and unaware groups. Furthermore, it revealed variations in unawareness based on collateral source appraisals. A highly unaware group was distinguished from a moderately unaware group. This distinction supports the view that using a discrepancy score in isolation fails to account for specific aspects of individual variability.11 Cluster analysis supplies a statistical way to account for this variability.
Comparisons of the standard deviation cutoff method and cluster analysis suggest comparable categorizations of included individuals. However, no assumptions can be made regarding those excluded from standard deviation cutoff groups. Cluster analysis placed seven of the nine participants not meeting the standard deviation cutoff criterion in the MODERATE unaware group, one in the HIGH unaware group, and one in the aware group. Individuals excluded from standard deviation cutoff methods fall within one standard deviation of the mean, a statistical range usually considered average.17 These “average” individuals are the ones who will most likely present in a clinic; research conducted without them may be restricted in clinical applicability. In contrast, with the inclusion of the “average” individual in aware/unaware groups via cluster analysis, one is no longer discussing the extremes of a particular population.8
One may argue that dividing participants into aware and unaware groups is artificial and may constrain a rather continuous construct.8 We would argue that cluster analysis captures greater subtleties in unawareness than other methods. Furthermore, cluster analysis is data driven, such that if scores are highly similar across a given sample, obvious cluster groupings (i.e., aware and unaware) will not emerge. This attribute also makes the cluster analysis approach useful to investigate awareness in healthy aging, currently being advocated in the literature.19 Not only did the cluster method capture the phenomena of unawareness in greater detail, it did so without producing a skewed distribution or restriction of range cited by critiques of dichotomous grouping methods. Thus, group data from cluster analysis displayed sound statistical properties imperative for empirical research.
Cluster analysis produced similar between-group results to the standard deviation cutoff method and did so even with “average” participants included. However, only the cluster analysis method allowed for further distinctions within the unaware group that were not seen when comparing the aware and unaware groups. Not only did the collateral sources of HIGH unaware participants endorse elevated levels of perceived impairment for these individuals, they also endorsed more psychotic symptoms than collateral sources of MODERATE unaware participants, suggesting that other alterations of perception outside the realm of awareness, such as delusions and paranoia, may be a point of divergence between these two unaware subgroups. Furthermore, the HIGH subgroup showed disproportionate levels of unawareness within the domains of memory and language, activities of daily living, and executive functioning when compared with the MODERATE subgroup. Admittedly, differences in specific cognitive or behavioral processes and the severity of such impairment remain speculative between HIGH and MODERATE unaware groups given our sample size. Nonetheless, the current research suggests that heterogeneity in unawareness, discussed in the literature,19 may be best detected through the subtle variations uncovered with the cluster analysis grouping method.
There is no doubt that using cluster analysis in a clinical setting is difficult. Furthermore, it, like the standard deviation approach, is biased by patient and collateral source report. However, the cluster analysis method relies more heavily on collateral source reporting, which is shown to correlate with actual cognitive performance.2 It is also important to note that using currently available methods for determining levels of unawareness in dementia research leads to inconsistent results8 and questionable applicability.11
Thus, we advocate the use of cluster analysis for empirical endeavors because of its inclusive nature, statistical properties, and greater distinctions between levels of unawareness. Results from the present study corroborate previous findings20 that more severe forms of unawareness (i.e., our HIGH subgroup) are associated with other forms of behavioral alterations. Future studies investigating the gradations of unawareness shown through cluster groupings may allow for a greater understanding of the cognitive and behavioral underpinnings of unawareness in dementia. Investigating the underlying mechanisms associated with HIGH and MODERATE degrees of unawareness will allow for enhanced understanding of risk factors associated with differing unawareness levels, and also perhaps for more specific patient management strategies based on unawareness levels.
ACKNOWLEDGMENTS
These data were presented, in part, at the 28th annual meeting of the International Neuropsychological Society, Denver, CO, February 2000, and at the 18th annual meeting of the National Neuropsychological Society, Washington, DC, November 1998.

FIGURE 1. Distance between two points using the Euclidean metric (dashed line) and the Manhattan metric (the sum of the length of the two solid lines) with filled circles representing individual data point pairs (di, CSi). d=discrepancy score; CS=collateral source total score; i=1, 2,…, 32.

FIGURE 2. Icicle plots for Manhattan metric and Euclidean metric procedures with discrepancy score, di, and the collateral source total, CSi, presented (di, CSi). ★ signifies participants excluded by standard deviation method.
 |
 |
 |
1 Zanetti O, Vallotti B, Frisoni GB, et al: Insight in dementia: when does it occur? Evidence for a nonlinear relationship between insight and cognitive status. J Gerontol Psychol Sci 1999; 54B:P100-P106Google Scholar
2 Green J, Goldstein FC, Sirockman BE, et al: Variable awareness of deficits in Alzheimer's disease. Neuropsychiatry Neuropsychol Behav Neurol 1993; 6:159-165Google Scholar
3 Heilman K, Barrett AM, Adair JC: Possible mechanisms of anosognosia: a defect in self-awareness. Phil Trans R Soc Lond B 1998; 53:1903-1909Crossref, Google Scholar
4 Cotrell V, Wild K: Longitudinal study of self-imposed driving restrictions and deficits in awareness in patients with Alzheimer disease. Alzheimer Dis Assoc Disord 1999; 13:151-156Crossref, Medline, Google Scholar
5 Starkstein SE, Sabe L, Vázquez S, et al: Neuropsychological, psychiatric, and cerebral blood flow findings in vascular dementia and Alzheimer's disease. Stroke 1996; 27:408-414Crossref, Medline, Google Scholar
6 Smith CA, Henderson VW, McCleary CA, et al: Anosognosia and Alzheimer's disease: the role of depressive symptoms in mediating impaired insight. J Clin Exp Neuropsychol 2000; 22:437-444Crossref, Medline, Google Scholar
7 Sevush S: Relationship between denial of memory deficit and dementia severity in Alzheimer disease. Neuropsychiatry Neuropsychol Behav Neurol 1999; 12:88-94Medline, Google Scholar
8 Derouesne C, Thibault S, Lagha-Pierucci S, et al: Decreased awareness of cognitive deficit in patients with mild dementia of the Alzheimer's type. Int J Geriatr Psychiatry 1999; 14:1019-1030Crossref, Medline, Google Scholar
9 Migliorelli R, Teson A, Sabe L, et al: Anosognosia in Alzheimer's disease: a study of associated factors. J Neuropsychiatry Clin Neurosci 1995; 7:338-344Link, Google Scholar
10 Vasterling JJ, Seltzer B, Watrous W: Longitudinal assessment of deficit unawareness in Alzheimer's disease. Neuropsychiatry Neuropsychol Behav Neurol 1997; 10:197-202Medline, Google Scholar
11 Neundorfer MM: Awareness of variability in awareness. Alzheimer Dis Assoc Disord 1997; 11:121-122Crossref, Medline, Google Scholar
12 Libon DJ, Bogdanoff B, Bonavita J, et al: Neuropsychological deficits associated with ischemic vascular dementia caused by periventricular and deep white matter alterations. Arch Clin Neuropsychol 1997; 12:239-250Crossref, Medline, Google Scholar
13 McKhann G, Drachman D, Folstein M, et al: Clinical diagnosis of Alzheimer's disease: report of the NINCDS-ADRDA work group under the auspices of the Department of Health and Human Services Task Force on Alzheimer's disease. Neurol 1984; 34:939-944Crossref, Medline, Google Scholar
14 Chui HC, Victoroff JI, Margolin D, et al: Criteria for the diagnosis of ischemic vascular dementia proposed by the State of California Alzheimer's Disease Diagnostic and Treatment Centers. Neurol 1992; 42:473-480Crossref, Medline, Google Scholar
15 American Psychiatric Association: Diagnostic and Statistical Manual of Mental Disorders, 4th edition. Washington, DC, American Psychiatric Association, 1994Google Scholar
16 Folstein SE, McHugh PR: “Mini-Mental State”: a practical method for grading the cognitive state of patients for the clinician. J Psychiatr Res 1975; 12:189-198Crossref, Medline, Google Scholar
17 Lezak MD: The neuropsychological examination: interpretation, in Neuropsychological Assessment, 3rd edition, edited by Lezak MD. New York, Oxford University Press, 1995, pp 144-169Google Scholar
18 Grober E, Sliwinski M: Development and validity of a model of estimating premorbid verbal intelligence in the elderly. J Clin Exp Neuropsychol 1991; 13:933-949Crossref, Medline, Google Scholar
19 Agnew SK, Morris RG: The heterogeneity of anosognosia for memory impairment in Alzheimer's disease: a review of the literature and a proposed model. Aging and Mental Health 1998; 2:7-19Crossref, Google Scholar
20 Paulsen JS, Ready RE, Stout JC, et al: Neurobehaviors and psychotic symptoms in Alzheimer's disease. J Int Neuropsychol Soc 2000; 6:815-820Crossref, Medline, Google Scholar
21 Johnson RA, Wichern DW: Applied Multivariate Statistical Analysis, 3rd edition. Englewood Cliffs, NJ, Prentice Hall, 1992Google Scholar