Influence of Diazepam on Clinically Designed fMRI
However, as the method has matured, there has been an increased interest in using fMRI as a clinical tool. There are several possible clinical applications. The most obvious is the possibility of using fMRI for presurgical planning and intraoperative guidance in neurosurgery. 1 , 2 Some epileptic patients need to undergo neurosurgical resection of the seizure onset area. fMRI has proved to be very useful in determining language laterality prior to patients’ surgery. 3 , 4 Another interesting clinical possibility is to follow the recovery process after stroke, for example. Patients may recover their functional abilities after cerebral lesions due to the plasticity of the human brain. By studying the fMRI activation patterns, it may also be possible to improve the rehabilitation strategy. 5
The increased interest in using fMRI in clinical applications in the future calls for further methodological improvements to ensure that the results of the examinations are reliable. Several factors can affect the reliability of the results, including magnetic field inhomogeneities and motion artifacts. There are also important subject-dependent factors, such as motivation and intelligence, that affect the results. Compared with healthy volunteers, patients often have reduced abilities, which may require specially adapted paradigms and instructions. Another complication is the fact that many patients feel uneasy in the unfamiliar imaging environment and may need sedatives to be able to undergo the examination, which, in turn, may influence the results by making the patient less focused on the task or by influencing the brain functions by affecting any of the signal submission systems. It is also possible that the substance affects the shape of the hemodynamic response. Any of these factors may affect the end result (i.e., the activation map that is presented to the clinician). In recent pharmacological MRI (phMRI) studies, the effects of common substances, such as nicotine, alcohol, cocaine, and caffeine on fMRI have been investigated. 6 – 8 For instance, alcohol and heroin 6 , 7 both reduce the extent of activation to visual stimuli, and it has been shown that caffeine 8 increases the BOLD (blood-oxygen-level-dependent) contrast, which is the basis for fMRI experiments.
Benzodiazepines are used widely for the treatment of anxiety-related disorders and as hypnotics. Some benzodiazepines are also used in the treatment of epilepsy. More than 50 different benzodiazepines are known worldwide. One of the most well-known is diazepam. The different benzodiazepines have different duration of action, which is largely due to the fact that they have different pharmacokinetic half-lives and in some cases also different active metabolites. The mechanism of action is the same for all benzodiazepines; they interact with the GABA A receptor in the brain, which leads to reduced arousal and also affects emotions. Benzodiazepine binding sites at the GABA receptor have been studied by imaging methods, such as single photon emission tomography (SPECT) and positron emission tomography (PET), as reviewed by Heiss and Herholz. 9 Diazepam is often given to a patient for premedication in MRI. Streeter et al. 10 studied the changes in global and regional cerebral blood flow (CBF) on alprazolam by dynamic susceptibility contrast MRI. They found that CBF decreases at alprazolam administration relative to placebo, which indicates that benzodiazepines would influence the resulting activation maps from fMRI examinations. Kleinschmidt et al. 11 studied the effect of an intravenous injection of diazepam on the BOLD signal. No significant change of the MR signal was detected after the diazepam injection. Direct investigations of the impact of diazepam on brain activation patterns from motor and word generation tasks have, to our knowledge, not been performed previously.
Diazepam is rapidly absorbed when given orally and has a high bioavailability and is also highly protein-bound in plasma. The half-life is stated to be around 40 hours, but it can vary widely. Even more importantly, the induced active metabolites have even longer half-lives, up to 100 hours or more. 12 Maximum plasma concentration is reached 30 to 60 minutes after oral intake. The sedative effects start in the distribution phase. Therapeutic blood concentration for diazepam is said to range from 0.1 to 1.0 mg/liter.
The response of the drug depends on the dose. Diazepam at low doses causes drowsiness and sleepiness. At high doses, however, excitement, disinhibition, severe sedation, and effects on respiration may occur. The duration of the response is dose-dependent; however, onset of effects occurs within 30 minutes and significant effects can last from 12 to 24 hours with therapeutic doses.
Laboratory studies have shown that single doses of diazepam (5 to 20 mg) are capable of causing significant decreases in performance, such as decreased divided intention, slowed reaction time, decreased eye-hand coordination and impairment of vigilance, information retrieval, and psychomotor and cognitive skills. 13 – 16
In clinical practice, patients who are scheduled for fMRI can feel fearful or anxious, sometimes to the extent that they find it difficult or even impossible to carry out the investigation. Diazepam is therefore sometimes given to alleviate the patient’s discomfort. In this study, diazepam and placebo were given to a test sample prior to fMRI examinations of motor, language, and memory function in a double-blind, crossover study design. The aim of this study was to investigate the influence of diazepam in low doses on the outcome of a clinically designed fMRI examination. Studies of the general impact of diazepam on brain function were out of the scope of the present study. Administration of the drug, functional testing paradigms, and analysis methods were selected to resemble the clinical situation as closely as possible.
METHOD
Study Design
Twenty healthy young adults (10 women, ages 22 to 30, mean=25 [SD=2.1]) participated in the study on a voluntary basis. The subjects were recruited by advertisements at Linköping University. None of the test subjects was on continuous medication, with the exception of oral contraceptives (female participants). Two of the women were left-handed; all of the others were right-handed. The subjects were screened for drug abuse and cognitive impairments using a questionnaire prior to recruitment. They were also informed not to take alcohol or other drugs 24 hours before examination and not to drink beverages containing caffeine or to use nicotine products on the day of the examination. All participants signed informed consent forms after a thorough presentation of the study. The study was approved by the local ethics committee as well as the Swedish Medical Products Agency.
We utilized a double-blind, randomized, counterbalanced, and placebo-controlled study design. Prior to the fMRI examinations, all test subjects underwent an anatomical MRI scan that allowed them to become acquainted with the physical setting of the study.
All participants underwent two fMRI examinations separated by at least 1 and at most 6 weeks. The choice of intersession interval was based on the assumption that it would both minimize learning effects and dropouts, which were estimated to increase with increased intervals between scanning sessions. The subjects were informed that they would recieve 5 mg diazepam on one exam occasion and placebo on the other. Half of the subjects got diazepam and the other half placebo on the first occasion. Approximately 30 minutes prior to the scanning session, which is a clinically relevant interval for premedication, the test subjects orally received a capsule containing either 5 mg of diazepam or placebo. Whole blood and plasma samples from each person were collected immediately before the administration of the capsule and then later, approximately 45 minutes (minimum=37 mins, maximum=68 mins) after administration and while still in position in the scanner, between the first and the second functional tests. Whole blood and plasma samples were analyzed for the concentration of diazepam. After adding an internal standard (prazepam), each sample was extracted at pH 7 and the extract was analyzed on a Hewlett Packard 5890 Series II GC fitted with a nitrogen-phosphorus detector. The chromatograph was temperature-programmed. More details of the analytic method are reported elsewhere. 17 , 18
fMRI
In each of the two fMRI sessions, the subjects were exposed to three different tests: motor, language, and memory. SuperLab (www.superlab.com) was used for paradigm presentation and subject response recordings. The subjects had a four-button response pad from Photon Control (Photon Control Inc, Burnaby, Canada, www.photonixco.com) in their right hand. The paradigms were presented to the subjects using a back projection screen viewed via a mirror mounted on the head coil.
In the motor test, the subject was asked to press the buttons on the right-hand response pad at a given visual cue. The subjects were instructed to press the buttons in sequence starting with the index finger. There were a total of 25 events with a mean interstimulus interval of 16 seconds (minimum=14 sec, maximum=18 sec).
During the language test, the subjects were asked to silently form words beginning with a specific letter. Each letter was presented for 5 seconds and within a block of three to five letters. The activation blocks were separated by control blocks in which nonsense characters were displayed in the same fashion as in the activation blocks. In total, there were seven activation blocks and eight fixation blocks, resulting in a total duration of 5 minutes.
For memory mapping, an n -back letter test was used. There were four blocks each of 1-back, 2-back, fixation, and a control task in which the subjects were instructed to respond when a given letter appeared on the screen (0-back). The order (0, 1, or 2) of the upcoming n -back test was presented on the screen before each task block. Letters were displayed for half a second, followed by a blank screen for 1.5 seconds. Each block comprised 15 such events, whereof four were targets.
Data Acquisition
Magnetic resonance images were acquired on a Philips Achieva 1.5 T scanner. For functional imaging, a BOLD sensitive EPI-sequence with the following imaging parameters was used: data matrix 80x80, FOV 230 mm, TE 40 msec, TR 2,700 msec, 31 slices, slice thickness 3 mm for the language and memory paradigms. For the motor task the TR was 1,300 msec, and 16 slices were collected; all other parameters were unchanged.
Data Analysis
Analysis of functional images was performed using SPM2 (www.fil.ion.ucl.ac.uk/spm/software/spm2).
Preprocessing
First, the image slices were corrected for different acquisition timing. Then, to correct for subject movement, all images were realigned to a slice in the middle of the time-series. The data were also corrected for movement-related susceptibility effects. 19 Images were then normalized into a standard space and resliced into 3×3×3 mm 3 voxels. Finally the images were smoothed with an 8 mm FWHM isotropic Gaussian filter.
Statistical Analysis
Analysis was performed separately for each subject and task. The models for each task included the canonical hemodynamic response function and its temporal and dispersion derivatives. In the n -back model, each level (0,1, and 2) was modeled separately and an additional regressor indicating the button presses was included. The statistical analysis was restrained to predefined regions of interest (ROIs) created using the Wake Forest University PickAtlas. 20 , 21 The motor task ROI consisted of the precentral and postcentral gyri. The ROI for the language analysis included the middle and inferior frontal gyri, the superior, inferior and middle temporal gyri, and the angular gyrus and supramarginal gyrus. The ROI for the working memory test included, bilaterally, the inferior frontal gyrus, inferior parietal lobule, middle frontal gyrus, and the superior parietal lobule. All the ROIs included the above-mentioned gyri of both hemispheres.
We applied p values of 0.001 and 10 −5 to give activation maps. The numbers of activated voxels inside the ROIs were calculated for each subject and task. In addition, the laterality index was calculated as (L–R)/(L+R) where L and R were the number of suprathreshold voxels in the left and right hemispheres, respectively. For the number of activated voxels and the laterality index, simultaneous comparisons between drugs and between the first and second examination were made with analysis of variance (ANOVA) with the subject as a random effect. The analysis was carried out with JMP 5.1 (SAS Institute, Cary, NC).
The one-sample t test was used to compute activation maps at the group level. Contrast images for each subject were included to get the overall activation for each task. The results were thresholded at p=0.05, corrected for family-wise errors. In addition, the contrast images of each of the tests were tested using ANOVA models to investigate whether there were any differences in the activation pattern between sessions or substance given. The results were thresholded at p=0.05, corrected for family-wise errors.
Based on the group activation maps, two spherical ROIs (10 mm diameter) were created. One ROI was chosen to be centered on the voxel with the highest statistical significance within the ROI used for the laterality index analysis. For the motor, word generation, and n -back tasks, the ROI center was in the left precentral gyrus (Broca’s area [BA] 4), left inferior frontal gyrus (BA9), and left middle frontal gyrus (BA6), respectively. Within these ROIs, the percent signal change (PSC) was calculated using MarsBaR. 22 The session and substance effects on the percent signal change were evaluated using the Wilcoxon signed-ranks test.
The other ROI was chosen to be in an area with no task-related signal based on the activation maps thresholded at p=0.001, uncorrected. For the motor, word generation, and n -back tasks, the ROI center was in the left medial frontal gyrus (BA9), right middle frontal gyrus, and right superior frontal gyrus, respectively. From these ROIs the signal time-series was extracted using MarsBaR. All signals were scaled to a mean value of 100 and the standard deviation of the mean of the ROI time courses was calculated. The standard deviation was considered to be a measure of background signal variation, and the session and substance effects on the standard deviation were assessed using the Wilcoxon signed-ranks test.
RESULTS
In this study, the influence of diazepam in low doses on fMRI examinations was investigated by a placebo-controlled study design. Twenty healthy volunteers were examined for assessment of activated areas during motor, language, and memory tasks. Each subject was administered 5 mg diazepam at one session and placebo at the other. The administration of diazepam was randomized with respect to session.
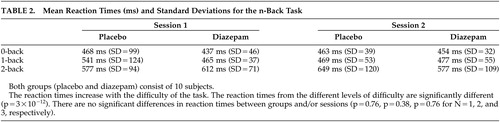
Accuracy and Reaction Times
Behavioral data were collected during the motor and n -back tasks. For both tasks, the accuracy of the subject’s responses was generally very high and there were no differences in performance between runs or substance given. During the motor task, none of the subjects missed any of the targets, either in the session with diazepam or in the placebo session. The mean reaction times did not differ significantly between the two sessions, independent of whether diazepam was administered on the first or second occasion ( Table 1 ). In addition, there was no difference between placebo and diazepam groups in total (ANOVA test, p=0.94) ( Table 1 ).
 |
For the n -back task, there was a significant difference in reaction time for the different levels of difficulty (p<10 −3 ). However, there was no significant difference between placebo and diazepam groups or sessions (ANOVA, p=0.76, p=0.38, p=0.76 for N=1, 2, and 3, respectively) ( Table 2 ). Neither were there performance differences that were related to the n -back levels and that could be tracked to diazepam administration ( Table 3 ).
 |
 |
Activation Volume
As expected, the different thresholds used to create activation maps resulted in altered activation volumes. However, the conclusions remained the same with respect to session and substance effects. There were no significant differences in activation volumes between the diazepam and placebo sessions for any of the tasks, regardless of the threshold used. However, for the motor and n -back tasks, a significant session effect, which could not be explained by diazepam administration, was observed. Between the first and second sessions, the number of activated voxels decreased. The significance of the observed difference was not affected by altering the threshold ( Table 4 ).
 |
Laterality Index
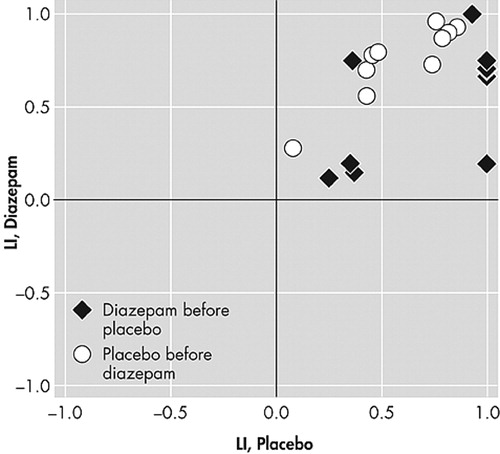
The word generation and n -back tests showed no significant changes in laterality index, either between sessions or substance received, regardless of which threshold was applied (all p values>0.05). For some of the subjects, the variability of the n -back laterality index scores was quite large ( Figure 1 ). This variability was not affected by the statistical threshold applied to the images. In contrast, the laterality index scores from the word generation test were much more stable ( Figure 2 ).

There was no significant change in the mean of the laterality index scores with respect to session or drug. Note the large variability of the scores.

There were no significant session or drug effects on the Laterality Index.
The laterality index for the motor task increased significantly from Session 1 to Session 2. That is, the left hemisphere was more dominant at the second session, regardless of the threshold applied (p=0.008 for the lower threshold and p=0.002 for the higher threshold). There were, however, no significant drug effects (p>0.10 for both thresholds) ( Figure 3 ).
There was a significant increase of the scores between the first and second sessions.
Activation Location
The group analysis of the motor test revealed activity in the precentral gyrus, postcentral gyrus and inferior parietal lobule bilaterally, and the right middle frontal gyrus and cingulate gyrus ( Figure 4A ).

All images were thresholded at p=0.05, corrected for family-wise errors. A=Motor task, B=Word Generation task, C= n -Back task.
Group analysis of the word generation task produced significant activations bilaterally in the inferior frontal gyrus and middle occipital gyrus, in the left middle frontal, middle temporal fusiform and supramarginal gyri, and in the right superior temporal gyrus ( Figure 4B ).
The group analysis of the main n -back effect (1 + 2 versus 0) revealed activated clusters in the middle frontal gyrus, precentral gyrus, superior parietal lobule, and occipital cortex bilaterally, in the left inferior parietal lobule, superior temporal gyrus and postcentral gyrus, and also in the right superior frontal gyrus and supramarginal gyrus ( Figure 4C ).
The ANOVA test revealed no significant differences for the motor and n -back task with respect to session and substance effects. For the word generation test, the ANOVA analysis unveiled a difference between Sessions 1 and 2 in Broca’s area.
Intensity of Activation and Background Signal
The calculations of the PSC and SD revealed no substance-related effects on the intensity of activation. However, there was a significant reduction of the PSC for the n -back task and a significant increase of the SD for the motor task between Sessions 1 and 2 (p<0.05). The results from the PSC and SD calculations suggest that there is reduced detectability of activated voxels in the second session for the motor and n -back tasks. This is indeed reflected in the reduction of activation volume.
Gender Analysis
In an additional analysis of activation volume and laterality index, the gender of the subjects was included. The same session effects described above were still present and no new significant sessions or substance-related effects were found. There was, however, a significant gender difference in the number of activated voxels for the word generation task; women had a smaller number of activated voxels (p<0.01 for both thresholds).
Diazepam Concentration
The concentration of diazepam in blood samples was, in general, quite low and varied significantly. In those samples that were collected after the diazepam intake, the median of the plasma level was 0.02 mg/liter (min: 0, max: 0.16, mean: 0.092). There was no significant difference in the blood level of diazepam between men and women (p=0.62). More details on the analysis of blood and plasma samples will be presented elsewhere.
DISCUSSION
Twenty subjects were scanned on two occasions. In one of the sessions, the subjects received diazepam, and in the other, placebo. Diazepam administration was randomized and counterbalanced with respect to session. The subjects were scanned while performing motor, word generation and n -back tasks. Activation maps were created using two different thresholds for each task and subject. Both these activation thresholds were used in the subsequent calculations of the number of activated voxels and the laterality index. All results regarding diazepam and session effects were unaffected by the threshold applied to the statistical images. For the number of activated voxels, there was a significant difference between sessions for the motor and n -back tasks. For both tests, the number of activated voxels decreased. On the other hand, the word generation task displayed no session-related effects. The laterality index displayed a significant session effect, increased left-sided dominance, for the motor task. The word generation task produced laterality index values that were consistent between sessions and with little variation between and within subjects. In contrast, the laterality index from the n -back task showed much more variation between sessions and subjects as well as within subjects.
The evident session effects might have their origin in a learning effect. Prior to the scanning sessions, all participants attended a short training session to minimize learning. However, the learning curve for the motor and n -back tasks may have been underestimated, and more extensive training could possibly have reduced the session effects. The interval between scanning sessions was relatively long, which ought to diminish the learning effect, but an even longer interval might have reduced the practice effect even more. It is also important to consider that the participants were all young adults, mostly medical students, who probably were able to improve their problem-solving strategy while performing the task. However, the second-level analysis of the statistical images showed no differences for n -back and motor in activation patterns related to session number or drug. The absence of session effects in the word generation task may be due to the word generation task being more similar to everyday experiences than the motor and n -back tasks. It is not likely that the session discrepancy is related to a sudden change in scanner performance. The subjects were scanned in an interleaved fashion in the sense that when some of the subjects had participated in both of their functional imaging sessions, others had not undergone their first examination.
The absence of diazepam-related effects on the activation volume and laterality index might, to some degree, be explained by the significant session effects inducing large intersession variability. However, this does not apply to the word generation task, where no significant intersession differences were observed and yet no diazepam-related effects were found. Another potential source for the absence of drug-related effects is the diazepam concentration levels. The concentration of diazepam in blood samples was, in general, quite low. In addition, based on the large variability of the measured diazepam content, it is possible that the distribution phase varied much among the subjects, which implies that a longer waiting period between the drug intake and the start of the functional imaging would have been appropriate. However, the 30-minute interval between drug intake and fMRI scanning was based on the aim to resemble clinical practice as well as possible.
To test whether the high variability of the blood diazepam levels had a significant effect on the results, nine subjects with the highest blood diazepam levels were selected. The same statistics were recomputed for these subjects, but there were no significant drug-related effects for this group of subjects and the session effects remained. Information on subjective measures (e.g., sleepiness) might have contributed to the evaluation of expectancy effects of placebo administration. Such information would have been informative, especially as many subjects, in general, react with substantial sleepiness without sedating drugs at MRI examinations.
One may also be concerned that the method of evaluation might not be optimal. In recent work by Smith et al. 23 it was stated that “it is not safe to judge intersession variability by looking at variability in thresholded statistic images.” Nevertheless, we think that the number of activated voxels and the laterality index are appropriate measures in the context of this investigation. Evaluation of language laterality is important to reduce the risk of lost functionality after neurosurgical resection of seizure areas in epileptic patients. In addition, for surgical planning, a thresholded statistical image is usually presented to the clinician, and the number of activated voxels has a significant effect on the impression of the activation map.
CONCLUSIONS
The aim of this study was to test whether diazepam in doses relevant for premedication affected the results of a clinical-like fMRI session. No effects on the number of activated voxels, laterality index, percent signal change, or standard deviation related to the drug were found. The importance of the absence of a drug effect must not be overestimated. There was a distinct session effect that may have masked a smaller effect caused by diazepam. In addition, the diazepam levels in the blood samples were relatively low, indicating that a slightly higher dose would have been more appropriate. However, the results suggest that, at least for young subjects, the results of an fMRI investigation are also valid when the test subject is under the influence of diazepam.
1. Vlieger EJ, Majoie CB, Leenstra S, et al: Functional magnetic resonance imaging for neurosurgical planning in neurooncology. Eur Radio 2004; 14:1143–1153Google Scholar
2. Wilkinson ID, Romanowski CAJ, Jellinek DA, et al: Motor functional MRI for pre-operative and intraoperative neurosurgical guidance. Br J Radiol 2003; 76:98–103Google Scholar
3. Rutten GJM, Ramsey NF, van Rijen PC, et al: fMRI-determined language lateralization in patients with unilateral or mixed language dominance according to the WADA test. Neuroimage 2002; 17:447–460Google Scholar
4. Adcock JE, Wise RG, Oxbury JM, et al: Quantitative fMRI assessment of the differences in lateralization of language-related brain activation in patients with temporal lobe epilepsy. Neuroimage 2003; 18:423–438Google Scholar
5. Johansen-Berg H, Dawes H, Guy C, et al: Correlation between motor improvements and altered fMRI activity after rehabiliative therapy. Brain 2002; 125:2731–2742Google Scholar
6. Sell LA, Simmons A, Lemmens GM, et al: Functional magnetic resonance imaging of the acute effect of intravenous heroin administration on visual activation in long-term heroin addicts: results from a feasibility study. Drug Alcohol Depend 1997; 49:55–60Google Scholar
7. Levin JM, Ross MH, Mendelson JH, et al: Reduction in BOLD fMRI response to primary visual stimulation following alcohol ingestion. Psychiatry Res 1998; 82:135–146Google Scholar
8. Mulderink TA, Gitelman DR, Mesulam MM, et al: On the use of caffeine as a contrast booster for BOLD fMRI studies. Neuroimage 2002; 15:37–44Google Scholar
9. Heiss WD, Herholz K: Brian receptor imaging. J Nucl Med 2006; 47:302–312Google Scholar
10. Streeter CC, Ciraulo DA, Harris GJ, et al: Functional magnetic resonance imaging of alprazolam-induced changes in humans with familial alcoholism. Psychiatry Res 1998; 82:69–82Google Scholar
11. Kleinschmidt A, Bruhn H, Krüger G, et al: Effects of sedation, stimulation, and placebo on cerebral blood oxygenation: a magnetic resonance neuroimaging study of psychotropic drug action. NMR Biomed 1999; 12:286–292Google Scholar
12. Mandelli M, Tognoni G, Garattini S: Clinical pharmacokinetics of diazepam. Clin Pharmacokinet 1978; 3:72–91Google Scholar
13. de Gier JJ, Hart BJ, Nelemans FA, et al: Psychomotor performance and real driving performance of outpatients receiving diazepam. Psychopharmacology 1981; 73:340–344Google Scholar
14. Kozena L, Frantik E, Horvath M: Vigilance impairment after a single dose of benzodiazepines. Psychopharmacology 1995; 119:39–45Google Scholar
15. Drummer OH: Benzodiazepines: effects on human performance and behaviour. Forensic Sci Rev 2002; 14:2–14Google Scholar
16. Friedman H, Greenblatt DJ, Peers GR, et al: Pharmacokinetics and pharmacodynamics of oral diazepam: effect of dose, plasma concentration, and time. Clin Pharmacol Ther 1992; 52:139–150Google Scholar
17. Eklund A, Jonsson J, Schubert J: A procedure for simultaneous screening and quantification of basic drugs in liver, utilizing capillary gas chromatography and nitrogen sensitive detector. J Anal Toxicol 1983; 7:24–28Google Scholar
18. Druid H, Holmgren P: A compilation of fatal and control concentrations of drugs in post-mortem femoral blood. J Forensic Sci 1997; 42:79–87Google Scholar
19. Andersson JLR, Hutton C, Ashburner J, et al: Modeling geometric deformations in EPI time series. Neuroimage 2001; 13:903–919Google Scholar
20. Maldjian JA, Laurienti PJ, Burdette JB, et al: An automated method for neuroanatomic and cytoarchitectonic atlas-based interrogation of fMRI data sets. Neuroimage 2003; 19:1233–1239Google Scholar
21. Maldjian JA, Laurienti PJ, Burdette JH: Precentral gyrus discrepancy in electronic versions of the Talairach Atlas. Neuroimage 2004; 21:450–455Google Scholar
22. Brett M, Anton JL, Valabregue R, et al: Region of interest analysis using an SPM toolbox. Neuroimage 2002; 16Google Scholar
23. Smith SM, Beckmann CF, Ramnani N, et al: Variability in fMRI: a re-examination of inter-session differences. Hum Brain Mapp 2005; 24:248–257Google Scholar