Limbic Metabolic Abnormalities in Remote Traumatic Brain Injury and Correlation With Psychiatric Morbidity and Social Functioning
Proton MR spectroscopy ( 1 H-MRS) detects signals from relevant brain metabolites such as N -acetylaspartate (NAA), a putative neuronal marker 9 ; lactate; creatine; choline; myo -inositol; and glutamate. 1 H-MRS conveys information independently from MRI signal changes, showing metabolic abnormalities in TBI beyond MRI-defined lesions. 10 Furthermore, 1 H-MRS shows loss of NAA in normal appearing white matter in TBI, which correlates with outcome. 10 – 12 Although most imaging studies have focused on recent TBI, less is known about long-term effects of TBI. 13
The high incidence of psychiatric impairments in TBI survivors 2 and the selective hippocampal vulnerability in TBI 6 , 7 can be reconciled within the conceptual frame of the limbic-cortical network model of mood regulation. 14 The purpose of this study was to quantify brain metabolites using 1 H-MRS at 3 Tesla in the left hippocampus, the left and right anterior cingulate cortex (ACC) and adjacent white matter in TBI patients remotely from the traumatic episode relative to age-matched comparison subjects and to examine their clinical correlates. We hypothesized that the NAA signal would be reduced in the left hippocampus and the ACC of remote TBI patients relative to comparison subjects. A second hypothesis was that NAA would inversely correlate with severity of mood and cognitive impairments (i.e., more severe impairments would be associated with lower NAA metabolic ratio in the left hippocampus and the ACC).
METHODS
Participants and Measures
Twenty TBI patients (mean age=41, SD=16.5; 18 men) were evaluated along with 13 age- and sex-matched comparison subjects (mean age=41.2, SD=18.5; 12 men). Comparison subjects were selected among healthy volunteers without any history of significant trauma or psychiatric or neurologic impairment, as assessed in a research questionnaire. The inclusion of nontrauma comparison subjects instead of orthopedic trauma comparison subjects was favored to reference MRS changes in TBI to healthy brain metabolites, as most of the MRS literature does. Future studies might evaluate TBI metabolic changes in reference to orthopedic trauma to define the specificity of the present findings.
Case definition of TBI was based on the Centers for Disease Control and Prevention Guidelines for Surveillance of Central Nervous System Injury. 15 , 16 Patients were identified based on self-reported history of TBI further corroborated by review of medical records. All patients were evaluated at the University of Iowa Hospitals and Clinics. Patients with penetrating TBI, those with injury-related complications (such as hypoxic-ischemic injury), and those who had undergone neurosurgical procedures were excluded. Severity of TBI was assessed with the 24-hour Glasgow Coma Scale (GCS) score. 17 Diagnosis of depression was made according to the DSM-IV criteria for mood disorder due to general medical condition. At the time of imaging, patients received psychiatric and neuropsychological evaluations. The Present State Examination was used to elicit symptoms related to an axis I diagnosis of mood and anxiety disorder due to TBI. Severity of depressive and anxiety symptoms was assessed using the Hamilton Depression Rating Scale (HAM-D) and the Hamilton Anxiety Rating Scale (HAM-A), respectively. The neuropsychological evaluation consisted of the Repeatable Battery for the Assessment of Neuropsychological Status (RBANS), a self-contained battery that includes tests of immediate and delayed memory, language, visuospatial/constructional ability, and attention. Psychosocial adjustment was assessed using the Social Functioning Examination (SFE), a 28-item scale that assesses patients’ satisfaction with their social functioning in familial, recreational, and occupational settings during the preceding 2-week period. The SFE scores range from 0 to 1, with higher scores indicating greater severity of social impairment. Information on duration of posttraumatic amnesia was not available. The study was approved by the local institutional review board and all of the participants provided written informed consent prior to participation.
MRI Acquisition
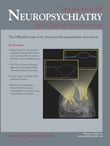
The following sequences were acquired on a 3-T scanner (Magnetom Tim Trio; Siemens, Erlangen, Germany) using the standard quadrature head coil: (1) Coronal T 1 -weighted 3D MPRAGE with TR/TE/TI=2,530/3.34/1,100 msec, 1 NEX, flip angle=10°, FOV=260 mm, voxel size=1.4×1×1.5 mm; (2) coronal T 2 -weighted FSE with TR/TE=5,340/14 msec, FOV=260 mm, voxel size=1.4×1×3 mm; (3) axial T 2 parallel to the hippocampus with TR/TE=3,600/15, flip angle=120°, FOV=240×240 mm, 3 mm thick; (4) axial T 2 oriented with 10° rostral rotation from the AC-PC line (following the axis of the ACC) with TR/TE=3,600/15, flip angle =120°, FOV=240×240 mm, 3 mm thick; (5) axial GRE with TR/TE=500/16, flip angle =20°, FOV=240×210 mm, 5 mm thick; (6) single voxel PRESS of the left hippocampus with TR/TE=3,000/30 msec, 128 acquisitions, voxel size=4.5 cm 3 ; and (7) 2D PRESS CSI of the left and right ACC with TR/TE=3,000/30 msec, four acquisitions, nominal voxel size=0.4 cm 3 , with seven saturation bands to reduce lipid contamination. Sequences 6 and 7 were repeated without water suppression with 16 and 1 acquisitions respectively. Localized shimming was optimized at the preparation phase of sequences 6 and 7. Given the significant magnetic susceptibility in the inferior temporal lobe at 3 Tesla, a single voxel technique was used in the left hippocampus with locally optimized shimming. Acquisition of a separate voxel on the right hippocampus (with additional shimming) would have led to an unacceptably long scan time. Figure 1 shows (A) placement of the left hippocampus voxel and (B) localization of the 2D CSI grid at the ACC.
MRS and MRI Processing
Raw spectroscopy data files were postprocessed offline using the LCModel software. 18 The unsuppressed water signal was used for signal phasing, for eddy current correction, and as quantification standard. Signals from NAA plus N -acetyl-aspartyl-glutamate (tNAA), creatine, choline, myo -inositol, and glutamate plus glutamine were quantified. 19 For CSI PRESS, typically eight voxels were averaged from the right and left ACC and from the adjacent right and left white matter as identified on coplanar axial T 2 -weighted images. If present, T 2 hyperintense lesions were avoided from the selected voxels. Fit values with Cramer Rao lower bounds of 20% or higher were excluded from the analysis. tNAA to creatine ratio, choline/creatine, myo -inositol/creatine, and glutamine/creatine ratios were used for the hippocampus and ACC voxels to account for partial volume from CSF. Frontal white matter voxels selected in normal-appearing white matter were deemed free from significant partial volume contamination; therefore, water referenced metabolite signals (tNAA, creatine, choline, myo -inositol, and glutamine) were used. Using this method, intersubject coefficients of variation for tNAA of 9.5% and 5.6% were reported in healthy comparison subjects in the hippocampus and ACC, respectively. 20
Statistical Analysis
Statistical analysis was done using SPSS 15 for Windows. We used t tests and one-way analysis of variance (ANOVA) for comparing mean scores of patients and comparison subjects. Analysis of covariance with univariate general linear model was used to test for independence of MRS from clinical variables. The nonparametric Spearman’s test was used for testing correlations between MRS variables and neuropsychological and SFE scores. Partial correlation was performed to account for contributions to MRS findings from age, trauma severity, and time since injury. No correction for multiple comparisons was performed given the a priori main hypotheses listed in the introduction. All reported p values are two-tailed.
RESULTS
Patient Characteristics
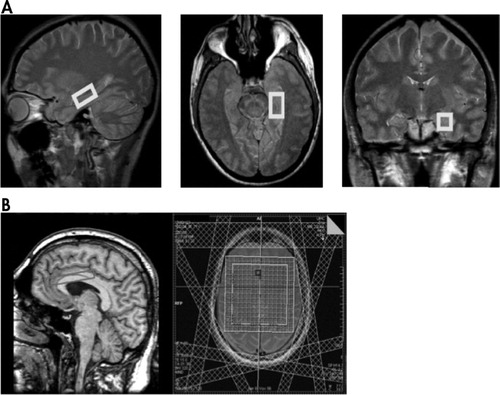
Patients’ demographic characteristics, mechanism of trauma, and findings on structural imaging are summarized in Table 1 . Five TBI patients had a diagnosis of depression and seven patients had a diagnosis of anxiety; three patients had both diagnoses. None of the patients was diagnosed with posttraumatic stress disorder (PTSD). Eleven patients (55%) had left frontal injury based on structural MRI while two (10%) had right frontotemporal lesions. Five patients (25%) had normal MRIs, and two (10%) had MRI findings consistent with diffuse axonal injury. There were no significant age differences between patients and comparison subjects. Patients were evaluated at a mean of 55 months after trauma. Ten patients were studied within the first year after TBI while 10 patients were studied more than 1 year posttrauma. There was a significant age difference between patients evaluated within the first year of trauma and those evaluated later on (mean=30.7 [SD=12.82] compared with mean=51.4 [SD=13.27], t test p=0.0023). The mean GCS score of TBI patients was 11.65 (SD=3). GCS scores did not correlate significantly with neuropsychological, psychiatric, or MRS variables.
 |
1 H-MRS Data
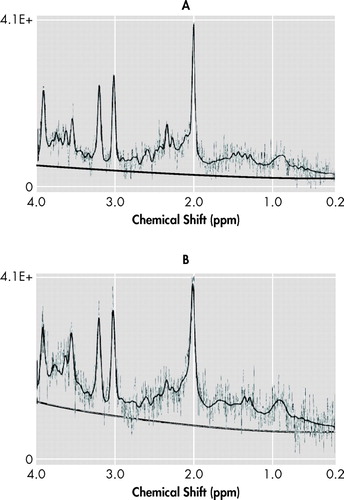
Figure 2 shows two representative spectra from the ACC and the left hippocampus. Two left hippocampus spectra failed to provide useful data due to inadequate B0 homogeneity. Patients had reduced tNAA to creatine ratio in the left hippocampus relative to comparison subjects (mean=1.3 [SD=0.21] compared with mean=1.55 [SD=0.21]; 16.1% difference; one-way ANOVA: F=10.73, df=1, 30, p=0.003). A univariate analysis of variance controlling for age was significant (F=5.27, df=2, 30, p=0.011). There was no significant difference in left hippocampus tNAA to creatine ratio between patients with recent and remote TBI. The remainder of the hippocampal metabolite ratios did not differ between groups. There were no significant group differences for ACC metabolite ratios. Left frontal white matter choline was reduced in patients relative to comparison subjects (mean=1.78 [SD=0.30] compared with mean=2.03 [SD=0.35]; 12.2% difference; one-way ANOVA: F=4.80, df=1, 32, p=0.036). No other significant metabolic differences were found between patients and comparison subjects.
The TBI patients who fulfilled clinical criteria for major depression (n=5) had reduced tNAA to creatine ratio in the left ACC relative to patients without mood disorders (n=15) independently of age and GCS score (1.47 compared with 1.68; F=3.39, df=3, 19, p=0.044). When time after TBI was also included in the model, however, it no longer yielded a significant result (F=2.39, df=4, 19, p=0.97). No metabolic differences were detected between patients with and without a diagnosis of anxiety in any of the studied regions.
Left hippocampal NAA to creatine ratio significantly correlated with SFE score in the TBI group (r s =−0.502, p=0.034): patients with more severe social impairment had significantly lower left hippocampal NAA to creatine ratio. A partial correlation between left hippocampal tNAA to creatine ratio and SFE score accounting for age, GCS score, and days after TBI was significant (partial correlation=−0.544, p=0.036). No other significant correlations were observed between left hippocampal, ACC, or frontal white matter 1 H-MRS variables and GCS, Present State Examination, HAM-D, HAM-A, or RBANS scores.
DISCUSSION
The first finding of this study was reduced tNAA to creatine ratio in the left hippocampus in remote TBI patients relative to age-matched healthy comparison subjects. Since only the left hippocampus was sampled with MRS for technical reasons, no assumptions on the laterality of hippocampal metabolic changes in TBI can be made. However, a possible explanation for the left-sided metabolic effects of both TBI (left hippocampus) and depression (left ACC) is that the patient sample had a significantly higher representation of left-sided MRI lesions (55%) than right-sided lesions (10%). Hippocampal neurons are particularly vulnerable to TBI, even when the impact site is remote from the medial temporal lobe. Stereological estimation of neuronal and glial cell numbers in a rat hippocampus after fluid percussion injury showed selective neuronal (but not glial) cell loss in the hilus and CA3. 21 Our finding of reduced tNAA to creatine ratio in the left hippocampus might reflect neuronal loss since NAA is a selective neuronal marker. 9 Therefore, reduction of neuronal NAA signal relative to nonspecific creatine probably reflects selective neuronal loss or metabolic impairment. Concomitant creatine increase, however, cannot be excluded while using ratios. Metabolic ratios are theoretically independent from atrophy, since the atrophy factor enters both the numerator and the denominator, thus being cancelled out (neglecting chemical shift). Moreover, when comparing left hippocampal tNAA to creatine ratio between patients with normal MRI (n=5) and those with lesions seen on MRI (n=15), no significant differences were found (mean=1.25 [SD=0.26] compared with mean=1.32 [SD=0.20], respectively; p>0.6). This further supports the notion that hippocampal metabolic abnormalities are independent from structural lesions.
Since the comparison group consisted of nondepressed healthy individuals, hippocampal NAA loss could be partially due to depression and not TBI. However, although limited by the small sample size, our analysis of depressed compared with nondepressed patients demonstrated mood-related changes in the left ACC, not in the hippocampus, suggesting that the reduced tNAA to creatine ratio in the left hippocampus was secondary to TBI and not depression. tNAA/choline was also reduced in the left medial temporal lobe using an 8 cm 3 voxel including the hippocampus in 20 chronic TBI patients relative to comparison subjects. 22 On the other hand, we did not detect significant NAA loss between TBI patients and comparison subjects in the left and right ACC and adjacent frontal white matter. Selective hippocampal vulnerability has been substantiated on injury models including in vitro 7 and in vivo 6 animal TBI paradigms. Hilar and CA3 neurons as well as newborn neurons of the dentate gyrus 6 are preferentially lost after trauma over neocortical neurons. Hippocampus and fornix atrophy has also been demonstrated after human TBI on imaging studies. 23 , 24
A second finding was that the subgroup of patients with a diagnosis of major depression had reduced tNAA to creatine ratio in the left ACC compared with nondepressed patients, independently from age and GCS score but not from time after trauma. These results are considered preliminary given the low statistical power secondary to the small sample size of depressed patients (n=5). Left ACC tNAA to creatine ratio reduction is theoretically independent from atrophy. In a previous TBI series there was an association of left frontal and basal ganglia lesions seen on CT scans with major depression. 25 Recently, postconcussion depressive symptoms in male athletes were correlated with gray matter volume in the right ACC. 26 Rostral cingulate metabolism has been proposed as a critical link in a limbic-cortical network model of depression. 14 Therefore, left ACC neuronal impairment as measured through the NAA signal may express dysfunction of a neuronal network underlying secondary mood disorders in TBI. Spectroscopic ACC alterations could then represent changes related to mood disorder and not to TBI since no spectroscopic differences were detected in the ACC between TBI patients and comparison subjects. A possible explanation for the lateralizing effect of depression on left ACC tNAA to creatine ratio, as noted above, is that our patient sample had a significantly higher representation of left-sided than right-sided MRI lesions. Actually, all five of our depressed patients had left frontal and/or temporal lesions on MRI. On the other hand, no metabolic abnormalities were recognized between patients with and without a diagnosis of anxiety disorder.
The third finding was the significant correlation between left hippocampal tNAA to creatine ratio and SFE scores. The instrument evaluates factors such as personal satisfaction with closest other relationship, vocational status, and ability of the family to cope with chronic illness, which are critical for quality of life and return to productivity after TBI. The reliability and validity of this instrument in patients with brain injury has been demonstrated. 27 Interestingly, the predictive role of left hippocampal tNAA to creatine ratio on psychosocial adjustment was independent from trauma severity, as measured with the GCS on admission, and patient’s age. Our data suggest that hippocampal neuron loss or dysfunction underlies poor behavioral and social outcome of TBI patients. This finding can be interpreted in light of the known deleterious consequences of left hippocampal injury in the cognitive and affective domains. In a previous study, for example, hippocampal atrophy was reported in TBI patients with mood disorders relative to severity-matched TBI patients without mood disorders. 8 Mood disorders, particularly major depression, are frequent complications of TBI and have a negative impact on patient recovery and functional outcome. 2 Finally, when comparing patients with normal and abnormal MRI, no significant differences in SFE scores were obtained (mean=0.16 [SD=0.09] compared with mean=0.15 [SD=0.17], respectively; p>0.8). Further analysis breaking down the MRI lesion group was not done given the heterogeneity of the lesions and the small sample size.
There were no significant correlations between RBANS total or domain specific scores and hippocampal or ACC metabolites. Previous studies have not found a consistent relationship between metabolites and neuropsychological scores. For instance, medial temporal lobe NAA/choline showed weak correlation with neuropsychological tests in TBI. 22 However, neurobehavioral MRS studies of the frontal lobes after childhood TBI demonstrated correlations with executive and social functioning. 28 Our neuropsychiatric metabolic correlations are exploratory in nature since no a priori hypotheses or multiple comparison corrections were formulated.
An unexpected finding was reduced choline in the left frontal white matter of TBI patients. As shown in Table 1, 11/20 patients (55%) had left frontal injury based on structural MRI. Even though MRI lesions were avoided at the time of voxel selection, metabolic abnormalities of the normal appearing white matter may account for the reduced choline peak. A number of studies showed increased choline during the early phase and up to 1 year after TBI, 12 with a tendency to normalize on follow-up. NAA loss in the frontal lobes is also a dynamic process, with recovery in patients with good outcome and persistent low levels in patients with poor outcome. 29 Our finding of reduced left frontal white matter choline was associated with a nonsignificant trend toward reduction of the remaining metabolite peaks. Increased water content, which was used as the internal signal standard, in the preferentially injured left frontal lobe might account for these metabolic changes.
A number of limitations of this study have to be pointed out. The sample size was relatively small, particularly for the depressed TBI subgroup. The cross-sectional design of the imaging portion precluded analysis of follow-up data. Furthermore, patient sample heterogeneity resulted from inclusion of younger patients with recent trauma as well as older patients with remote TBI. Since noninjured comparison subjects were recruited instead of orthopedic trauma comparison subjects, secondary mood disorders could have contributed to the findings. On the technical side, the lack of coregistration of MR spectroscopy with segmented MRI obligated us to use metabolic ratios to reduce partial volume effects in cortical voxels. Finally, neuropsychological correlations are exploratory because no correction for multiple comparisons was performed.
CONCLUSION
Remote TBI patients displayed 1 H-MRS abnormalities in the limbic system with reduced tNAA to creatine ratio in the left hippocampus consistent with neuronal loss and/or dysfunction, which significantly correlated with psychosocial adjustment. This change appears to be independent of atrophy and age. Furthermore, left ACC tNAA to creatine ratio was reduced in TBI patients with a clinical diagnosis of mood disorder independently of age and trauma severity. Further nonspecific metabolite loss in the left frontal white matter may reflect the bias of lesion distribution in our sample with increased water content. In conclusion, 1 H-MRS may provide additional information beyond signal and volume changes on structural MRI in remote TBI, which may also be related to psychosocial adjustment and psychiatric status.
1. Kraus JF, McArthur DL: Epidemiologic aspects of brain injury. Neurol Clin 1996; 14:435–450Google Scholar
2. Jorge RE, Starkstein SE: Pathophysiologic aspects of major depression following traumatic brain injury. J Head Trauma Rehabil 2005; 20:475–487Google Scholar
3. Raghupathi R: Cell death mechanisms following traumatic brain injury. Brain Pathol 2004; 14:215–222Google Scholar
4. McCarthy MM: Stretching the truth: why hippocampal neurons are so vulnerable following traumatic brain injury. Exp Neurol 2003; 184:40–43Google Scholar
5. Signoretti S, Marmarou A, Aygok GA, et al: Assessment of mitochondrial impairment in traumatic brain injury using high-resolution proton magnetic resonance spectroscopy. J Neurosurg 2008; 108:42–52Google Scholar
6. Gao X, Deng-Bryant Y, Cho W, et al: Selective death of newborn neurons in hippocampal dentate gyrus following moderate experimental traumatic brain injury. J Neurosci Res 2008; 86:2258–2270Google Scholar
7. Geddes DM, LaPlaca MC, Cargill RS: Susceptibility of hippocampal neurons to mechanically induced injury. Exp Neurol 2003; 184:420–427Google Scholar
8. Jorge RE, Acion L, Starkstein SE, et al: Hippocampal volume and mood disorders after traumatic brain injury. Biol Psychiatry 2007; 62:332–338Google Scholar
9. Birken DL, Oldendorf WH: N-acetyl-L-aspartic acid: a literature review of a compound prominent in 1H-NMR spectroscopic studies of brain. Neurosci Biobehav Rev 1989; 13:23–31Google Scholar
10. Cohen BA, Inglese M, Rusinek H, et al: Proton MR spectroscopy and MRI-volumetry in mild traumatic brain injury. AJNR Am J Neuroradiol 2007; 28:907–913Google Scholar
11. Marino S, Zei E, Battaglini M, et al: Acute metabolic brain changes following traumatic brain injury and their relevance to clinical severity and outcome. J Neurol Neurosurg Psychiatry 2007; 78:501–507Google Scholar
12. Holshouser BA, Tong KA, Ashwal S, et al: Prospective longitudinal proton magnetic resonance spectroscopic imaging in adult traumatic brain injury. J Magn Reson Imaging 2006; 24:33–40Google Scholar
13. Isoniemi H, Kurki T, Tenovuo O, et al: Hippocampal volume, brain atrophy, and APOE genotype after traumatic brain injury. Neurology 2006; 67:756–760Google Scholar
14. Mayberg HS: Limbic-cortical dysregulation: a proposed model of depression. J Neuropsychiatry Clin Neurosci 1997; 9:471–481Google Scholar
15. Thurman DJ, Sniezek JE, Johnson D, et al: Guidelines for Surveillance of Central Nervous System Injury . Atlanta, US Department of Health and Human Services, Centers for Disease Control and Prevention, 1995 Google Scholar
16. Butler JA, Langlois JA: Central Nervous System Injury Surveillance Annual Data of Submission Standards—2000 . Atlanta, US Department of Health and Human Services, Centers for Disease Control and Prevention, National Center for Injury Prevention and Control, 2001 Google Scholar
17. Teasdale G, Jennett B: Assessment and prognosis of coma after head injury. Acta Neurochir (Wien) 1976; 34:45–55Google Scholar
18. Provencher SW: Estimation of metabolite concentrations from localized in vivo proton NMR spectra. Magn Reson Med 1993; 30:672–679Google Scholar
19. Provencher SW: Automatic quantitation of localized in vivo 1H spectra with LCModel. NMR Biomed 2001; 14:260–264Google Scholar
20. Capizzano AA, Jorge R, Acion L, et al: Reproducibility of short TE MRS at 3 Tesla: comparison of hippocampal with cingulate spectra. Proceedings of the 14th Scientific Meeting of the International Society for Magnetic Resonance in Medicine, Seattle, 2006Google Scholar
21. Grady MS, Charleston JS, Maris D, et al: Neuronal and glial cell number in the hippocampus after experimental traumatic brain injury: analysis by stereological estimation. J Neurotrauma 2003; 20:929–941Google Scholar
22. Ariza M, Junque C, Mataro M, et al: Neuropsychological correlates of basal ganglia and medial temporal lobe NAA/Cho reductions in traumatic brain injury. Arch Neurol 2004; 61:541–544Google Scholar
23. Ariza M, Serra-Grabulosa JM, Junque C, et al: Hippocampal head atrophy after traumatic brain injury. Neuropsychologia 2006; 44:1956–1961Google Scholar
24. Tomaiuolo F, Carlesimo GA, Di Paola M, et al: Gross morphology and morphometric sequelae in the hippocampus, fornix, and corpus callosum of patients with severe non-missile traumatic brain injury without macroscopically detectable lesions: a T1 weighted MRI study. J Neurol Neurosurg Psychiatry 2004; 75:1314–1322Google Scholar
25. Fedoroff JP, Starkstein SE, Forrester AW, et al: Depression in patients with acute traumatic brain injury. Am J Psychiatry 1992; 149:918–923Google Scholar
26. Chen JK, Johnston KM, Petrides M, et al: Neural substrates of symptoms of depression following concussion in male athletes with persisting postconcussion symptoms. Arch Gen Psychiatry 2008; 65:81–89Google Scholar
27. Starr LB, Robinson RG, Price TR: Reliability, validity, and clinical utility of the social functioning exam in the assessment of stroke patients. Exp Aging Res 1983; 9:101–106Google Scholar
28. Walz NC, Cecil KM, Wade SL, et al: Late proton magnetic resonance spectroscopy following traumatic brain injury during early childhood: relationship with neurobehavioral outcomes. J Neurotrauma 2008; 25:94–103Google Scholar
29. Signoretti S, Marmarou A, Aygok GA, et al: Assessment of mitochondrial impairment in traumatic brain injury using high-resolution proton magnetic resonance spectroscopy. J Neurosurg 2008; 108:42–52Google Scholar