Orbital and Dorsolateral Frontal Perfusion Defect Associated With Behavioral Response to Cholinesterase Inhibitor Therapy in Alzheimer's Disease
Abstract
The authors retrospectively explored the behavioral and functional imaging profile of Alzheimer's disease (AD) patients who respond to cholinesterase inhibitor therapy by using the Neuropsychiatric Inventory (NPI) and baseline [99mTc]HMPAO SPECT. Thirty AD patients were divided into three groups (Responders, Nonresponders, and Unchanged) based on their behavioral response to donepezil. Responders had significantly (P≤0.01) more pretreatment irritability, disinhibition (P≤0.05), and euphoria (P=0.05) than Nonresponders and significantly lower lateral orbital frontal (P<0.00001) and dorsolateral frontal (P≤0.0005) perfusion bilaterally. A pretreatment orbitofrontal syndrome may predict behavioral response to cholinesterase inhibitor therapy in AD.
Pharmacological, biochemical, and functional imaging observations implicate a cholinergic defect underlying many behavioral abnormalities in Alzheimer's disease (AD).1 Preliminary evidence suggests that cholinesterase inhibitors have beneficial psychotropic effects in AD.2–4 Cummings et al.5 found that physostigmine ameliorates the psychosis of AD, and Sunderland et al.6 have shown that scopolamine, an anticholinergic, increases the thought disorder in AD patients. Psychotic symptoms correlate best with metabolic and perfusion abnormalities in frontal and temporal cortex in AD.7–10
Cholinergic stimulation also may worsen behaviors. The administration of cholinergic agents may induce depressive symptoms in some AD patients,11,12 with low doses possibly improving mood symptoms and high doses precipitating dysphoria and anxiety.6 Treatment with intravenous nicotine can increase depression in AD.13 In an open-label study of donepezil in 86 AD patients, more than 41% showed behavioral improvement, 28% showed worsening behaviors, and 31% were unchanged.4 When the prevalence of behaviors at baseline was equalized, the AD patients more likely to improve behaviorally with donepezil treatment than patients who worsened behaviorally were those who had significantly greater depression, apathy, disinhibition, and irritability.4 Characterizing the functional imaging correlates of the clinical profiles of patients who improve, or decline, following cholinesterase inhibitor therapy will aid selection of possible treatment responders.
In the current study, we used the Neuropsychiatric Inventory (NPI),14 a caregiver-based instrument that evaluates 10 neuropsychiatric symptoms common in dementia patients, to document treatment response in AD to the cholinesterase inhibitor donepezil. We divided patients into responders and nonresponders on the basis of previously established criteria4,15 and then explored the baseline brain perfusion profile that distinguished the two groups as reflected by technetium Tc 99m d,l-hexamethylpropyleneamine oxime ([99mTc]HMPAO) single-photon emission computed tomography (SPECT).
METHODS
Patients
The study group consisted of 33 outpatients presenting for dementia evaluation to the University of California, Los Angeles (UCLA) Alzheimer's Disease Center who met all study criteria described below; who had caregivers willing to be interviewed; and who agreed to treatment with donepezil, increasing from 5 mg over 4 weeks to 10 mg for an additional 4 weeks (1 patient was unable to tolerate 4 weeks at 10 mg because of agitation, and the dose was decreased to 5 mg). All AD patients met National Institute of Neurological and Communicative Disorders and Stroke/Alzheimer's Disease and Related Disorders Association (NINCDS/ADRDA) criteria for probable or possible AD.16 In addition, all patients had acquired persistent decline involving at least three of the following domains: language, memory, visuospatial skills, cognition (calculation, abstraction, judgment, etc.), and emotion or personality.17 Diagnostic evaluation for all patients included complete medical history, physical and neurological examination, magnetic resonance or computed tomographic imaging, [99mTc]HMPAO SPECT of the brain, and routine blood tests (including thyroid-stimulating hormone, vitamin B12 level, and serological test for syphilis). Exclusion criteria for all patients were delirium, active systemic or non-AD neurological diseases that could significantly contribute to their cognitive impairment, history of alcohol or substance abuse, history of head trauma with loss of consciousness, and history of psychiatric disorder preceding the onset of dementia symptoms. Severity of the cognitive deficit was measured in all patients by use of the Mini-Mental State Examination (MMSE).18
Behavioral Assessment
Caregivers were interviewed with the NPI following procedures previously described14 in which screening questions for each behavior were first posed. The caregiver was asked if the behavior represented a change from that exhibited by the patient prior to the onset of the dementia and if it was present during the past month. If a positive response was obtained during the screening questions, then the behavioral domain was explored with scripted questions focusing on specific features of the behavioral disturbance. The caregiver then rated the behaviors, scoring from 1 to 4 for the frequency and 1 to 3 for the severity of each behavior. (A composite score for each domain was the product of the frequency and severity subscores; maximum=12.) The NPI is both valid and reliable.14 Raters receive specific training in NPI administration and are retrained periodically to prevent drift. The 10 domains assessed by the NPI are delusions, hallucinations, agitation, depression, anxiety, euphoria, apathy, disinhibition, irritability, and abnormal motor output. The MMSE was administered at the same time as the NPI.
A double-blind placebo-controlled study of a cholinesterase inhibitor (metrifonate) demonstrated a significant behavioral response to treatment as measured by the NPI.15 The total score on the NPI was significantly better than placebo by nearly 3 points at study endpoint; the placebo group showed nearly a 4-point worsening from baseline.15 Using a conservative interpretation of this empirical base, a 4-point or greater improvement from baseline was accepted as evidence of a positive treatment response and a 4-point or greater decrement from baseline as evidence of treatment failure. Previous double-blind placebo-controlled studies with the cholinesterase inhibitor donepezil demonstrated, after 8 weeks, a significant separation between the treatment and placebo groups.19 Thus, we evaluated our patients at baseline and at week 8 (after 4 weeks at 10 mg/day donepezil). After 8 weeks of therapy, patients who demonstrated a significant behavioral improvement (≥4-point reduction in total NPI score) were called responders, and those who declined behaviorally (≥4-point increase in total NPI score) were called nonresponders. Patients were considered unchanged if their NPI post-treatment scores were within ±3 points of baseline. Of the 33 patients with complete clinical and imaging data, 30 were selected to produce three equal groups (Responders, Nonresponders and Unchanged) of similar age, sex, handedness, education, duration of disease, and clinical dementia severity based on the MMSE scores at baseline.
Statistical Behavioral Analysis
NPI composite score data do not generate a normal distribution. Multiplying the frequency (1–4) by the severity (1–3) subscores will not produce a composite score of 5, 7, 10, or 11. The non-normal distribution of NPI data precludes traditional parametric analysis; we employed a bootstrap analysis20 as previously described.4 Briefly, to evaluate significant differences among patient groups, mean composite scores for each of the 10 NPI behaviors were generated. Bootstrap analysis combines the raw composite scores, for any given behavior, of an entire dataset and randomly samples a number of these scores equal to the number making up the groups comprising the dataset. A mean difference composite score is then calculated from the randomly comprised samples and then repeated 1,000 times on the dataset, producing a distribution of possible mean difference composite scores. The observed mean differences are compared with this distribution of the possible mean difference composite scores between two groups for each NPI item. The probability of finding the observed mean difference based on the mean difference generated by resampling is recorded. This process was repeated 10 times for each of the 10 NPI behaviors to arrive at an average probability value resulting from 10,000 resampling combinations for each comparison. If the observed difference was greater than 95% of the differences expected from random resampling in the bootstrap method, the observed difference was judged to be statistically significant at the 0.05 level.
SPECT Scanning
For all patients, an intravenous line was placed and a 15-minute period was allowed to pass for patients to regain a quiet, comfortable state before the intravenous administration of 30 mCi of technetium Tc 99m–labeled HMPAO (Ceretec; Amersham, Arlington Heights, IL). Room lights were dimmed and quiet was observed to minimize patient visual and auditory stimuli during the brain uptake phase for another 15 minutes following injection. Approximately 1 hour after injection, during which time washout of the tracer from the brain had occurred, SPECT images of the brain were obtained by using the Picker 3000XP SPECT scanner (Picker International, Cleveland, OH) with low-energy ultrahigh-resolution fan beam collimators. Images were reconstructed by filtered back-projection, using a low-pass filter, 8th-order, with a spatial frequency cutoff of 0.23 to 0.25 cycles/pixel. Transverse, sagittal, and coronal planes with a 128×128 matrix were generated. Pixel sizes were nominally 3.56×3.56 mm. Resolution of the system was approximately 6 mm full width at half maximum (FWHM).
Image Processing
Spatial alignment of all 30 SPECT datasets was accomplished via 12-parameter affine registration.21 All datasets were first aligned to one randomly selected target to obtain an “average SPECT,” which in turn was registered to the International Consortium of Human Brain Mapping (ICBM) probabilistic atlas.22 To minimize resampling of data, the two above-described registration fields were concatenated and applied to each SPECT dataset. The relative perfusion scans of each patient then underwent linear intensity normalization, on a voxel-by-voxel basis, to the global mean intensity value of all patients, thus equalizing the mean intensities across all datasets. This global normalization step did not alter the intersubject data variance or the mean intergroup differences.
Once all normalized datasets were in the common ICBM atlas space, a voxel-by-voxel subtraction was conducted between the Responder and Nonresponder, Responder and Unchanged, and Nonresponder and Unchanged groups. Subvolume thresholding (SVT) was used to create statistical maps of these subtraction results as previously described.23 Briefly, SVT utilizes the probabilistic anatomic partitioning of the ICBM atlas (partitions include the frontal, parietal, temporal, insular, and occipital cortex, along with the putamen, caudate, thalamus, and cerebellum) to model the different regions as separate stationary random fields, thereby accommodating nonuniform global brain activity. In addition, the probability distributions of the ICBM atlas allow us to control for spatial errors, imposed by registration and anatomic variability, by weighting the contribution of voxel intensities on the basis of their location within an anatomic gradient. Thus, voxels within the center of a region have the highest probability of belonging to that region, while voxels at the edge of a region have a lower chance of being accurately identified, owing to registration error and normal anatomic variability.
The SVT approach differs from commonly used statistical analysis techniques for functional images in that it avoids certain assumptions that are likely to be violated in patients with AD. In the initial step of significance evaluation, an estimate of the pooled variance for the average voxel intensity, which is dependent on the topology of the anatomic subvolume of interest, is used to assess the globally significant variability of data within each region separately, permitting a functional-anatomic test of the subtraction paradigm. This novel approach is particularly suited for the assessment of functional imaging studies in AD because parietal and temporal regions may have significantly different means and variances, across subjects, from those of frontal or subcortical regions, given the pathological distribution of the disease.24,25 Ignoring these potential differences by modeling the entire dataset as a stationary random field, as was done in many previous functional assessments, will obliterate disease-specific variability.
After the first SVT step identifies globally significant regions, the second step maps the location of voxels with a difference Z-score above 2.5 in those regions. This is a standard procedure in most functional statistical mapping techniques, with two exceptions: 1) voxel location tests are run only over those regions identified by the global search in step one; and 2) variance estimates are pooled over subjects and across voxels.
Once the locations of voxels within a region of interest (ROI) have been assigned a Z-score value, a significance level must be determined for voxels above a Z-score threshold. The SVT local search within globally significant regions derived from the between-group subtraction should be corrected for multiple voxel–wise testing to control for Type I errors in assessing significance. We employed a bootstrap analysis,20 described in Appendix A, to determine the significance of the selected voxels between Responders and Nonresponders or when the orbitofrontal cortex was evaluated in the Unchanged-minus-Responders subtraction. When no hypothesis motivated a regional comparison, then a Bonferroni correction was conducted by dividing the significance level associated with the Z-score by the number of voxels constituting a single search. (This voxel number is equal to the size of the FWHM of the scanner: 6 mm.)
RESULTS
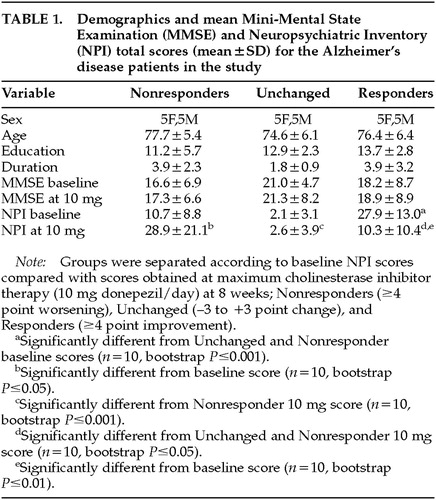
Table 1 shows the demographic makeup of the groups based on their treatment response to donepezil after 8 weeks of therapy. Total NPI scores were, of course, lower after treatment in the Responders—and higher in the Nonresponders—compared with baseline, since this was the criterion whereby the groups were separated. No significant change in MMSE with treatment occurred in any group. Concomitant psychotropic medications may influence the behavioral response to a cholinesterase inhibitor; thus, we documented the use of antipsychotics, antidepressants, anxiolytics, anticholinergics, estrogens, vitamin E, and anti-inflammatory agents. No significant differences between the Responders and Nonresponders were found for these agents during the treatment period, except for anxiolytic use only at week 4 (5 mg donepezil/day), with 3 Nonresponders and only 1 Responder (P=0.03) being treated. The Unchanged group significantly differed from the Responders in both pre- and post-treatment NPI scores, and from the Nonresponders in post-treatment NPI score (see Table 1). The Unchanged group served as a demographically similar group to further test the perfusion findings of the Responders versus Nonresponders comparison. Figure 1 (top) shows the profile of scoreable baseline NPI domains for both the Responder and Nonresponder groups. Figure 1 (bottom) shows where the AD patients used in the current study fell on the treatment curve derived from a larger study of the spectrum of behavioral response to donepezil.4 Because we were blind to a group's specific behavioral profile at baseline, a statistical analysis was conducted to determine which behaviors significantly improved or declined following cholinesterase inhibitor therapy (Figure 2). Alzheimer's disease patients with significantly greater baseline disinhibition (P<0.05) and irritability (P<0.01) were more likely to improve with donepezil treatment; euphoria was also significantly higher (P=0.05) in Responders at baseline than Nonresponders. When only those subjects with behaviors present at baseline were analyzed (two Nonresponders had no pretreatment behaviors), significantly greater irritability (P<0.01) and disinhibition (P<0.05) continued to be the behaviors that distinguished Responders from Nonresponders.
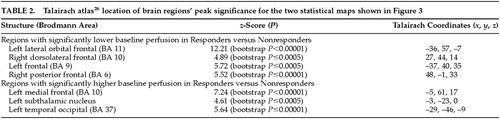
Figure 3 (top) shows the peak significance for regions with significantly lower baseline perfusion in the behavioral Responders compared with the Nonresponders. These regions were the lateral orbitofrontal and dorsolateral frontal cortex bilaterally. Figure 3 (bottom) shows the regions with significantly higher baseline perfusion in the behavioral Responders compared with the Nonresponders. These regions were the left medial frontal cortex, left subthalamic nucleus, and left inferior temporal cortex. Talairach atlas26 locations of brain regions' peak significance for the two statistical maps shown are listed in Table 2.
On the basis of the orbitofrontal findings of the experiment shown in Figure 3, we tested the hypothesis that the orbitofrontal cortex would also be significantly hypoperfused in Responders compared with the Unchanged group. Figure 4 shows the peak significance for regions with significantly lower baseline perfusion in the behavioral Responders (4a: hypothesis-driven bootstrap assessment; 4b: non–hypothesis-driven Bonferroni assessment) and Nonresponders (4c: non–hypothesis-driven Bonferroni assessment) compared with the Unchanged group. Orbitofrontal cortices, medially on the left and laterally on the right, were significantly hypoperfused in the Responders compared with the Unchanged group. Additional regions of hypoperfusion included the right dorsomedial thalamus, bilateral dorsolateral frontal, left frontal polar, and right superior parietal cortices. Figure 4c shows significant bilateral temporal, right parietal, and right pulvinar hypoperfusion in Nonresponders compared with the Unchanged group. No hyperperfused regions were found for Responders or Nonresponders compared with the Unchanged group. Talairach atlas26 locations of brain regions' peak significance for the three statistical maps shown are listed in Table 3.
DISCUSSION
There is substantial heterogeneity in neuropsychiatric symptom response to cholinergic therapy in AD. Not all AD patients improve cognitively or behaviorally with cholinesterase inhibitor therapy.15,19 If AD patients who respond to treatment have a baseline clinical profile that is distinguishable from those of nonresponders, then characterizing that profile may improve selection of patients for treatment and conserve resources. This study initiates the search for a functional imaging profile of the patients most likely to evidence behavioral response to cholinesterase inhibitor therapy.
The patients studied here are a subset of a larger group4 who had HMPAO SPECT imaging available for analysis. Similar to that larger group (in which Responders had significantly greater depression, apathy, disinhibition, and irritability at baseline compared with Nonresponders), the present group of Responders had significantly higher disinhibition and irritability compared with Nonresponders with scoreable behaviors present at baseline.
Our imaging findings suggest that these Responders have a greater perfusion defect in the orbital frontal cortex compared with Nonresponders. The dorsolateral frontal cortex bilaterally may also be hypoperfused in Responders compared with Nonresponders, whereas the left anterior medial frontal cortex may have greater perfusion in Responders than in Nonresponders. The orbitofrontal cortex was also hypoperfused in the Responders compared with the Unchanged group. These preliminary findings implicate dysfunction within the behaviorally relevant paralimbic orbitofrontal cortex of AD patients who eventually respond to cholinesterase inhibitor therapy.
Awareness of the reciprocal connections of the orbitofrontal cortex assists our interpretation of the behavioral and functional imaging profile seen in AD patients who respond to cholinergic treatment. The orbitofrontal cortex appears to integrate emotional valence with internal and external stimuli.27 Significantly greater disinhibition and irritability, along with euphoria, were present at the time of the baseline SPECT evaluation in the Responders compared with the Nonresponders. Irritability and disinhibition result from focal lesions in the orbitofrontal cortex.28–30 Cholinergic stimulation with physostigmine increases frontal perfusion in AD31 and thus may exert a greater clinical effect in those patients with more severe frontal dysfunction. The additional dorsolateral frontal, and dorsomedial thalamic, dysfunction in the Responders may support potential frontal executive improvement with cholinergic stimulation in spite of an absent cognitive response to treatment in our patients. Nonresponders had no frontal dysfunction, and little paralimbic dysfunction, compared with Unchanged patients at baseline. (The right temporal pole was the only paralimbic region significantly hypoperfused in the Nonresponders.)
The AD patients who demonstrated a behavioral response to cholinergic treatment in this study showed a significant improvement in irritability and disinhibition. This particular baseline behavioral profile and response were not determined by the strategy used to separate the two groups in this study. The separation strategy, based on prior studies,4,15 used only the total NPI score; the subscore profile was an independent outcome. Similarly, the separation strategy did not determine the orbitofrontal perfusion defect in the Responders at baseline. The shared “orbitofrontal syndrome” of euphoria, disinhibition, and irritability accompanied by orbitofrontal perfusion defects was the major finding in the study and was not predicted by the separation strategy. Ascertaining whether or not this behavioral-perfusion pattern predicts treatment response in future patients will require prospective testing.
This uncontrolled retrospective study must be interpreted cautiously. It is hampered by having a small number of subjects, and without a placebo control group the NPI change scores may merely reflect a regression to the mean. Furthermore, whether or not cholinesterase inhibitor therapy worsens behaviors in AD patients cannot be determined by this study because of the lack of a placebo group. Generating a placebo group for future treatment studies in AD will, however, be difficult, if not unethical, given the symptomatic improvement afforded by currently available interventions.
The current study offers the following testable hypotheses for future inquiry: 1) AD patients who respond behaviorally to cholinesterase inhibitor therapy will have significantly worse baseline paralimbic function than behavioral nonresponders, and 2) post-treatment functional imaging in AD patients who respond behaviorally to cholinesterase inhibitor therapy will demonstrate a significant activation in paralimbic function compared with baseline imaging studies. Future subgroup analyses should seek to uncover the baseline profile of those AD patients who demonstrate clinically meaningful response to treatment.
ACKNOWLEDGMENTS
Support for this work was provided by a National Institute on Aging (NIA) career development award (K08 AG100784) to M.S.M., an NIA Alzheimer's Disease Research Center grant (P50 AG16570), an Alzheimer's Disease Resources Center of California grant, the Sidell-Kagan Foundation, the Human Brain Project (NIMH/NIDA: P20MH/DA52176, the National Science Foundation (BIR9322434), the National Center for Research Resources (RR05956), and a Public Health Service grant to the UCLA Clinical Research Center (No. 5 MO1 RR00865-24).

FIGURE 1. Mean Neuropsychiatric Inventory (NPI) composite scoresa for Responders and Nonresponders to donepezil at baseline (top) and NPI change from baseline distribution (bottom) for all AD patients in the study referenced to the possible response distribution at 10 mg found in Mega et al4
aThe scores are composites for frequency (0–3) times severity (0–4).
bSignificantly different between groups (n=10 in each group, bootstrap P≤0.05).
cSignificantly different between groups (n=10 in each group, bootstrap P≤0.001).

FIGURE 2. Mean Neuropsychiatric Inventory (NPI) composite scoresa for Responders (top) and Nonresponders (bottom) to donepezil at baseline and at week 8 of therapy (10 mg/day)
aThe scores are composites for frequency (0–3) times severity (0–4).
bSignificantly different from baseline (n=10, bootstrap P≤0.05).
cSignificantly different from baseline (n=10, bootstrap P≤0.001).

FIGURE 3. Statistical maps (with Z-scores linked to color scale) derived from normalized brain perfusion studies, as measured by [99mTc]HMPAO single-photon emission computed tomographyThe maps reflect regions with significantly lower (top) and higher (bottom) baseline perfusion in 10 Alzheimer's disease patients who were behavioral Responders to cholinesterase inhibitor therapy, as measured by the Neuropsychiatric Inventory, compared with 10 demographically and cognitively similar Nonresponder AD patients. Talairach atlas26 locations of brain regions' peak significance for the two statistical maps shown here are listed in Table 2.

FIGURE 4. Statistical maps (with Z-scores linked to color scale) derived from normalized brain perfusion studies, as measured by [99mTc]HMPAO single-photon emission computed tomography, comparing Responders and Nonresponders with 10 demographically similar Unchanged AD patientsThe map reflects hypothesis-driven orbitofrontal regions with significantly lower baseline perfusion in behavioral Responders (A) and nonhypothesized regions that survived a Bonferroni correction (B), as well as regions in Nonresponders with significantly lower baseline perfusion compared with Unchanged patients surviving a Bonferroni correction (C). No regions were found with significantly higher baseline perfusion in Responders or Nonresponders compared with Unchanged patients that survived a Bonferroni correction. Talairach atlas26 locations of brain regions' peak significance for the three statistical maps shown here are listed in Table 3.
 |
 |
 |
 |
1 Cummings JL, Kaufer D: Neuropsychiatric aspects of Alzheimer's disease: the cholinergic hypothesis revisited. Neurology 1996; 47:876–883Crossref, Medline, Google Scholar
2 Kaufer DI, Cummings JL, Christine D: Effect of tacrine on behavioral symptoms in Alzheimer's disease: an open-label study. J Geriatr Psychiatry Neurol 1996;9:1–6Google Scholar
3 Cummings JL, Cyrus PA, Ruzicka BB, et al: The efficacy of metrifonate in improving the behavioral disturbances of Alzheimer's disease. Neurology 1998;50:A251Google Scholar
4 Mega MS, Masterman DM, O'Connor SM, et al: The spectrum of behavioral responses with cholinesterase inhibitor therapy in Alzheimer's disease. Arch Neurol 1999; 1388–1393Google Scholar
5 Cummings JL, Gorman DG, Shapira J: Physostigmine ameliorates the delusions of Alzheimer's disease. Biol Psychiatry 1993; 33:536–541Crossref, Medline, Google Scholar
6 Sunderland T, Tariot PN, Newhouse PA: Differential responsivity of mood, behavior, and cognition to cholinergic agents in elderly neuropsychiatric populations. Brain Res Brain Res Rev 1988; 13:371–389Crossref, Google Scholar
7 Starkstein SE, Vazquez S, Petracca G, et al: A SPECT study of delusions in Alzheimer's disease. Neurology 1994; 44:2055–2059Google Scholar
8 Sultzer DL, Mahler ME, Mandelkern MA, et al: The relationship between psychiatric symptoms and regional cortical metabolism in Alzheimer's disease. J Neuropsychiatry Clin Neurosci 1995; 7:476–484Link, Google Scholar
9 Mentis MJ, Weinstein EA, Horwitz B, et al: Abnormal glucose metabolism in the delusional misidentification syndromes: a positron tomography study in Alzheimer's disease. Biol Psychiatry 1995; 38:438–449Crossref, Medline, Google Scholar
10 Mega MS, Lee L, Dinov ID, et al: Cerebral correlates of psychotic symptoms in Alzheimer's disease. J Neurol Neurosurg Psychiatry (in press)Google Scholar
11 Davis KL, Hollander E, Davidson M, et al: Induction of depression with oxotremorine in patients with Alzheimer's disease. Am J Psychiatry 1987; 144:468–471Crossref, Medline, Google Scholar
12 Whitehouse P: Intraventricular bethanechol in Alzheimer's disease: a continuing controversy. Neurology 1988; 38:307–308Crossref, Medline, Google Scholar
13 Newhouse PA, Sunderland T, Tariot PN, et al: Intravenous nicotine in Alzheimer's disease: a pilot study. Psychopharmacol (Berl) 1988; 95:171–175Crossref, Medline, Google Scholar
14 Cummings JL, Mega MS, Gray K, et al: The Neuropsychiatric Inventory: comprehensive assessment of psychopathology in dementia. Neurology 1994; 44:2308–2314Google Scholar
15 Morris JC, Cyrus PA, Orazem J, et al: Metrifonate benefits cognitive, behavioral, and global function in patients with Alzheimer's disease. Neurology 1998; 50:1222–1230Google Scholar
16 McKhann G, Drachman D, Folstein M, et al: Clinical diagnosis of Alzheimer's disease: report of the NINCDS-ADRDA Work Group, Department of Health and Human Services Task Force on Alzheimer's Disease. Neurology 1984; 34:939–944Crossref, Medline, Google Scholar
17 Cummings JL, Benson DF, LoVerme S: Reversible dementia: illustrative cases, definition, and review. JAMA 1980; 243:2434–2439Google Scholar
18 Folstein MF, Folstein SE, McHugh PR: “Mini-Mental State”: a practical method for grading the mental state of patients for the clinician. J Psychiatry Res 1975; 12:189–198Crossref, Medline, Google Scholar
19 Rogers SL, Farlow MR, Doody RS, et al: A 24-week, double-blind, placebo-controlled trial of Aricept® in patients with Alzheimer's disease. Neurology 1998; 50:136–145Crossref, Medline, Google Scholar
20 Efron B, Tibshirani R: Statistical data analysis in the computer age. Science 1991; 253:390–395Crossref, Medline, Google Scholar
21 Woods RP, Grafton ST, Watson JDG, et al: Automated image registration, II: intersubject validation of linear and nonlinear models. J Comput Assist Tomogr 1998; 22:153–165Crossref, Medline, Google Scholar
22 Evans AC, Collins DL, Holmes CJ: Automated 3D regional MRI segmentation and statistical probabilistic anatomical maps, in Human Brain Mapping: The Methods, edited by Toga AW, Mazziotta JC. New York, Academic Press, 1996, pp 123–130Google Scholar
23 Dinov ID, Mega MS, Thompson PM, et al: Analyzing functional brain images in a probabilistic atlas: a validation of sub-volume thresholding. J Comput Assist Tomogr 2000; 24:128–138Crossref, Medline, Google Scholar
24 Price JL, Davis PB, Morris JC, et al: The distribution of tangles, plaques and related immunohistochemical markers in healthy aging and Alzheimer's disease. Neurobiol Aging 1991; 12:295–312Crossref, Medline, Google Scholar
25 Braak H, Braak E: Neuropathological staging of Alzheimer-related changes. Acta Neuropathol 1991; 82:239–259Crossref, Medline, Google Scholar
26 Talairach J, Tournoux P: Principe et technique des etudes anatomiques [Principles and techniques of anatomical studies], in Co-Planar Stereotaxic Atlas of the Human Brain, 3-Dimensional Proportional System: An Approach to Cerebral Imaging, edited by Rayport M. New York, Thieme Medical, 1988Google Scholar
27 Mega MS, Cummings JL, Salloway S, et al: The limbic system: an anatomic, phylogenetic, and clinical perspective. J Neuropsychiatry Clin Neurosci 1997; 9:315–330Link, Google Scholar
28 Logue V, Durward M, Pratt RTC, et al: The quality of survival after an anterior cerebral aneurysm. Br J Psychiatry 1968; 114:137–160Crossref, Medline, Google Scholar
29 Hunter R, Blackwood W, Bull J: Three cases of frontal meningiomas presenting psychiatrically. British Medical Journal 1968; 3:9–16Crossref, Medline, Google Scholar
30 Bogousslavsky J, Regli F: Anterior cerebral artery territory infarction in the Lausanne stroke registry. Arch Neurol 1990; 47:144–150Crossref, Medline, Google Scholar
31 Hunter R, Wyper DJ, Patterson J, et al: Cerebral pharmacodynamics of physostigmine in Alzheimer's disease investigated using single-photon computed tomography. Br J Psychiatry 1991; 158:351–357Crossref, Medline, Google Scholar