The Clinical Role of Computerized EEG in the Evaluation and Treatment of Learning and Attention Disorders in Children and Adolescents
Abstract
Quantitative EEG (QEEG) can play an important role in the evaluation and treatment of children and adolescents with attention deficit and learning disorders. Children with learning disorders are a heterogeneous population with QEEG abnormality in 25% to 45% of reported cases. EEG slowing is the most common abnormal finding, and the nature of the QEEG abnormality may be related to future academic performance. Children with attention disorders are a more homogeneous population, with QEEG abnormalities in up to 80%. In this population, frontal/polar regions are most likely to show deviations from normal development, with the thalamocortical and/or septal-hippocampal pathways most likely to be disturbed. QEEG shows high sensitivity and specificity for distinguishing normal children and children with learning disorders and attention disorders from each other and may provide useful information for determining the likelihood that children with attention problems will respond to treatment with stimulant medication.
This review will examine the clinical role of the electrophysiological evaluation of brain function in children and adolescents with learning and attention disorders. The focus will be on computerized methods of quantifying EEG features and the clinical utility of comparing features obtained from specific patient populations against normative values. The current status of quantitative EEG (QEEG) studies will be reviewed with the goal of extracting information that would be useful to the practicing clinician.
Although some controversy exists over the routine use of QEEG in neurological and psychiatric patients, even the most critical reviews indicate that QEEG can be an adjunct to conventional EEG interpretation. These selective reviews of the literature conclude that QEEG may be useful in patients with possible cardiovascular disease or dementia, although QEEG is considered to be under investigation in patients with postconcussion syndrome, mild to moderate head injury, learning and attention disorders, schizophrenia, and mood disorders.1,2 Two recent papers used more extensive literature citations and concluded that QEEG can play an important role in patients with suspected cardiovascular accidents and those with possible dementia, learning and attention problems, mood disorders, and postconcussion syndrome, as well as in mild to moderate head injury cases.3,4
The possible clinical uses of QEEG were described in a recent position paper of the American Medical Electroencephalographic Association,5 and a more recent review prepared for the American Psychiatric Electrophysiological Association summarized evidence for the clinical utility of QEEG in dementia, mood disorders, mild head injury, learning disabilities and attention disorders, and schizophrenia.3 The clinical roles included the detection of organicity as the underlying cause of brain dysfunction, along with possible roles in differential diagnosis and epileptic source localization. To this list we add possible roles in determining appropriate medication selection, in following treatment response, and in delineating the underlying etiology of learning and attention disorders.
Within this review, QEEG studies will be examined as they relate to these clinical uses, omitting studies of epileptic source localization that are beyond the scope of this paper. In addition, because appropriate use of QEEG requires an adequate examination of the collected EEG via conventional methods (visual inspection) prior to quantification, relevant EEG studies and their clinical utility will also be examined.
STUDIES OF SPECIFIC DEVELOPMENTAL DISORDERS
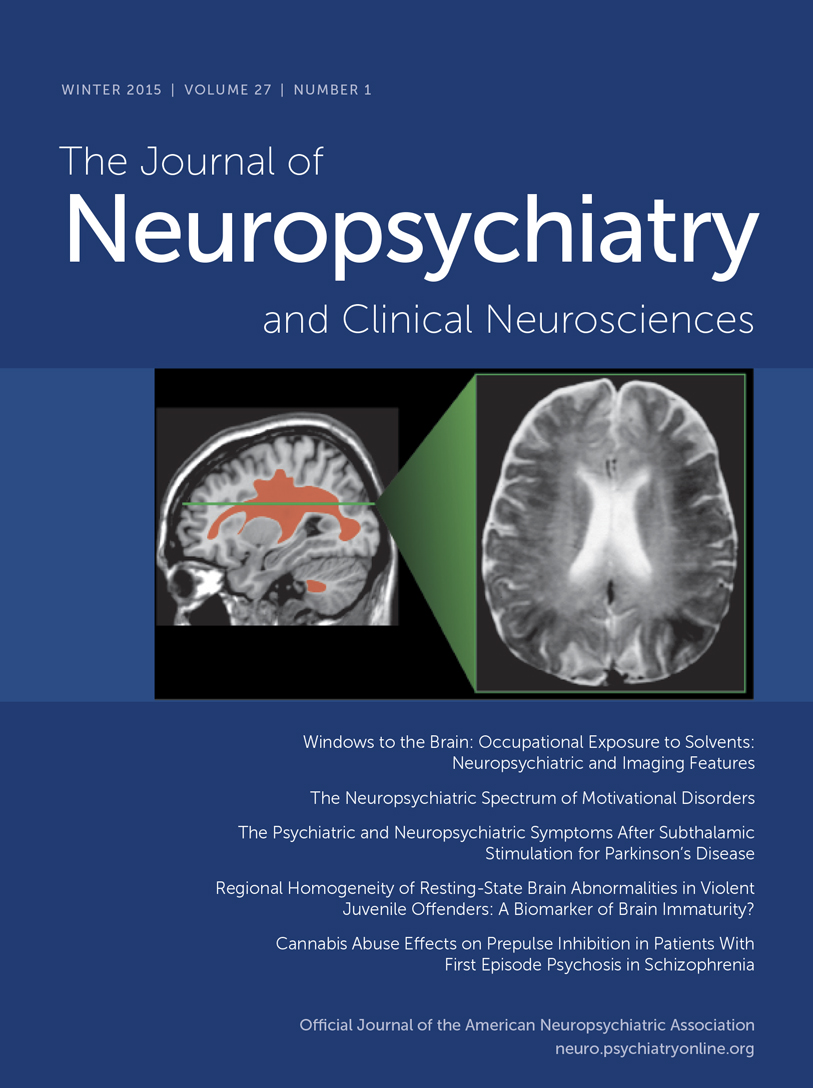
The majority of EEG and QEEG studies of children with learning disorders (LD) have used children with reading disorders as subjects, often with no information provided about the presence or absence of concomitant attention problems. Although most of these studies excluded children with hyperactivity, it is impossible to determine whether children with attention deficit disorder without hyperactivity were included. Separate sections of this review will focus on specific learning and attention deficit disorders, although we will attempt to document findings comparisng these disorders when the literature warrants and when our own QEEG studies are presented. Different criteria for documenting a specific developmental disorder were used across studies, although normal full-scale IQ was usually required for inclusion. Most studies in the literature were based on small restrictive samples primarily comprising males within the 7- to 12-year age range, although females are represented in some studies.
EEG Studies
A variety of EEG abnormalities have been described in individuals with dyslexia and related disorders, including poor EEG rhythm, low-voltage background rhythms,6 and increased generalized slowing.7 However, the clinical utility of these findings has been questioned because of a lack of specificity.8 Two subsequent studies provided more clinically relevant information.9,10 EEG abnormalities were found in 24.6% of a sample of 61 children with learning disorders and in only 3.3% of control subjects. Abnormalities in the children with learning disorders included increased high-amplitude atypical alpha, abnormal focal paroxysmal activity, excess focal delta, persistent delta asymmetry, and excessive EEG response to hyperventilation. These abnormalities were most likely to occur in those LD children with significant pre- and/or postnatal risk factors for brain injury.9 Similarly, 48% of a sample of 23 boys with severe spelling problems (normal IQ without attention problems) were found to have abnormal EEGs in comparison to 25% of the normal control subjects. The two groups differed only on non-paroxysmal abnormalities (43.5% vs. 14.3%), which included generalized and focal temporal EEG slowing.10 Thus, EEG studies indicate that specific developmental disorders are associated with abnormal EEGs in 25% to 43.5% of these children, with EEG slowing the most common abnormality noted. Studies addressing the specificity of these findings across different related diagnostic categories are not available.
QEEG Studies
QEEG studies of eyes-closed resting EEG in dyslexia have resulted in inconsistent findings that included reports of alpha deficit and elevated alpha and/or beta power.10 However, the finding of increased theta and decreased alpha in LD children has been replicated. Children with learning disorders without hyperactivity, but with attention problems, showed increased theta and low alpha power.11 Separate groups of hyperactive and learning-disordered children have been shown to have both decreased alpha and beta power in comparison to normal control subjects.12 Data suggesting that the nature of QEEG abnormalities in LD may change with age have also been published.13 Although 8- and 9-year-olds both showed decreased alpha, the topographic distribution differed, and the 10-year-olds also showed focal theta excess. This age effect has not been replicated. The work of John and associates14 would suggest that when age-regression QEEG equations are used to compare normal subjects and LD children, age effects disappear. The discrepant results of the above studies most likely reflect differences in patient selection criteria, as well as differences in the locations of recording electrodes. For example, no differences were reported between normal control subjects and a highly screened sample of boys with pure dyslexia selected from several hundred children.15,16 An examination of QEEG abnormalities across a wide topographic distribution of recording sites and a large sample of children with learning disorders reveals most of the QEEG abnormalities described above in subsets of these children.14
Normative Data Bases and Neurometric QEEG
John and associates14,17 have developed a data base of QEEG features obtained from a large sample of normal children between the ages of 6 and 17 years. Large samples of children with both generalized (LD) and specific learning disorders (SLD), as well as children with neurological disorders, have had their QEEGs compared with this normal data base. QEEG features extracted from 8 bipolar channels of eyes-closed resting EEG were used to compare brain activity in LD/SLD populations with the normative data base, a process called neurometrics.18,19 The neurometric QEEG technique is a sensitive indicator of cortical electrophysiological dysfunction in children and adults with neurological and/or psychiatric disorders. The age-regression QEEG equations developed by this group replicated the earlier work of Matousek and Petersen,20 have been extensively replicated by others, and have been found to be free of cultural and ethnic bias.16,21,22 The repeated replication of these age-regression equations justifies their generalized clinical application.23 A recent review documents the clinical utility of both conventional and neurometric QEEG in adult and child psychiatric disorders.3
Neurometric QEEG in Learning Disorders
Abnormal QEEGs were found in 32.7% of the SLD and 38.1% of the LD groups, whereas only 5.5% of an independent sample of normal children had abnormal QEEGs.24 The percentage of children showing various types of frequency abnormalities was also presented; these included increased delta and/or theta and decreased alpha relative power, all indicating EEG slowing. Discriminant analyses using six multivariate features resulted in 80% correct classification of normal children (87% replication) and 72% correct classification of LD children (65% replication). When the other samples of children were tested against this normal/LD discriminant, 47% of the SLD children and 70% of the children with neurological disorders were classified as abnormal. Further differential classification of these samples of children was not described.14
Using similar neurometric techniques, Harmony and associates25–27 have further elucidated the nature of neurophysiological abnormality in children with documented learning disorders. Children with learning disorders were shown to have different patterns of brain maturation than normal control subjects. Within normal subjects, there is an increase of posterior/vertex EEG coherence and a decrease in coherence among frontal recordings with increased age. This suggests increased differentiation of frontal cortical regions and increased communication across basic sensory and association cortex with increased age. These systematic maturational changes are often not seen in children with learning disorders. Instead, they show no change in posterior/vertex coherence with age, and levels of frontal coherence remain high across all ages. Thus, as indexed by changes in EEG coherence, children with learning disorders have brain maturation patterns that do not show a maturational lag, but rather a deviation from normal development.26 This finding has been replicated by others using different but converging QEEG feature sets. Decreased spatial differentiation of the EEG has been reported in children with spelling problems,10 and the structure of the parietal/temporal and occipital EEG could be explained by a single factor in children with specific reading disorders, whereas three factors were required in normal control subjects.28
Neurometric QEEG abnormalities have also been shown to be directly related to academic performance carefully documented in both reading and writing. Increased delta and/or theta power and decreased alpha power were associated with a poor educational evaluation; increased theta and/or decreased alpha were associated with mildly abnormal evaluations; and increased alpha and decreased theta were associated with good evaluations. Theta excess with alpha deficit was described as reflecting maturational lag, whereas delta excess indicated cerebral dysfunction.25 Clearly this study by Harmony and colleagues has implications for the design of remediation programs. QEEG can be used to indicate which children with learning problems have a measurable underlying neurophysiological dysfunction and which do not. This information may be useful for optimizing treatment choice selection. A summary of all EEG and QEEG studies included in the preceding review of learning disorders can be found in Table 1.
STUDIES OF ATTENTION DEFICIT DISORDER WITHOUT (ADD) AND WITH HYPERACTIVITY (ADHD)
EEG Studies
In a recent review of EEG studies of children with ADHD, it was concluded that between 30% and 60% of such children showed abnormal EEG findings, including generalized and/or intermittent slowing. Further, there was some evidence that the EEG abnormalities decreased with age, with contradictory reports of poor or no correlation between abnormal EEGs and treatment response.29 In the most comprehensive EEG study found, EEGs were recorded for 66 pervasively hyperactive children while they were mildly sedated with chloral hydrate.30 From this sample, 48.5% were found to have abnormal EEGs, including findings of 14-Hz and 6-Hz spiking and diffuse and focal slowing. However, only 1 of 11 ADHD children was found to have an abnormal EEG in a recent study in which the authors conclude that routine EEG screening is of limited value in childhood behavior problems.31
QEEG Studies
Several QEEG studies have been conducted in children with attention deficit disorder with and without hyperactivity. QEEG differences found between normal children and those with attention problems varied as a function of the presence or absence of hyperactivity, the nature of the EEG recording environment, and the topographic loci of the recording channels utilized. The effect of the presence or absence of a coexisting learning disorder has not been investigated. Only one QEEG study was found that examined differences between ADHD children with and without a coexisting learning disorder. This study had 10 children in each group and reported no QEEG differences between the ADHD children with and without learning disorders.12 We found that most studies used small samples of ADD and/or ADHD children with eyes-open EEG recordings made from two or three leads within the central, parietal, or occipital regions. The results from these studies were relatively consistent. Hyperactive children have been reported to show decreased 10-Hz activity (within the alpha frequency band) and increased coherence within hemispheres,32 and decreased alpha and beta activity.12,33 Central and parietal/occipital deficits of alpha and beta may characterize the eyes-open EEG of hyperactive children. Using larger samples of ADHD boys across a greater age range, Satterfield et al.34 reported different patterns of QEEG abnormality as a function of age. ADHD boys older than 90 months showed increased alpha and beta power, whereas ADHD boys who were less than 90 months old showed decreased power across all frequency bands. These findings may be specific to the recording conditions used, since children were viewing a cartoon during recording. This would produce an EEG pattern reflecting the cognitive activation caused by visual and auditory processing. Clearly, studies of large samples of ADD children across extended age ranges, covarying for hyperactivity and learning disorder variables and using standardized EEG recording conditions, must be accomplished before the clinical utility of QEEG for this class of disorder can be verified. We will provide data from such a study in later sections of this review.
When the number of recording channels is increased and/or larger samples of children are tested, more consistent patterns of QEEG abnormality are found. Samples of 21 Japanese, 41 Chinese, and 29 Korean ADHD children had eyes-closed resting EEGs that were characterized by increased delta and fast theta, with decreased alpha activity over left central and/or occipital regions, when compared with age-matched normal subjects and those with conduct disorders.35 Generalized theta excess has been found in ADHD children in both the resting state and during cognitive activity.36 It has been further reported that this generalized theta excess may be accompanied by deficits in alpha and beta and that the degree of abnormality is greater in ADHD children of the combined subtype than in ADHD children of the primarily inattentive subtype.37 Regional differences between ADHD and normal subjects' QEEG findings have also been reported. Eyes-open resting EEG was recorded from 16 channels in 25 ADD males without hyperactivity and learning problems (9–12 years old), and 25 age-matched normal control subjects.38 The QEEG of these ADD boys was characterized by generalized theta excess and beta deficit, with the theta excess greater in frontal/temporal regions and the beta deficit greatest in temporal and posterior regions. The size of these differences increased when the EEG was recorded during reading or drawing. Eyes-open QEEG was recorded from 26 ADHD adolescents,39 with increased theta and alpha 1 (8.0–9.0 Hz) absolute power seen in anterior regions, increased alpha 1 over right-hemisphere regions, and decreased beta relative power in posterior regions. An increase in the theta/beta power ratio obtained from a single vertex recording with eyes-open has recently been used to classify 176 ADHD-inattentive subtype, 221 ADHD-hyperactive subtype, and 85 control children and adults, with reported sensitivity of 86% and specificity of 98%.40
Discriminant Classification Studies
Stepwise discriminant analyses have been used to evaluate the clinical utility of QEEG recordings in ADHD and ADD children. A discriminant function correctly classified 80% of the ADD and 74% of the normal control subjects.38 These discriminant results were similar to those reported by Lubar and colleagues11,41 in ADD children without hyperactivity, but with reading disorders. The eyes-open resting EEG of this sample of children was characterized by an increased theta/beta power ratio, especially in frontal/temporal regions, with 79.2% correct identification of these ADD children against normal control subjects.
EEG and QEEG Studies of Medication Effects in ADHD Children
The relationship between pre-treatment EEG and treatment response to methylphenidate and dextroamphetamine has been studied. It has been reported that male 6- to 9-year-olds with minimal brain dysfunction were more likely to show a favorable response to methylphenidate if abnormal EEG and neurological soft signs were present rather than absent.42 This finding has not been replicated. Halperin et al.30 reported that the presence or absence of EEG abnormalities did not predict subsequent methylphenidate response. QEEG differences have been reported between ADHD responders and nonresponders to psychostimulants. Responders to dextro- or levoamphetamine showed pre-treatment QEEGs characterized by increased predominant beta frequency and nonsignificant increases in theta and alpha power when compared with nonresponders. Increased visual evoked potential values of N220 >250 ms and increased average beta frequency >13 Hz correctly identified 100% of responders and 70% of nonresponders.43 Age-regressed QEEG features extracted from eyes-closed resting EEG collected prior to medication with methylphenidate were used to develop a discriminant function to distinguish responding from nonresponding ADHD boys. Responders were correctly identified 81% of the time and nonresponders 83% of the time. Responders' QEEGs were characterized as showing significant developmental deviation, whereas nonresponders' QEEGs were characterized by significant maturational lag.44 These findings increase the accuracy of the discriminant results over those found by Steinhausen et al.,45 who correctly predicted methylphenidate response in 73.3%, using QEEG features that had not been age-regressed. Two reports in the literature suggest that methylphenidate and/or dextroamphetamine leads to a normalization of the EEG of treatment responsive ADHD boys.46,47 However, in both studies, the sample sizes involved were small and the numbers of QEEG features and recording regions were quite restricted, making this conclusion premature. Interestingly, it has recently been reported that methylphenidate had no global effects on the resting QEEG of ADHD boys despite behavioral and performance improvement.48
FINDINGS FROM AUTHORS' NEUROMETRIC QEEG STUDIES OF ADHD/ADD AND LEARNING DISORDERS
Several relevant neurometric QEEG studies were reviewed in preceding sections of this paper.14,17,24–26,44 In the remainder of this article we review our own previously published studies using neurometric QEEG in the evaluation of children with learning and attention problems49,50,51 and present previously unpublished results that 1) evaluate the nature of QEEG abnormalities in ADHD as a function of age, 2) use cluster analysis techniques to describe QEEG based neurophysiological subtypes of learning and attention disorders, and 3) use variable resolution electromagnetic tomography (VARETA)52 to examine the cortical and subcortical neuroanatomical structures implicated as dysfunctional in each of these subtypes.
The populations of children and the QEEG recording technique involved in our previously published studies and in the new findings to be presented are described below in the Methodology section. A summary of all EEG and QEEG studies included in this section and the preceding review of attention disorders can be found in Table 2A and Table 2B.
Methodology
Normal Population:
All QEEG measures were compared against a data base of 310 normal children between the ages of 6 and 16 years. All “normal” subjects were free of neurological or medical disease, had no history of head injury, or drug or alcohol abuse, were of normal IQ, showed evidence of normal functioning at home and school for the past 2 years, and had not taken any prescription medication for at least 90 days prior to evaluation.
Attention Disorder Population:
All children were referred to the Developmental Paediatrics and Learning Disorders Clinic in Sydney, Australia. Children with histories of epilepsy, drug abuse, head injury, or psychotic disorders were excluded. In the initial visit each child underwent a QEEG and a clinical evaluation by a behavioral neurologist. At this time, the Conners' parent/teacher rating scale and the DSM-III rating scales of inattention, impulsivity, and hyperactivity, measures of reading and math achievement, and the Wechsler IQ test for children were also obtained. The resultant sample consisted of 268 children with normal IQ and 76 with IQ scores between 65 and 85. Within this sample of children, 179 reached DSM-III criteria for ADHD, and 165 for ADD without hyperactivity. A learning disorder secondary to the attention disorder was found in 97 (54.2%) of the ADHD children and 103 (62.4%) of the ADD children. Repeat behavioral and QEEG evaluations were obtained on 130 of these children 6 to 10 months after the initiation of treatment with either methylphenidate or dextroamphetamine.
Learning Disorder Population:
The children with specific learning disorders were obtained from the previously described studies of John and associates.14 Children with problems with hyperactivity were excluded, and all had been selected by their respective school systems because of learning problems. These children had no known neurological disorder. The majority of these children would meet current diagnostic criteria for specific developmental learning disorder. This sample included 127 children (mean age=11.4 years) whose learning disorder occurred in only one academic area and who had normal full-scale IQ scores, and 115 children (mean age=11.8 years) whose learning disorder spanned two or more academic areas and who had full-scale IQ scores between 65 and 84.
QEEG Data Acquisition:
Patients were seated comfortably in a sound- and light-attenuated room during the evaluation. One to two minutes of artifact-free eyes-closed resting EEG was extracted from 20 to 30 minutes of continuous EEG. Monopolar recordings were obtained by using the 19 electrodes of the International 10/20 System referred to electrodes placed on linked earlobes. Bipolar features were constructed by computer during offline analysis. Bipolar locations included left and right frontal/temporal, temporal, central, and parietal/occipital regions. QEEG features computed were absolute and relative power, mean frequency, and inter- and intrahemispheric coherence and asymmetry. Each feature was calculated for the delta, theta, alpha, beta, and total frequency bands for each of the 19 monopolar and 8 bipolar derivations, and compared with the normal data base of children by using Z-scores after age-regression and appropriate mathematical transformations to ensure the Gaussianity of each extracted QEEG measure.
Previously Published Findings
This section summarizes the findings from our previously published research involving children with attention and learning problems as described above.49–51 The majority of ADHD and ADD children in both the normal and low IQ groups showed QEEG abnormalities when compared with the normal data base. QEEG frequency abnormalities occurred in more than 80% of this population, theta and alpha excess being the most prevalent abnormal finding. Frontal and central regions were the most likely to be involved, and when the abnormality was generalized, its magnitude was usually greatest in these regions. Both interhemispheric and intrahemispheric abnormalities were often present. They included 1) hypercoherent theta or alpha activity between left and right frontal recordings and between frontal and temporal recordings within each hemisphere; 2) decreased coherence or incoherence between left and right posterior temporal and parietal regions; 3) frontal/posterior power asymmetry within each hemisphere reflecting increased frontal power; and 4) left/right hemisphere power asymmetry in posterior temporal and parietal regions, with the right hemisphere most likely to show a power excess. Two major subtypes of QEEG abnormality were identified involving theta and/or alpha excess accompanied by either normal or decreased alpha mean frequency. QEEG indices of a maturational lag (i.e., a Z-score that would be normal at a younger age) accounting for the neurophysiological abnormality were present in about 7% of the ADHD/ADD children and were localized mainly in posterior regions. However, QEEG indications of a deviation from normal development (i.e., score not normal at any age) were much more prevalent; they were present in about 35% of these children and were localized mainly to frontal and central regions.50
We used stepwise multivariate discriminant procedures to examine the sensitivity and specificity of several two-way comparisons.49,50 A discriminant function was developed that distinguished normal from ADHD/ ADD children with a sensitivity of 93.7% and a specificity of 88.0%, using QEEG features that reflected the abnormalities described above. QEEG differences between the normal and low-IQ ADHD/ADD children and between the ADHD and ADD children were present but minimal in comparison to the differences between the normal and ADD/ADHD populations. The presence or absence of a secondary learning disorder did not contribute to any of the QEEG differences observed. However, when the ADHD/ADD population was compared with a population of children who had a learning disorder not secondary to an attention problem, QEEG differences were found. ADHD/ADD children could be distinguished from children with learning disorders with a sensitivity of 97.0% and a specificity of 84.2%.
QEEG also proved useful in the management of treatment response to stimulant medication.49,51 Within the ADHD/ADD population, QEEG differences were found between those who showed a short-term (initial response to one dose) positive response to treatment with dextroamphetamine or methylphenidate and those who did not benefit. Although the sensitivity and specificity levels of this discriminant function were modest (68.7% and 67.5%), the function was very accurate (84.8%) in classifying children who had shown a previous negative response to either dextroamphetamine or methylphenidate. Pre-treatment QEEG and behavioral measures showed a sensitivity of 83.1% and a specificity of 88.2% in predicting long-term treatment response to either dextroamphetamine or methylphenidate. Within our ADHD population, 93.7% of the children with alpha excess, 83.3% of those with beta excess, and 75% of those with theta excess showed a positive long-term response to stimulants. None of the ADHD children with an alpha or beta excess showed a negative response to either stimulant, whereas 17.5% of the children with a theta excess showed a negative response to treatment with dextroamphetamine. Within our population of ADD children, 66.7% of the beta excess, 54.5% of the alpha excess, and 33.3% of the theta excess children showed a positive response to stimulant therapy. None of the ADD children with a beta excess showed a negative response to either stimulant, although 1 of 8 ADD children with an alpha excess treated with methylphenidate showed a negative long-term response. In contrast, the likelihood of a negative response to either dextroamphetamine or methylphenidate reached 30% for the children with theta excess. These results and those reported by Monastra et al.40 begin to answer earlier critical questions raised by Levy and Ward about the sensitivity and specificity of QEEG studies for aiding in the diagnosis of ADHD and the possible prediction of medication response in ADHD.53
New QEEG Findings
In this section, two issues are examined that were not completely addressed by our studies described above. The first involves whether QEEG abnormalities in ADHD/ADD children reflect a delay in normal brain maturational processes or instead represent a deviation from normal development. The second issue involves identification of the neurophysiological subtypes that can be seen in the ADHD/ADD and learning disorder populations and an examination of how these subtypes might be related to the basic neurophysiological, neurochemical, and neuroanatomical systems that are involved in attention and learning.
ADHD/ADD: Maturational Lag or Developmental Deviation?
As stated previously, the neurometric QEEG features of maturational lag and developmental deviation indicated that a developmental deviation was present in 35% of our sample and was localized mainly to frontal and central regions, whereas signs of maturational lag were localized in mainly posterior regions and were present in only 7%. To seek further evidence of maturational lag as the underlying neurophysiological mechanism involved in ADHD/ADD, the QEEGs of our ADHD/ADD population were assessed as a function of age. Multiple analyses of variance (ANOVAs) were used to compare relative power, absolute power, mean frequency, power asymmetry, and coherence values across four age ranges: 5–7, 8–10, 11–13, and 14–17 years. The degree of QEEG abnormality remained stable, with no significant systematic decreases in the degree of abnormality occurring across this age span. Thus, when QEEG values are age-regressed, the pattern of normal versus ADHD/ADD differences remains constant from the early school years into late adolescence.
Neurophysiological Subtypes in ADHD/ADD and LD Populations:
Cluster analyses procedures were used to identify the major neurophysiological subtypes within our population of 344 ADHD/ADD and 245 LD/SLD children. In order to comply with the statistical assumptions underlying cluster analyses, we preselected QEEG features and limited the number entered into the analyses in a systematic fashion. The QEEG variables chosen were those for which the highest ANOVA values were obtained when comparing the ADHD/ADD children with normal subjects, the LD/SLD children with normal subjects, and the ADHD/ADD with the LD/SLD children. Further, we selected those variables that showed the greatest variance across the entire population of children. Cluster analyses were performed using 35 QEEG variables that met these criteria. These analyses included measures of relative and absolute power, mean frequency, and interhemispheric and intrahemispheric power asymmetry and coherence. An iterative approach was taken as we examined cluster solutions starting at three clusters and progressing until the next new structure failed to further subdivide the population into clusters with more than 10 members. Thus we examined three-, four-, five-, and six-cluster solutions. The five-cluster solution showed the most clearly defined cluster structure, since the three- and four-cluster solutions contained one very large cluster and the six-cluster solution introduced a new cluster with only 8 members. The cluster analyses were performed on split-half replications of our database as well as on the entire database. The split-half results both were optimal for five clusters and replicated each other and the cluster analysis performed on the entire data set. Thus, the results obtained from the entire data set are presented here.
The significant QEEG findings that distinguish each of these clusters from the normal population follow. Cluster 1 was characterized by a generalized excess of alpha and deficit of delta absolute and relative power, frontal theta and alpha hypercoherence, and parietal and posterior temporal power asymmetry. Cluster 2 was characterized by a generalized excess of theta absolute and relative power, decreased alpha mean frequency, and frontal theta hypercoherence. Cluster 3 was characterized by a generalized deficit of theta, alpha, and beta absolute power, a generalized excess of delta and deficit of alpha relative power, frontal alpha incoherence, and normal power asymmetry values. Cluster 4 was characterized by excess frontal/central delta and theta and a generalized deficit of alpha absolute power; generalized delta and theta excess and an alpha deficit of relative power; decreased theta and alpha mean frequency; frontal and central alpha incoherence; and frontal, central, and temporal power asymmetry. Cluster 5 was characterized by essentially normal QEEG findings, although there was a nonsignificant frontal elevation of delta absolute and relative power.
In this five-cluster solution, more than 98% of the ADHD/ADD children were placed into clusters 1 or 2 (note that in the split-half replication, cluster solutions the figures were 98.6% and 92.1%, respectively). The children with learning disorders were evenly distributed across the five clusters in all cases. Long-term stimulant treatment response data were available on 49 ADD/ADHD children from cluster 1 and on 59 ADD/ ADHD children from cluster 2. Within cluster 1, 75.5% showed a positive response to stimulants,18.4% no measurable change, and 6.1% a negative response. Within cluster 2, 50.8% showed a positive response to stimulants, with 33.9% showing no change, and 15.2% showing a negative response. This finding supports the notion that the two clusters of ADD/ADHD children represent two different neurophysiological subtypes. In addition, as stated previously, a discriminant function has been calculated by using a combination of behavioral and QEEG measures that has high sensitivity and specificity for estimating the likelihood that a positive treatment response will be obtained to stimulant therapy.51
Variable Resolution Electromagnetic Tomography (VARETA)
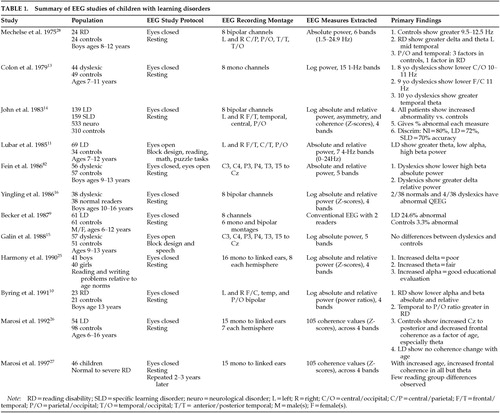
We used VARETA54 in an exploratory fashion to localize possible neural sources of the absolute power frequency abnormality that was most deviant for clusters 1 and 2, which included 98% of the ADHD/ADD children. At the present time, technical problems prevent us from examining the VARETA results for the LD/SLD children. VARETA was accomplished by applying a mathematical inverse solution to the EEG data at the selected frequency.52 The power localized in each voxel of the inverse solution was log- and Z-transformed relative to age-appropriate normative distributions of voxel power at each frequency and depicted on slices obtained from a probabilistic MRI atlas,54a color-coded for statistical significance.55
Figure 1 presents the VARETA images for the average of the 5 children closest to the centroid of clusters 1 and 2, respectively. The three panels on the left side of the figure present average VARETA images from the children in cluster 1 at 11 Hz, and the three panels on the right the images from cluster 2 children at 5.4 Hz. VARETA images from cluster 1 show primarily cortical abnormalities that are maximal and appear to originate in the right parietal cortical region. VARETA images from cluster 2 show primarily temporal cortical and hippocampal abnormalities. VARETA images at 5.4 Hz for cluster 1 and at 11 Hz for cluster 2 were within normal limits and are not presented.
OTHER IMAGING STUDIES
MRI Studies in ADHD
Several magnetic resonance imaging studies (MRI) have been conducted by investigators comparing brain structure in normal and ADHD children and adolescents. Across seven studies, a total of 106 ADHD, 10 dyslexic, and 37 Tourette's syndrome patients were examined. Findings across these studies have been quite consistent, especially in noting structural abnormalities in ADHD that involved the frontal/striatal system and intrahemispheric and/or interhemispheric white matter projections. Frontal abnormalities reported were decreased right hemisphere anterior width, decreased right anterior/superior volume, and decreased bilateral anterior/ inferior volume.56,57 Dyslexic children also showed decreased right anterior width.58 ADHD children showed a whole-head decrease in white matter and decreased volume of the corpus callosum, with the greatest decreases found in the rostral body, the genu, the splenium, and the area anterior to the splenium.57–60 Increased corpus callosum area has been reported in patients with Tourette's syndrome.59 Structural differences between normal subjects and adolescents with ADHD were also found to involve the caudate nuclei, although there is some disagreement in such findings. Decreased right caudate area and volume have been reported,61,62 as has a decrease in left total caudate volume,57 although a lack of the right-greater-than-left caudate asymmetry found in normal subjects may bring these three studies into agreement. The possible clinical relevance of these structural abnormalities was recently supported by the report of a significant relationship between performance of ADHD children on response inhibition tasks and the presence of prefrontal cortex, caudate nuclei, and globus pallidus MRI abnormalities.63
PET and SPECT Imaging Studies in ADHD
Five positron emission tomography (PET) or single-photon emission tomography (SPECT) studies have been published that examine brain glucose metabolism or regional cerebral blood flow in ADHD and control populations. Within these studies, a total of 93 ADHD patients, 19 normal subjects, and 6 mixed psychiatric control patients were tested. Decreased glucose metabolism and decreased rCBF were seen in left frontal cortical regions.64,65 Decreased perfusion was seen in bilateral prefrontal cortical regions in the majority of ADHD children tested, although 65% showed this decrease only during concentration, with 12% showing the abnormality only when resting.66 Decreased glucose metabolism was reported to occur in right temporal and posterior temporal cortical regions with decreased rCBF in the left parietal region.64,65 Decreased rCBF or perfusion has been reported to occur in striatal (caudate nuclei and putamen), thalamic, and hippocampal regions as well.67,68
PROPOSED NEUROPHYSIOLOGICAL MODEL OF ADHD/ADD
The results of the cluster analyses described above indicate that the major QEEG frequency abnormalities seen in ADHD/ADD involve excess of theta or alpha absolute and/or relative power. Further, evidence exists that two different but interconnected neural systems are involved in the generation of EEG within the theta and alpha frequency bands.69,70 Theta appears to be generated within the septal-hippocampal pathway, whereas the alpha frequency involves thalamocortical and cortical-cortical circuitry. Within the theta generating septal-hippocampal pathway, the septal nucleus and the nucleus accumbens receive inhibitory modulation through dopaminergic innervation from the ventral tegmental area, via dopamine D2 receptors.71,72 Cholinergic efferents modulate hippocampal and cingulate cortex, with these hippocampal pathways acting to regulate the septal nucleus. Thus, a theta excess can occur with an overactivation of the septal-hippocampal pathway or secondarily via disinhibition from negative dopaminergic regulation.73 Within the thalamocortical alpha-generating pathway, several different perturbations can result in an alpha excess. This thalamic pathway receives positive modulation from the midbrain reticular formation via acetylcholine, and negative regulation through the nucleus reticularis of the thalamus via gamma-aminobutyric acid, with further modulation via the dopaminergic striatal/nigral system. Disregulation of this system can lead to an alpha excess by 1) hyperactivation of the thalamus that may be secondary to overstimulation of the midbrain reticular formation due to decreased modulation via the dopaminergic nigral system or 2) hypoactivation of the prefrontal cortex and a resulting disinhibition from nucleus reticularis. Thus, both theta and alpha excess might result from low dopamine levels, and our QEEG findings, as well as the neuroimaging studies described above, are in agreement with the dopaminergic theory of ADHD expressed by Levy,74 which conceptualizes ADHD as a disorder of the polysynaptic dopaminergic circuits between prefrontal and striatal centers of activity. These findings are also compatible with the neurophysiological model of ADHD proposed by Niedermeyer and Naidu,75 which also emphasizes prefrontal, frontal, and striatal and thalamic interconnections.
The pharmacological literature also supports the hypothesis that ADHD is a heterogeneous disorder that can result from disturbances in the neurophysiological systems involved in the generation of the theta and alpha frequency bands. Children with ADHD often show differential responses to treatment with dextroamphetamine versus methylphenidate. Recently Lin et al.76 reported that in cats, although both stimulants activate the whole brain, dextroamphetamine has a greater influence on the stria terminalis and methylphenidate is more active in the mediofrontal cortex, which contains the cingulate gyrus. These sites are part of the two systems hypothesized as being involved in the generation of the theta and alpha frequency bands. Behavioral and neurophysiological studies of the localization of attention processes indicate that the septal/hippocampal circuit in conjunction with the prefrontal cortex provides for mechanisms of selective attention and general expectancy processes,77 with thalamic nuclei part of the cortical-limbic-reticular network of attention function.78,79 Our findings involving the localization of QEEG frequency abnormality mainly to frontal and central cortical regions often accompanied by posterior interhemispheric coherence and symmetry abnormality, taken in conjunction with the MRI and PET findings described above, are in agreement with current neuroanatomical theories of attention processes.80,81 These theories suggest that attentional processes involve the right hemisphere and are divided into an anterior system (involving cingulate cortex) that serves executive and control functions and a posterior system (localized in the parietal, posterior temporal, and occipital cortex) that is responsible for selective and shifting attention .
The above-mentioned studies indicate substantial agreement across QEEG, MRI, and PET imaging studies, as well as across behavioral, pharmacological, and neuroanatomical studies, on the nature of cortical and subcortical disturbances in function that characterize children with attention and learning problems. In our opinion, attention deficit disorder cannot be conceptualized as a single disease entity with a very narrow phenotype and a distinct etiology. Rather, it represents a spectrum of disorders that may be represented by different neurophysiological subtypes present within the population of children with attention and learning problems.
QEEG may prove to be the most clinically relevant imaging technique for use in children with attention and learning problems. It has several advantages over other neuroimaging techniques, including the following: QEEG is less expensive, less invasive, easier to perform, and has the largest patient data base indicating the presence of different subtypes of attention and learning disorders that maybe differentially amenable to various treatment approaches. Further, with the emergence of EEG biofeedback treatment techniques, a direct application of QEEG for determining QEEG biofeedback treatment parameters may be possible.

FIGURE 1. Quantitative EEG variable resolution electromagnetic tomography (QEEG VARETA) 3D images for two clusters of attention deficit disorder patients with different long-term responsiveness to stimulantsThese images at narrow-band frequency values were selected because they reflect the maximal differences between cluster 1 (left panels, at 11 Hz) and cluster 2 (right panels, at 5.4 Hz). At each selected frequency, the average VARETA for the 5 patients closest to the centroid of cluster 1 and cluster 2 are shown. The corresponding panels for cluster 1 patients at 5.4 Hz and cluster 2 patients at 11 Hz fell within normal limits and are not presented. Images associated with cluster 1 show primarily cortical abnormalities (seen most clearly in the bottom panel on the left) that are maximal and that appear to originate in the right parietal cortical region. Images associated with cluster 2 show primarily temporal cortical and hippocampal abnormalities (seen most clearly in the top and middle panels on the right).The three panels in each set present four transaxial VARETA images in 7-mm slices as depicted in the brain model in the bottom right portion of each panel. These 7-mm slices start at the base of the brain (top panels) and progress through the middle of the brain (middle panels) to the top of the brain (bottom panels). Color coding is in standard deviation units, with white representing normal activity, red to yellow shades excess activity, and purple to light blue a deficit of activity. The VARETA software was developed by Dr. P. Valdes-Sosa and colleagues at the Cuban Neuroscience Center.55 The superimposition of sources uses the probabilistic MRI atlas software developed by Dr. A. C. Evans and colleagues at the Montreal Neurological Institute.54
 |
 |
1 Nuwer M: Assessment of digital EEG, quantitative EEG and EEG brain mapping: report of the American Academy of Neurology and the American Clinical Neurophysiology Society. Neurology 1997; 49:277-292Crossref, Medline, Google Scholar
2 Nuwer MR: Assessing digital and quantitative EEG in clinical setting. J Clin Neurophysiol 1998; 15:458-463Crossref, Medline, Google Scholar
3 Hughes JR, John ER: Conventional and quantitative electroencephalography in psychiatry. J Neuropsychiatry Clin Neurosci 1999; 11:190-208Link, Google Scholar
4 Thatcher RW, Moore N, John ER, et al: QEEG and traumatic brain injury: rebuttal of the American Academy of Neurology 1997 report by the EEG and Clinical Neuroscience Society. Clin Electroencephalogr 1999; 30:94-98Crossref, Medline, Google Scholar
5 Duffy FH, Hughes JR, Miranda F, et al: Status of quantitative EEG (qEEG) in clinical practice, 1994. Clin Electroencephalogr 1994; 25:vi-xxiiGoogle Scholar
6 Hughes JR: Electroencephalographic and neurophysiological studies in dyslexia, in Dyslexia: An Appraisal of Current Knowledge, edited by Benton A, Peal D. New York, Oxford University Press, 1978, pp 207-240Google Scholar
7 Byring R, Jarvilehto T: Auditory and visual evoked potentials of schoolboys with spelling disabilities. Dev Med Child Neurol 1985; 27:141-148Crossref, Medline, Google Scholar
8 Conners CK: Critical review of electroencephalographic and neurophysiologic studies in dyslexia, in Dyslexia: An Appraisal of Current Knowledge, edited by Benton A, Peal D. New York, Oxford University Press, 1978, pp 251-261Google Scholar
9 Becker J, Velasco M, Harmony T, et al: Electroencephalographic characteristics of children with learning disabilities. Clin Electroencephalogr 1987; 18:93-101Medline, Google Scholar
10 Byring RF, Salmi T, Sainio K, et al: EEG in children with spelling disabilities. Electroencephalogr Clin Neurophysiol 1991; 79:247-255Crossref, Medline, Google Scholar
11 Lubar JF, Bianchini KJ, Calhoun WH, et al: Spectral analysis of EEG differences between children with and without learning disabilities. J Learn Disabil 1985; 18:403-408Crossref, Medline, Google Scholar
12 Dykman RA, Holcomb PJ, Oglesby DM, et al: Electrocortical frequencies in hyperactive, learning-disabled, mixed, and normal children. Biol Psychiatry 1982; 17:675-685Medline, Google Scholar
13 Colon EJ, Notermans SLH, de Weerd JPC, et al: The discriminating role of EEG power spectra in dyslexic children. J Neurol 1979; 221:257-262Crossref, Medline, Google Scholar
14 John ER, Prichep LS, Ahn H, et al: Neurometric evaluation of cognitive dysfunctions and neurological disorders in children. Prog Neurobiol 1983; 21:239-290Crossref, Medline, Google Scholar
15 Galin D, Herron J, Johnstone J, et al: EEG alpha asymmetry in dyslexics during speaking and block design tasks. Brain Lang 1988; 35:241-253Crossref, Medline, Google Scholar
16 Yingling CD, Galin D, Fein G, et al: Neurometrics does not detect “pure” dyslexics. Electroencephalogr Clin Neurophysiol 1986; 63:426-430Crossref, Medline, Google Scholar
17 John ER, Ahn H, Prichep LS, et al: Developmental equations for the electroencephalogram. Science 1980; 210:1255-1258Google Scholar
18 John ER, Karmel BZ, Corning WC, et al: Neurometrics: numerical taxonomy identifies different profiles of brain functions within groups of behaviorally similar people. Science 1977, 196:1383-1410Google Scholar
19 John ER, Prichep LS, Fridman J, et al: Neurometrics: computer-assisted differential diagnosis of brain dysfunctions. Science 1988, 293:162-169Google Scholar
20 Matousěk M, Petersén I: Norms for the EEG, in Automation of Clinical Electroencephalography, edited by Kellaway P, Petersen I. New York, Raven, 1973, pp 75-102Google Scholar
21 Alvarez A, Sosa V, Marqui P, et al: On the structure of EEG development. Electroencephalogr Clin Neurophysiol 1989; 73:10-19Crossref, Medline, Google Scholar
22 Harmony T: Psychophysiological evaluation of children's neuropsychological disorders, in Handbook of Child Clinical Neuropsychology, edited by Reynolds CR. New York, Plenum, 1988, pp 265-290Google Scholar
23 Lopes da Silva FH: A critical review of clinical applications of topographic mapping of brain potentials. J Clin Neurophysiol 1990; 7:535-551Crossref, Medline, Google Scholar
24 John ER: Neurometric evaluation of brain function related to learning disorders. Acta Neurol Scand 1981; 64(suppl 89):87-100Google Scholar
25 Harmony T, Hinojosa G, Marosi E, et al: Correlation between EEG spectral parameters and an educational evaluation. Int J Neurosci 1990; 54:147-155Crossref, Medline, Google Scholar
26 Marosi E, Harmony T, Sanchez L, et al: Maturation of the coherence of EEG activity in normal and learning-disabled children. Electroencephalogr Clin Neurophysiol 1992; 83:350-357Crossref, Medline, Google Scholar
27 Marosi E, Harmony T, Reyer A, et al: A follow-up study of EEG coherence in children with different pedagogical evaluations. Int J Psychophysiol 1997; 25:227-235Crossref, Medline, Google Scholar
28 Mechelse K, van Gemund JJ, Nije J, et al: Visual and quantitative analysis of EEGs of normal school children, and school children with specific reading disability. Electroencephalogr Clin Neurophysiol 1975; 39:106-108Crossref, Google Scholar
29 Small JG: Psychiatric disorders and EEG, in Electroencephalography: Basic Principles, Clinical Applications, and Related Fields, edited by Niedermeyer E, Lopes Da Silva F. Baltimore, Williams and Wilkins, 1993, pp 581-596Google Scholar
30 Halperin JM, Gittelman R, Katz S, et al: Relationship between stimulant effect, electroencephalogram, and clinical neurological findings in hyperactive children. J Am Acad Child Psychiatry 1986; 25:820-825Crossref, Medline, Google Scholar
31 Phillips BB, Drake ME, Hietter SA, et al: Electroencephalography in childhood conduct and behavior disorders. Clin Electroencephalogr 1993; 24:25-30 Crossref, Medline, Google Scholar
32 Montagu JD: The hyperkinetic child: a behavioural, electrodermal and EEG investigation. Dev Med Child Neurol 1975; 17:299-305Crossref, Medline, Google Scholar
33 Callaway E, Halliday R, Naylor H: Hyperactive children's event-related potentials fail to support underarousal and maturational-lag theories. Arch Gen Psychiatry 1983; 40:1243-1248Google Scholar
34 Satterfield JH, Schell AM, Backs RW, et al: A cross-sectional and longitudinal study of age effects of electrophysiological measures in hyperactive and normal children. Biol Psychiatry 1984; 19:973-991Medline, Google Scholar
35 Matsuura M, Okubo Y, Toru M, et al: A cross-national study of children with emotional and behavioral problems: a WHO collaborative study in the western pacific region. Biol Psychiatry 1993; 34:59-65Crossref, Medline, Google Scholar
36 DeFrance JF, Smith S, Schweitzer FC, et al: Topographical analyses of attention disorders of childhood. Int J Neurosci 1996; 87:41-61Crossref, Medline, Google Scholar
37 Clarke AR, Barry RJ, McCarthy R, et al: EEG analysis in attention-deficit/hyperactivity disorder: a comparative study of two subtypes. Psychiatry Res 1998; 81:19-29Crossref, Medline, Google Scholar
38 Mann CA, Lubar J, Zimmerman A, et al: Quantitative analysis of EEG in boys with attention deficit hyperactivity disorder: controlled study with clinical implications. Pediatr Neurol 1992; 8:30-36Crossref, Medline, Google Scholar
39 Lazzaro I, Gordon E, Whitmont S, et al: Quantified EEG activity in adolescent attention deficit hyperactivity disorder. Clin Electroencephalogr 1998; 29:37-42Crossref, Medline, Google Scholar
40 Monastra VJ, Lubar JF, Linden M, et al: Assessing attention deficit hyperactivity disorder via quantitative electroencephalography: an initial validation study. Neuropsychology 1999; 13:424-433 Crossref, Medline, Google Scholar
41 Lubar JF: Discourse on the development of EEG diagnostics and biofeedback for attention-deficit/hyperactivity disorders. Biofeedback and Self-Regulation 1991; 16:201-224Crossref, Medline, Google Scholar
42 Satterfield J: EEG issues in children with minimal brain dysfunction. Semin Psychiatry 1973; 5:35-46Medline, Google Scholar
43 McIntyre H, Firemark M, Cho A, et al: Computer analyzed EEG in amphetamine responsive hyperactive children. Psychiatry Res 1981; 4:189-197Crossref, Medline, Google Scholar
44 Prichep LS, John ER: II. Neurometric studies of methylphenidate responders and non-responders, in Perspectives on Dyslexia, vol 1, edited by Pavlidis GT. New York, Wiley, 1990, pp 133-139Google Scholar
45 Steinhausen H, Romahn G, Gobel D: Computer analyzed EEG methylphenidate responsive hyperactive children. Neuropediatrics 1984; 15:28-32Crossref, Medline, Google Scholar
46 Craggs MD, Wright JJ, Werry JS: A pilot study of the effects of methylphenidate on the vigilance-related EEG in hyperactivity. Electroencephalogr Clin Neurophysiol 1980; 48:34-42Crossref, Medline, Google Scholar
47 Surwillo WW: Changes in the electroencephalogram accompanying the use of stimulant drugs (methylphenidate and dextroamphetamine) in hyperactive children. Biol Psychiatry 1977; 12:787-799Medline, Google Scholar
48 Swartwood MO, Swartwood JN, Lubar JF, et al: Methylphenidate effects on EEG, behavior, and performance in boys with ADHD. Pediatr Neurol 1998; 18:244-250Crossref, Medline, Google Scholar
49 Chabot RJ, Merkin H, Wood LM, et al: Sensitivity and specificity of QEEG in children with attention deficit or specific developmental learning disorders. Clin Electroencephalogr 1996; 27:26-34Crossref, Medline, Google Scholar
50 Chabot RJ, Serfontein G: Quantitative EEG profiles of children with attention deficit disorder. Biol Psychiatry 1996; 40:951-963Crossref, Medline, Google Scholar
51 Chabot RJ, Orgill AA, Crawford G, et al: Behavioral and electrophysiological predictors of treatment response to stimulants in children with attention disorders. J Child Neurol 1999; 14:343-351Crossref, Medline, Google Scholar
52 Pascual-Marqui RD: Low resolution brain electromagnetic tomography (LORETA) (abstract). Electroencephalogr Clin Neurophysiol 1997; 103:25 Crossref, Google Scholar
53 Levy F, Ward P: Neurometrics, dynamic brain imaging and attention deficit disorder. J Paediatr Child Health 1995; 31:279-283Crossref, Medline, Google Scholar
54 Valdes-Sosa P, Marti F, Garcia F, et al: Variable resolution electromagnetic tomography, in BioMag96: Proceedings of the 10th International Conference on Biomagnetism, Santa Fe, NM, edited by Aine CJ, Okada Y, Stroink G, et al. New York, Springer-Verlag, 2000Google Scholar
54a Evans AC, Collins DL, Neelin P, et al: Three-dimensional correlative imaging: applications in human brain mapping, in Functional Neuroimaging: Technical Foundations, edited by Thatcher RW, Hallett M, Zeffiro T, et al. San Diego, CA, Academic Press, 1994, pp 145-161Google Scholar
55 Valdes-Sosa P: Quantitative electroencephalographic tomography (abstract). Electroencephalogr Clin Neurophysiol 1997; 103:19Crossref, Google Scholar
56 Hynd GW, Semrud-Clikeman M, Loryus A, et al: Brain morphology in developmental dyslexia and attention deficit disorder/hyperactivity. Arch Neurol 1990; 47:919-926Crossref, Medline, Google Scholar
57 Filipek PA, Semrud-Clikeman M, Steingard RJ, et al: Volumetric MRI analysis comparing subjects having attention-deficit hyperactivity disorder with normal controls. Neurology 1997; 48:589-601Crossref, Medline, Google Scholar
58 Hynd G, Semrud-Clikeman M, Lorys A, et al: Corpus callosum morphology in attention deficit-hyperactivity disorder: morphometric analysis of MRI. J Learn Disord 1991; 24:141-146Crossref, Medline, Google Scholar
59 Baumgardner TL, Singer HS, Denckla MB, et al: Corpus callosum morphology in children with Tourette syndrome and attention deficit hyperactivity disorder. Neurology 1996; 47:477-482Crossref, Medline, Google Scholar
60 Semrud-Clikeman M, Filipek PA, Biederman J, et al: Attention-deficit hyperactivity disorder: magnetic resonance imaging morphometric analysis of the corpus callosum. J Am Acad Child Adolesc Psychiatry 1994; 33:875-881Crossref, Medline, Google Scholar
61 Castellanos FX, Giedd JN, Eckburg P, et al: Quantitative morphology of the caudate nucleus in attention deficit hyperactivity disorder. Am J Psychiatry 1994; 151:1791-1796Google Scholar
62 Mataro M, Garcia Sanchez C, Junque C, et al: Magnetic resonance imaging measurement of the caudate nucleus in adolescents with attention-deficit hyperactivity disorder and its relationship with neuropsychological and behavioral measures. Arch Neurol 1997; 54:963-968Crossref, Medline, Google Scholar
63 Casey BJ, Castellanos FX, Giedd JN, et al: Implication of right frontostriatal circuitry in response inhibition and attention-deficit/hyperactivity disorder. J Am Acad Child Adolesc Psychiatry 1997; 36:374-383Crossref, Medline, Google Scholar
64 Sieg KG, Gaffney GR, Preston DF, et al: SPECT brain imaging abnormalities in attention deficit hyperactivity disorder. Clin Nucl Med 1995; 20:55-60Crossref, Medline, Google Scholar
65 Zametkin AJ, Liebenauer LL, Fitzgerald GA, et al: Brain metabolism in teenagers with attention-deficit hyperactivity disorder. Arch Gen Psychiatry 1993; 50:333-340Crossref, Medline, Google Scholar
66 Amen DG, Carmichael BD: High-resolution brain SPECT imaging in ADHD. Ann Clin Psychiatry 1997; 9:81-86 Crossref, Medline, Google Scholar
67 Lou H, Henriksen L, Bruhn P, et al: Striatal dysfunction in attention deficit and hyperkinetic disorder. Arch Neurol 1989; 46:48-52Crossref, Medline, Google Scholar
68 O'Tuama LA, Treves ST: Brain single-photon emission computed tomography for behavior disorders in children. Semin Nucl Med 1993; 23:255-264Crossref, Medline, Google Scholar
69 Lopes da Silva FH: The generation of electric and magnetic signals of the brain by local networks, in Comparative Human Physiology, edited by Greger R, Windhorst U. Berlin, Springer-Verlag, 1996, pp 509-531Google Scholar
70 Steriade M, Gloor P, Llinas RR, et al: Basic mechanisms of cerebral rhythmic activities. Electroencephalogr Clin Neurophysiol 1990; 76:481-508Crossref, Medline, Google Scholar
71 DeBoer P, Abercrombie E: Physiological release of striatal acetylcholine in vivo: modulation of d1 and d2 dopamine receptor subtypes. J Pharmacol Exp Ther 1996; 277:775-783Medline, Google Scholar
72 Icarashi Y, Takahashi H, Aral T, et al: Suppression of cholinergic activity via the dopamine D2 receptor in the rat stratum. Neurochem Int 1997; 30:191-197Crossref, Medline, Google Scholar
73 Russel V, deVilliers A, Sagvolden T, et al: Altered dopaminergic function in the prefrontal cortex, nucleus accumbens and caudate-putamen of an animal model of attention deficit hyperactivity disorder. Brain Res 1995; 676:343-351Crossref, Medline, Google Scholar
74 Levy F: The dopamine theory of attention deficit hyperactivity disorder. Aust NZ J Psychiatry 1991; 25:277-283Crossref, Medline, Google Scholar
75 Niedermyer E, Naidu SB: Attention deficit disorder and frontal motor cortex disconnection. Clin Electroencephalogr 1998; 28:130-136Crossref, Google Scholar
76 Lin JS, Hou Y, Jouvet M: Potential brain neuronal targets for amphetamine, methylphenidate and modafinil-induced wakefulness, evidenced by c-fos immunocytochemistry in the cat. Proc Natl Acad Sci 1996; 93:14128-14133Google Scholar
77 Baxter MG, Holland PC, Gallagher M: Disruption of decrements in conditioned stimulus processing by selective removal of hippocampal cholinhergic input. J Neurosci 1997; 17:5230-5236Google Scholar
78 Steriade M: Cellular substrates of brain rhythms, in Electroencephalography: Basic Principles, Clinical Applications, and Related Fields, 3rd edition, edited by Niedermeyer E, Lopes da Silva FH., Baltimore, Williams and Wilkins, 1993, pp 27-62Google Scholar
79 Lekwuwa GU, Barnes GR: Cerebral control of eye movements. the relationship between cerebral lesion sites and smooth pursuit deficits. Brain 1996; 119:473-490Crossref, Medline, Google Scholar
80 Baron JC: Study of functional neuroanatomy of perception using positron emission tomography. Rev Neurol 1995; 151:511-517Medline, Google Scholar
81 Heslenfeld DJ, Kenemans JL, Kok A, Molenaar CP: Feature processing and attention in the human visual n overview. Biol Psychol 1997; 45:183-215Crossref, Medline, Google Scholar
82 Fein G, Galin P, Yingling CD, et al: EEG spectra in dyslexic and control boys during resting conditions. Electroencephalogr Clin Neurophysiol 1986; 72:87-97Crossref, Google Scholar
83 Kuperman S, Johnson B, Arndt S, et al: Quantitative EEG differences in a nonclinical sample of children with ADHD and undifferentiated ADD. Am Acad Child Adolesc Psychiatry 1996; 35:1009-1017Google Scholar