Neurometabolic Functioning and Neuropsychological Correlates in Children With ADHD-H: Preliminary Findings
Abstract
Proton magnetic resonance spectroscopy (MRS) and neuropsychological testing were conducted on 8 children with attention-deficit/hyperactivity disorder (ADHD-H), with no learning disabilities or comorbidities and 8 controls. Magnetic resonance spectroscopy revealed increased Glutamate/Glutamine in both frontal areas, and increased N-acetyl aspartate and Choline in the right frontal area of the ADHD-H subjects. Neuropsychological testing revealed few within- and between-group differences. Findings related to frontal lobe dysfunction in ADHD-H subjects were noted. N-acetylasparte/creatine (NAA/Creatine) in the right frontal region, and myoinositol/creatine (Myo inositol/Creatine) in the right and left frontal regions appear to be highly associated with the regulation of sensorimotor, language, and memory and learning functioning in children with ADHD-H.
With its core symptoms of inattention, impulsivity, and overactivity, attention deficit hyperactivity disorder (ADHD) has been conceptualized as representing a dysfunction in the prefrontal brain regions and connections to the striatum.1,2,3 A recent review of the literature also argued that neuropsychological evidence points to a differential involvement of right hemisphere processes, particularly implicating the right frontostriatal system.4 On magnetic resonance imaging (MRI), children diagnosed with ADHD do not demonstrate the typical right frontal asymmetry that tends to be found in normal controls, suggesting possible underdevelopment of white matter.5 In fact, volumetric MRI has found decreased white matter in the frontal regions, including the corpus callosum and globus pallidus.6 Further, significant differences in inhibitory performance were noted to be linked to abnormal measures of the frontostriatal circuitry.7 Recent studies utilizing functional magnetic resonance (fMRI) support this hypothesis in identifying hypofrontality in subjects with ADHD during the performance of executive function tasks.8,9 In a recent study, 1H proton magnetic resonance spectroscopy (MRS) was performed on nine ADHD subjects and controls. Findings revealed that frontal-striatal glutamatergic resonances were found to be elevated in the ADHD children.10
Given this cluster of neurobiological findings, this study was conducted to explore the neurometabolic and associated neuropsychological characteristics of children diagnosed with ADHD-Hyperactive Type. With much emphasis being placed on anterior frontal regions, specific left and right frontal sites were targeted for proton magnetic resonance spectroscopy to explore whether alterations in brain metabolites could be observed in children with ADHD. In addition, neuropsychological testing was conducted to examine what specific neurocognitive correlates might exist when compared to MRS findings. It was suspected that both MRS and neuropsychological testing would provide evidence of frontal lobe dysfunction in the ADHD-H children when compared to the normal controls.
METHOD
Subjects
The participants in this study included 16 children between the ages of 6 and 12 years old (M = 8.93, SD = 1.58). The children and their families gave informed consent and assent for participation in this study. There were 14 males and two females, and all of the subjects were Caucasian. Eight subjects were identified as having ADHD-Hyperactive Type and were matched to eight normal controls based on chronological age, gender, and race. All of the children with ADHD-H were taking some type of stimulant medication (i.e., mostly Ritalin), although they did not take the medication for at least 24 hours preceding MRS or neuropsychological testing. None of the subjects with ADHD-H and none of the normal controls had any diagnosed comorbid learning disability, nor did they have any other diagnosed psychiatric disorder. None of the participants had a neurological history significant for traumatic brain injury, seizures, or any other type of frank neurological involvement. All of the participants were right handed to control for laterality effects.
Measures
For entry into the study, parents participated in the Kiddie Schedule for Affective Disorders and Schizophrenia (K-SADS), a structured interview used to determine the presence of specific diagnostic symptoms consistent with ADHD-H and to rule out other psychiatric and severe developmental disorders.
Neuropsychological testing was conducted using a developmental neuropsychological assessment (NEPSY), an age-normed (ages 3 through 12 years) standardized battery of tasks.10 The NEPSY comprises 36 subtests designed to tap several key neuropsychological domains: attention and executive functions, memory and learning, sensori-motor functions, visuospatial, and language. The 14 core domain subtests were employed in this study, and the five domain standard scores were used in the data analyses. The Woodcock-Johnson Psychoeducational Battery-Revised was also employed in order to gain an estimate of overall intellectual functioning.11 The Broad Cognitive Ability Scale comprises tasks designed to tap into memory, language, and visual functions, and an overall age-based standard score is generated. This testing was completed in a single session for all subjects.
Magnetic Resonance Spectroscopy was conducted on each subject following the neurobehavioral testing. None of the children required a sedative for completion of this procedure. Proton MRS studies were performed on a Siemens 1.5-T Magnetron clinical MR system using the standard MR head coil via a protocol approved by the University of North Carolina (UNC) Human Institutional Review Board. The stimulated echo acquisition mode technique (STEAM) was used for localization of the volume of interest and in obtaining the proton spectrum within the defined volume. The STEAM acquisition parameters were TE = 20 msec, TR = 1,600, and nex = 128. A 2 × 2 × 2 cm3 (8cc) volume element was defined and positioned in the left and right frontal lobe areas for single voxel MRS examinations utilizing T1-weighted spin echo saggital and axial MR images (TE = 15 msec, TR = 600 msec, 6 mm slice thickness, and 1 nex). As shown in Figure 1, this volume is adjacent to the anterior portion of the cingulate gyrus and encompasses the anterior aspect of the superior frontal gyrus.
The field homogeneity of the volume, as judged by the width of the water signal at half-maximum height, was between 4–6 Hz in all studies. Water suppression was performed using a single frequency selective water proton chemical shift selective (CHESS) pulse prior to the implementation of the volume selection STEAM sequence.
The time domain signal obtained from the study was zero filled to 2,048 points, followed by application of an exponential multiplier of 4–6 Hz and Fourier transformed to obtain the frequency domain spectrum. Generally, only a zero-order phase correction was used to fix the signal. The baseline was corrected using a second order spline function, and peak areas for each metabolite were determined using a curve fitting function in the spectroscopy processing software provided by Siemens. Peak areas were normalized relative to the peak area found for creatine in that volume so that data from this study could be compared with MRS studies performed by other investigators. We assigned choline (Cho) at 3.2 parts per million (ppm), creatine (Cr) at 3.03 ppm, and N-acetylaspartate (NAA) at 2.0 ppm. The resonances seen between 2.1–2.5 ppm were primarily assigned to glutamate (Glu) and glutamine; resonances observed at 0.8–1.5 ppm to the methylene and methyl groups of lipids; and those at 3.56 ppm were allocated to myo-inositol (Myo).
RESULTS
Group data for the MRS and neuropsychological testing were compared using simple t tests. Given that the groups were matched on chronological age, race, and gender, these variables did not need to be covaried in the analyses; however, these comparisons were examined to ensure the assumption of no group differences on these selected demographic variables. Although, from a preliminary data analysis perspective, the small sample size would contribute to extremely unstable correlation coefficients, the relationships between the MRS findings and the neuropsychological domains were examined using the Pearson product-moment correlation coefficient.
Initial group comparisons revealed no differences between the groups with respect to socioeconomic status, t (1) = 0.99, p < 0.46; chronological age, t (1) = 1.11, p < 0.31; or gender. The intellectual level of the two groups fell within the average range (ADHD-H Group IQ = 106.62 ± 15.54; Normal Group IQ = 110.00 ± 13.40), with no differences noted in their overall levels of intellectual functioning, t (1) = 0.14, p < 0.71. Consequently, none of these variables was covaried in subsequent data analyses.
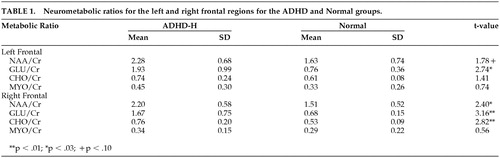
Means and standard deviations for the neurometabolic indices can be seen in Table 1. Representative proton MR spectra of the left and right frontal lobes of the control and ADHD-H children, respectively, are shown in Figure 2 and Figure 3. No significant differences were found in the Cr normalized levels of NAA, Glu, Cho, and Myo when the left and right frontal lobe volumes of the control or ADHD were compared against themselves. When the normalized levels of the metabolites in the control group were compared against the ADHD-H group, however, a number of significant differences were found. Children with ADHD-H showed significantly higher Cr normalized levels of NAA, t (14) = 2.40, p < 0.03; Glu, t (14) = 3.16, p < 0.008; and Cho, t (14) = 2.82, p < 0.01 in the voxel obtained from the right frontal lobe when compared to normals. The level of Myo in the right frontal region in the children with ADHD-H was indistinguishable from their normal counterparts, t (14) = 0.56, p < 0.59. Fewer differences were noted in the voxel obtained from the left frontal lobe, with only the GLU/Cr ratio being significantly higher in the ADHD-H group, t (14) = 2.74, p < 0.02. The NAA/Cr ratio approached significance, t (14) = 1.78, p < 0.10, with the activity being higher in the ADHD-H group, but there was no difference between groups on CHO/Cr, t (14) = 1.41, p < 0.18, or MYO/Cr, t (14) = 0.74, p < 0.47.
Comparison of the peak metabolite areas suggests that the differences observed for the Cr normalized levels of NAA and Cho in the ADHD-H group are partly due to differences in the Cr peak areas. The Cr peak area was found to be significantly higher (p < 0.05) in the control group compared to the ADHD-H group (1.70 ± 0.39 versus 1.36 ± 0.32); however, this difference in Cr levels did not account for the large difference observed for Glu observed in the ADHD-H group. Comparison of the Glu peak areas shows that the Glu levels in the frontal lobes of the ADHD-H group were still two and one-half times greater than the levels in the control group.
Means and standard deviations for the neurocognitive domains and associated subtests can be seen in Table 2. Both groups generally fell within the average range of functioning across the various neuropsychological domains. In fact, group differences were minimal, but the ADHD-H group did manifest lower sensorimotor abilities, t (14) = 2.54, p < 0.02, with particular problems being apparent on tasks tapping visuomotor precision, t (14) = 2.40, p < 0.03, and basic fine-motor speed, t (14) = 2.02, p < 0.06. These findings would suggest concerns with fine-motor control, and perhaps could be related to impulsivity in responding.
Correlation coefficients between the eight MRS variables and the five summary domains from the NEPSY revealed no significant associations for the normal group, but a number of interesting relationships in the ADHD-H group emerged. Specifically, NAA/Cr in the right frontal region correlated significantly with both the sensorimotor domain, r = 0.76, p < 0.03, and the memory and learning domain, r = 0.84, p < 0.001, with the magnitude of the correlations falling within the strong range. The level of Myo/Cr also significantly correlated with Language in both the left, r = 0.78, p < 0.02, and right, r = 0.79, p < 0.02, frontal regions. A number of other associations approached significance, such as the relationship of NAA/Cr in the right frontal region with attention/executive functions, r = 0.67, p < 0.07, and Glutamate/Cr in the right frontal region with Memory and Learning, r = 0.69, p < 0.06. These relationships likely would have been stronger in a larger sample size.
DISCUSSION
In this study, the proton MRS patterns of children with ADHD-H without affective or learning comorbidity were compared to age-, race-, and gender-matched typically developing children to determine whether differences could be observed in the brain metabolite levels in regions of the brain suspected of being involved in the clinical manifestation of ADHD-H. Examination of specific regions of the right frontal lobes suggested that children with ADHD-H showed significantly higher ratios of NAA, Glu, and Cho when normalized against the creatine levels. Only Glu was significantly higher in the left frontal region, although group differences in left frontal NAA levels approached significance. Few neuropsychological differences were found between the groups, although the sensorimotor deficits noted in the ADHD-H group did suggest ongoing problems with motor regulation and control, possible indications of disinhibitory control associated with frontal lobe dysfunction. Further, although highly unstable due to small sample size, the correlations noted between the MRS and neuropsychological findings do implicate these neurometabolic functions in the neurobehavioral manifestations of children with ADHD-H, and more clear patterns likely would be uncovered with a larger sample size. At present, the activity of NAA/Cr in the right frontal region, appear to be strongly associated with the regulation of sensorimotor, attention/executive functions, and memory and learning in children with ADHD-H, while MYO/Cr in the right and left frontal regions appear to be highly associated with language functioning in children with ADHD-H.
With respect to the specific group differences on the neurometabolic variables, the differences observed in the ratios for NAA, Cho and Glu may be due, in part, to differences found for the creatine peak areas used to normalize the data in the ADHD-H children versus age-, gender-, and race-matched controls. As shown in Figure 2, the peak area for creatine in the frontal lobes of the ADHD-H group was found to be significantly lower by approximately 20% than that found in the control group. This difference could be due to changes in the levels of gamma-aminobutyric acid (GABA) in the two groups. The resonance observed at 3 ppm is primarily due to the -N-CH3 group of creatine, but the gamma methylene group (i.e., -CH2-N-) of GABA also can contribute to the intensity of this peak at 3 ppm in the brain. This would suggest that the levels of GABA are lower in the ADHD-H group. In addition, a significant difference in the proton spectral region between 2.1–2.5 ppm was observed between the control group and the ADHD-H group. In the ADHD group, a three- to four-fold increase in the peak area ratios was observed in the frontal lobe region compared to the same region in the matched normal children which cannot be attributed to the 20% decrease in the Cr/GABA resonance at 3.0 ppm. This spectral region contains methylene protons arising from both glutamate and GABA. However, the increase in peak intensity between 2.1–2.5 ppm in the ADHD-H group must be due primarily to an elevation in glutamate levels that would suggest that the ADHD-H group has lower levels of GABA than the control group since GABA is produced via the decarboxylation of glutamate. Alternatively, the decrease in the observed Cr peak area could suggest that this region is hypermetabolic. In highly malignant brain tumors and infectious brain processes, it has been shown that the levels of Cr decrease.12
Thus, in the ADHD-H group, the data suggest that this group has (1) either decreased levels of GABA, or it is a region that is hypermetabolic and (2) an increased level of glutamate relative to the normal control group. Biochemically, this can occur by either decreased metabolism of glutamate to GABA via glutamic acid decarboxylase or increased conversion of GABA back to glutamate via GABA transaminase. In either case, this will lead to decreased GABA levels and increased glutamate levels in the ADHD-H group. The MRS data obtained in this study are consistent with this hypothesis and findings suggesting dysregulation of the right frontal region.
What are the neurophysiological consequences of these changes in glutamate and GABA if this hypothesis is correct? Both metabolites are neurotransmitters. Glutamate is an excitatory amino acid that causes a marked fall in neuronal membrane resistance and an increase in calcium ion permeability. This leads to a depolarization of the neuronal membrane and a decrease in the action potential of the neuron that, in turn, leads to a more easily stimulatable and excited neuronal pathway. Continued excitation can lead to neurotoxicity. GABA, on the other hand, is an inhibitory amino acid that causes an increase in neuronal membrane resistance by opening up chloride ion channels. This leads to a hyperpolarization of the neuronal membrane and an increase in the action of the neuron. A more inhibited neuronal pathway would be more conducive to efficient brain functioning.
In a recent report, a region which encompassed the hippocampal-amygdaloid complex in five ADHD and five control patients was examined with proton MRS.14 This region is part of the limbic pathway of the brain involved in controlling emotion. Proton MR spectroscopy of this area showed decreased NAA/Cr ratios in the ADHD group compared to the control group. This decrease in the ratio may indicate that GABA levels in this region of the brain may be increased since, as in our study, the data normalized relative to the peak area of Cr in the target voxel of interest. If true, these data, in conjunction with the data presented in our study, would suggest that in patients with ADHD the frontal lobe neuronal pathways are easily stimulated due to an increase in glutamate. This leads to the hyperactive component of ADHD, but not necessarily to emotional disorders (e.g., bipolar affective disorder), since part of the limbic pathway in patients with ADHD is inhibited due to an increase in GABA.
Although preliminary in nature, this study provides one of the first glimpses of neurometabolic functioning in children with a specific subtype of ADHD that was not contaminated by learning disabilities, psychiatric comorbidity, or frank neurological disorder. In this regard, there is significant evidence that even in well-screened children with a mild expression of a specific subtype of ADHD, there is exposure to excitatory metabolites. Further, there appears to be possible neurobehavioral correlates of this exposure, although further investigation with a larger sample size likely will produce more stable findings. Finally, there is evidence in the literature that ADHD-H can be seen as one of the first symptoms expressed in more severe psychiatric illnesses (e.g., anxiety disorders, bipolar disorder, schizophrenia), and more research needs to be done to examine long-term exposure to the excitatory metabolites on subsequent neurodevelopment.
ACKNOWLEDGMENTS
Portions of this paper were presented at the Annual Meeting of the Academy of Child and Adolescent Psychiatry, Toronto, Canada, October 16, 1997.
The investigators would like to thank the Foundation of Hope for a grant supporting major portions of this project. This study also was supported from grants awarded to the Center for Development and Learning from the Maternal Child Health Bureau (#MCJ379154A) and the Administration on Developmental Disabilities (#90DD043003).
This paper was presented at the American Medical Association's Media Briefing on Neurology, December 4, 2003, New York, New York.
 |
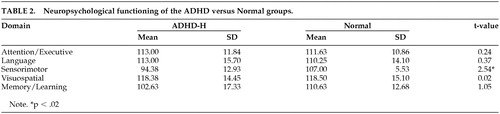 |

FIGURE 1. Position of the Volume Element in the Frontal Lobe

FIGURE 2. Proton MR Spectra of Comparison Children Without ADHD-H

FIGURE 3. Proton MR Spectra of Children With ADHD-H
1 Giedd JN, Blumenthal J, Molloy E, Castellanos FX: Brain Imaging of attention deficit/hyperactivity disorder. Ann N Y Acad Sci, 2001; 931:33–49Crossref, Medline, Google Scholar
2 Himelstein J, Newcorn, JH, Halperin JM: The neurobiology of attention-deficit hyperactivity disorder. Front Viosci 2000; 5:D461–478Google Scholar
3 Stefanatos GA, Wasserstein J: Attention deficit/hyperactivity disorder as a right hemisphere syndrome. Ann N Y Acad Sci, 2001; 172–195Google Scholar
4 Barkley RA, Grodzinsky G, DuPaul GJ: Frontal lobe functions in attentiondeficit disorder with and without hyperactivity: a review and research report. J Abnorm Child Psychol 1992; 20(2): 163–188Google Scholar
5 Filipek PA, Semrud-Clikeman M, Steingard RJ, et al.: Volumetric MRI analysis comparing subjects having attention deficit hyperactivity disorder with normal controls. Neurology, 1997; 48:589–601Crossref, Medline, Google Scholar
6 Castellanos F, Giedd JN, Marsh WL, et al.: Quantitative brain magnetic resonance imaging in attention-deficit hyperactivity disorder. Arch Gen Psych, 1996; 53:607–616Crossref, Medline, Google Scholar
7 Casey BJ, Castellanos FX, Giedd JN, et al.: Implication of right frontostriatal circuitry in response inhibition and attention-deficit/hyperactivity disorder. J Am Acad Child Adolesc Psychiatry, 1997; 36:374–383Crossref, Medline, Google Scholar
8 Rubia K, Overmeyer S, Taylor E, et al.: Hypofrontality in attention deficit hyperactivity disorder during higher-order motor control: a study with fMRI. Am J Psychiatry, 1999; 156:891–896Crossref, Medline, Google Scholar
9 Rubia K, Overmeyer S, Taylor E, et al.: Functional frontalisation with age: mapping neurodevelopmental trajectories with fMRI. Neuroscience Biobehav Rev, 2000; 24:13–19Crossref, Medline, Google Scholar
10 MacMaster FP, Carrey N, Sparkes S, et al.: Proton spectroscopy in medication-free pediatric attention-deficit/hyperactivity disorder. Bio Psychiatry, 2003; 53(2):184–187Crossref, Medline, Google Scholar
11 Korkman M, Kirk U, Kemp S: NEPSY: A Developmental Neuropsychological Approach. San Antonio, TX: The Psychological Corporation, 1998Google Scholar
12 Woodcock R, Johnson N, Woodcock-Johnson Psychoeducational Battery-Revised. DLM Publishers, 1989Google Scholar
13 Miller BL: A review of chemical issues in 1H NMR spectroscopy: N-acetyl-L-aspartate, creatine, and choline. NMR Biomed, 1991; 4:47–52Crossref, Medline, Google Scholar
14 Levitt J, Ke Y, Thomas MA, Curran JG, et al: MR imaging and spectroscopy in children with developmental psychiatric disorders. Radiology, 1995; 97(P): 196Google Scholar