A Morphometric Analysis of Neuroanatomic Abnormalities in Traumatic Brain Injury
Most studies of TBI-related structural brain changes employ manually traced regions of interest to quantify atrophic changes in areas vulnerable to injury. Longitudinal and cross-sectional studies of moderate to severe TBI have found atrophy in white matter fiber tracts, particularly the corpus callosum, as well as reductions of frontal and total brain volume and increases in ventricular volume, likely due to white matter loss. 6 Reduced volume of the anterior and inferior frontal and temporal lobes is also commonly found following moderate to severe TBI, likely due to abrasive contact with bony plates of the skull during the acute injury. 5 While these studies are extremely informative, the regions-of-interest approach has limitations that might constrain our ability to detect localized structural effects of TBI. Specifically, this approach requires the a priori selection of regions of interests, which could preclude finding atrophy in other regions. Further, regions-of-interest methods are biased toward the selection of brain structures with clearly defined boundaries over regions and structures with unclear anatomical boundaries.
More recently, automated whole brain neuroimaging methods that permit a detailed assessment of tissue loss following TBI have been developed. Voxel-based morphometry is one such approach. It allows for the detection and localization of region-specific reductions in both gray matter and white matter concentrations throughout the brain. Briefly, voxel-based morphometry entails normalizing each image to stereotactic space and then segmenting each voxel into gray matter, white matter, and CSF segments based on voxel intensity. The segmented images are then smoothed to calculate probability maps of the three tissue types within each voxel, allowing a voxel-by-voxel comparison of tissue concentrations. 7 , 8
Gale and colleagues 9 used voxel-based morphometry to identify regions of reduced gray matter concentrations in nine TBI survivors and nine age- and sex-matched healthy adults. Participants in the TBI group all sustained mild to severe injuries at least 1 year earlier. Gale et al. 9 found diffuse gray matter reductions throughout the brains, particularly in frontal and temporal cortex, subcortical regions, cerebellum, and cingulate gyri of TBI survivors. However, the analyses were not adjusted for multiple comparisons, and given the large number of voxel-by-voxel comparisons conducted in voxel-based morphometry, some of the findings likely represented type I errors. Tomaiuolo et al. 10 compared the white matter concentrations of 19 severe TBI survivors who were 3–113 months postinjury to healthy age- and sex-matched comparison subjects. Reduced white matter concentrations were found in the corpus callosum, fornix, parahippocampal gyrus, optic radiation, optic chiasm, internal capsule, and superior frontal gyrus. Finally, Salmond et al. 11 compared gray matter and white matter concentrations in 22 survivors of moderate to severe TBI with those of age-, sex-, and premorbid IQ-matched healthy comparison subjects. The TBI patients, who were all scanned at least 6 months postinjury, showed reduced gray matter concentration in the basal forebrain, hippocampal formation, cerebellum, insula, thalamus, and areas of the neocortex. White matter concentration differences were less pronounced and occurred in the lateral capsule and corpus callosum.
The goal of our study was to compare long-term survivors of TBI with carefully matched healthy adults in terms of both cognitive and neuroanatomic abnormalities. Based on previous research, 3 – 5 we hypothesized that the TBI group would perform more poorly than healthy adults on tests of attention, memory, psychomotor speed, and executive functioning. We also hypothesized that the TBI group would show differences in global gray matter and white matter volumes relative to matched comparison subjects, and that volumetric measures would correlate with cognitive test performance. Finally, we used voxel-based morphometry in an attempt to identify specific regional abnormalities of gray matter and white matter tissue concentration in patients with TBI relative to healthy control participants.
METHODS
Participants
Sixteen TBI survivors were recruited from the community and from hospitals and rehabilitation facilities in the Baltimore/Washington, D.C., metropolitan area. We were particularly, but not exclusively, interested in patients who presented prominent signs of apathy. Two individuals did not undergo brain imaging and were excluded, resulting in a final sample of 14 TBI survivors. TBI severity was rated based on multiple factors, including Glasgow Coma Scale scores, following the usual criteria for severe (3–8), moderate (9–12), and mild (13–15) injury. All participants sustained up to 12 weeks’ loss of consciousness except for two individuals for whom the presence and duration of altered consciousness were unclear. However, both of these patients showed dramatic personality changes, meeting DSM-IV criteria for “personality change secondary to TBI, apathetic subtype” at long-term follow-up, and showed central or unilateral atrophy on neuroimaging. The majority of brain injuries resulted from a motor vehicle accident (n=11) or fall (n=2). All injuries were sustained at least 18 months (mean=122 months, range=18–366 months) prior to study participation. No patient met criteria for a mood disorder according to DMS-IV criteria, though most met criteria for an apathy syndrome (n=10). All were free of substance abuse in the 6 months prior to study participation.
In addition, 28 healthy participants in the Johns Hopkins Aging, Brain Imaging, and Cognition Study of normal aging provided data for analyses. The individuals reported no history of head injury and were free of medical and psychiatric illnesses that can affect brain structure or function. The comparison subjects and TBI groups were carefully matched for age, sex, race, years of education, estimated premorbid IQ (NART-R), 12 and total intracranial volume (p>0.05 in all cases).
On a single day, each participant underwent physical and neurological examinations, a psychiatric interview, laboratory blood studies, a brain MRI scan, and detailed neurocognitive assessment. Cognitive tests included measures of psychomotor speed and dexterity (Grooved Pegboard test), 13 psychomotor processing speed (Trail Making test), 14 auditory divided attention (Brief Test of Attention), 15 letter-cued verbal fluency (letters S and P), visual construction (Rey-Osterrieth Complex Figure Test [RCFT]), 16 , 17 verbal learning and recall (Hopkins Verbal Learning Test—Revised [HVLT-R]), 18 visual learning and recall (Brief Visuospatial Memory Test—Revised [BVMT-R]), 19 and concept formation (modified Wisconsin Card Sorting Test [mWCST]). 20 , 21 The study was approved by the Johns Hopkins Medicine institutional review board and all subjects gave written informed consent.
MRI Protocol and Image Analyses
All participants underwent brain MRI on the same 1.5 Tesla GE Signa scanner (Milwaukee, Wisconsin). We acquired 124 contiguous 1.5 mm 3-D SPGR slices in the coronal plane. The parameters were as follows: repetition time =35 seconds, echo time =5 seconds, flip angle =45°, and image matrix =256×256. Images were preprocessed with statistical parametric mapping software (SPM2; Wellcome Department of Cognitive Neurology, London), using the Good et al. 8 optimized method. First, images were transformed into standard stereotactic space, and global shape differences were removed with spatial normalization. This involved the application of linear and nonlinear transformations of the study images to a customized template based on the T1-weighted images of 86 relatively healthy normal comparison subjects (mean age =51 years, 42% male). Prior probability maps estimated the likelihood of a given tissue type at each voxel, and based on this information, the images were segmented into volumes of gray matter, white matter, and CSF. Images were then resliced as 1.0 mm isotropic voxels and smoothed to make the data more normally distributed using a 12 mm full width at half maximum Gaussian kernel.
Based on the segmented images, we estimated gray matter (GM), white matter (WM), and total brain volumes (TBV=GM+WM volumes). Total intracranial volume was also calculated (TICV=GM+WM+CSF). The ratios white matter to TICV (WM/TICV) and gray matter to TICV (GM/TICV) were used as proxies of white matter- and gray matter-related atrophy (i.e., significantly decreased ratios denote atrophy).
Statistical Analyses
Independent sample t tests and chi-square analyses were used to compare groups in terms of age, sex, race, education, estimated premorbid IQ, segmented brain volumes, and cognitive test performance. Spearman’s rho was used to test correlations between cognitive performance and measures of segmented brain volume, atrophy, and time since injury. Analyses were conducted using the SPSS version 15.0 for Windows. 22
Voxel-based morphometry statistical analyses were conducted with MatLab 7.0, 23 using ANCOVA to explore group differences in gray matter and white matter tissue concentrations. Although the groups did not differ in age, both groups were characterized by a relatively wide age range (25 to 64 years old). Because voxel-based morphometry is highly sensitive to age-related cerebral atrophy, we treated age as a nuisance variable for all analyses. 24 Contrasts tested the hypothesis that the TBI group would demonstrate areas of reduced gray and white matter concentrations relative to the comparison group. We also tested the reverse (that TBI survivors would show increased gray and white matter concentrations) but hypothesized that no significant differences would be found. Analyses were conducted with an absolute threshold masking of 0.1 and a voxel extent threshold of 25, meaning that at least 25 contiguous voxels must show the association of interest in order to be considered a cluster of significantly reduced gray matter or white matter. A cluster-wise false discovery rate (FDR) correction of p<0.05 was applied to limit the number of type I errors obtained over multiple voxel-wise comparisons.
RESULTS
Cognitive Function
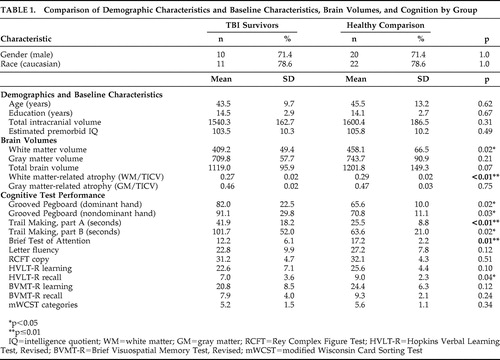
As shown in Table 1 , the TBI and healthy comparison groups did not differ significantly in age, sex distribution, years of education, race, total intracranial volume, or estimated premorbid IQ. However, TBI survivors performed worse than healthy comparison subjects on all 12 neuropsychological measures, and six of these differences were statistically significant. Specifically, patients with TBI required more time to complete measures of psychomotor speed (Trail Making test, part A: t=−3.19, df=40, p=0.006; part B, t=−2.63, df=40, p=0.019) and fine motor speed and dexterity (Grooved Pegboard dominant hand: t=−2.60, df=40, p=0.020; nondominant hand: t=−2.47, df=40, p=0.026). The TBI group also performed more poorly on a test of auditory divided attention (Brief Test of Attention: t=2.93, df=40, p=0.010) and delayed verbal recall (HVLT-R recall: t=2.15, df=40, p=0.038). The groups did not differ on measures of letter-cued verbal fluency, design copying, verbal learning, visual learning and recall, or concept formation (p>0.05 in all cases). Time since injury was not correlated with performance on any of the cognitive tests in TBI survivors (p>0.05 in all cases).
 |
Segmented Brain Volumes
Time since injury was not correlated with any gray matter or white matter volumes, total brain volumes, or measures of atrophy (p>0.05 in all cases). As hypothesized, TBI survivors showed significantly smaller white matter volumes (t=2.43, df=40, p=0.02) and lower WM/TICV ratios (t=3.22, df=40, p=0.003) than healthy comparison participants. Overall, the TBI group showed a 0.73 SD reduction in white matter volumes and a 1.1 SD increase in white matter-related atrophy. TBI survivors also showed, on average, a 0.5 SD reduction in total brain volume relative to healthy comparison participants (t=1.88, df=40, p=0.067). The groups did not differ in gray matter volume or GM/TICV ratios (p>0.05 in all cases).
In the TBI group, lower WM/TICV ratios correlated with worse performance on several measures of psychomotor speed, attention, memory and executive functioning. These included the Grooved Pegboard (dominant hand, ρ=−0.70, p=0.006; nondominant hand, ρ=−0.65, p=0.012), Brief Test of Attention (ρ=0.61, p=0.020), word list learning on the HVLT-R (ρ=0.58, p=0.030), visual learning and recall on the BVMT-R (ρ=0.56, p=0.036 and ρ=0.69, p=0.006, respectively), and categories completed on the mWCST (ρ=0.55, p=0.041). There were no associations between GM/TICV ratio and performance on any cognitive test (p>0.05 in all cases). In the healthy comparison group, WM/TBV ratios did not correlate with performance on any cognitive measure (p>0.05 in all cases), whereas lower GM/TICV ratios correlated with worse performance on the Trail Making test, part A (ρ=−0.51, p=0.005), and delayed word recall on the HVLT-R (ρ=0.38, p=0.045).
Voxel-Based Morphometry Comparison of Tissue Concentrations
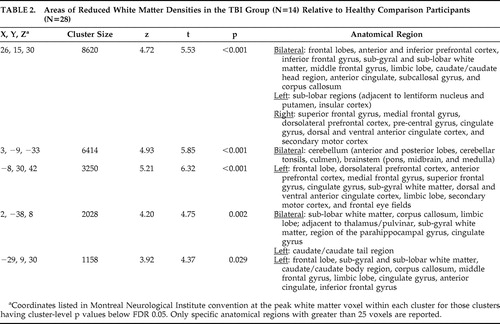
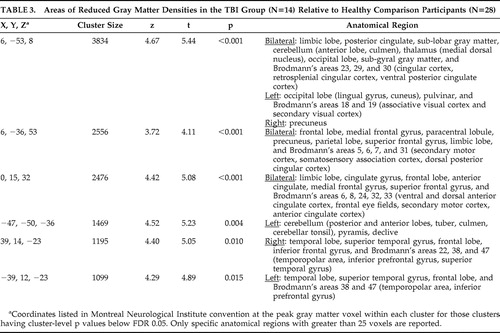
Voxel-based morphometry analyses showed widespread white matter density reductions in patients with TBI relative to healthy comparison participants (t>2.80, df=39, p<0.05). Prominent areas of reduced white matter density were detected in the frontal lobes, limbic region, corpus callosum, cingulate, thalamus, parahippocampal region, and cerebellum ( Table 2 and Figure 1 ). TBI survivors also demonstrated significantly reduced gray matter concentrations relative to the healthy comparison group (t>3.21, df=39, p<0.05). As expected, areas of gray matter reduction were most prominent along the temporal poles. Gray matter density reductions were also seen in central portions of the frontal, parietal, and occipital lobes; cingulate cortex; thalamus; and cerebellum ( Table 3 and Figure 2 ). There were no areas in which TBI survivors showed greater white matter or gray matter concentrations than healthy participants.
 |
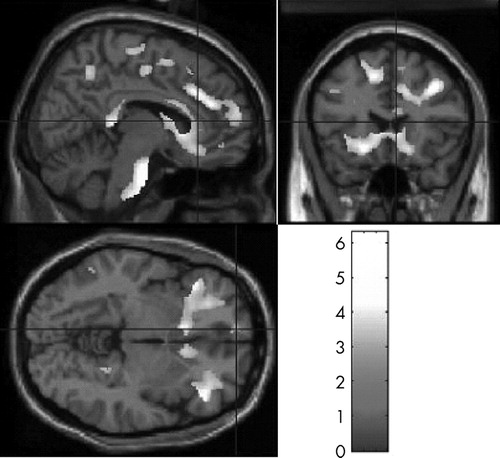
Images in neurological space. The gray bar represents t values.
 |
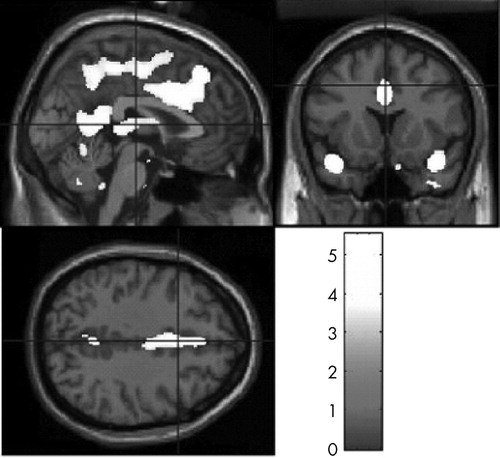
Images in neurological space. The gray bar represents t values.
DISCUSSION
In this study, TBI survivors demonstrated common abnormalities of brain morphology and cognitive functioning despite variation in injury severity, likely location, extent of focal insults, and time since injury. These findings support the idea that diffuse, rather than focal, aspects of brain injury might contribute most to the residual cognitive deficits that result from TBI. 25 One possibility is that injury-related biochemical, neurometabolic, microvascular, and hypoxic-ischemic changes (see Povlishock and Katz for review 4 ) lead to generalized white matter damage despite differences in the location of focal cortical lesions. This could explain why white matter abnormalities correlate most strongly with residual cognitive impairment.
The TBI group performed more poorly than carefully matched comparison subjects on all 12 of the cognitive measures administered, with six of these associations reaching statistical significance. Consistent with previous research, 3 – 5 their worst performances were observed on measures of motor and information processing speed, divided attention, and verbal memory. The effect sizes were substantial, ranging from 0.9 to 2.3 standard deviations below the healthy comparison group means. Ponsford and colleagues 26 recently reported that impaired processing speed, attention, and memory predicted worse concurrent long-term functional outcome across a range of TBI severity. The pattern and magnitude of cognitive deficits they reported are similar to those found in our study. Thus, the morphometric abnormalities observed here might translate into poorer daily functioning for these individuals. We did not assess everyday functioning apart from cognitive performance, but our data provide some evidence in support of this possibility, as only five of the TBI survivors (36%) were employed at the time of study, whereas 24 of the healthy comparison participants (89%) were employed (χ 2 =12.59, p<0.001).
TBI survivors demonstrated reduced white matter and gray matter concentrations and greater white matter atrophy relative to healthy comparison subjects. Total brain volume was slightly reduced in the TBI group (p<0.07), despite the absence of group differences in total intracranial and gray matter volume. These findings are consistent with prior reports that brain injury differentially affects white matter and that this likely accounts for the ventricular enlargement and reductions in total brain volume that often follow TBI. 6 , 27
Further, voxel-based morphometry analyses showed widespread volumetric reductions throughout cerebral and cerebellar white matter tracts. The regions of atrophy found in this study converge with those reported by other investigators based on voxel-based morphometry, regions of interest, tensor-based morphometry, and tissue compartment segmentation approaches. The greatest white matter reductions were seen in frontal and prefrontal regions, 10 , 28 , 29 cingulate cortex and limbic structures, 6 , 28 , 29 corpus callosum, 6 , 10 , 11 , 28 , 29 and cerebellum. 6 , 28 More restricted white matter tissue reductions also appeared in regions adjacent to the thalamus 29 and parahippocampal gyrus. 10 While it seems reasonable to infer that the breadth and distribution of white matter atrophy found in the brains of our TBI survivors may be contributing to their observed cognitive deficits, the current analyses cannot directly speak to this matter. There has been only one previous voxel-based morphometry study to explore the association between white matter reductions and cognition in brain injury survivors. 10 That report, while finding similar areas of white matter atrophy, did not find convincing evidence linking this to performance on cognitive testing. The authors note that this might have been due to the inclusion of participants in relatively acute stages of recovery, as the brain continues to atrophy for many months after TBI. 30 , 31 That study also examined white matter atrophy only in relation to memory. Psychomotor speed or attention might have correlated with white matter abnormalities had they been examined.
Despite the modest decrease in whole-brain gray matter volume among TBI survivors, voxel-based morphometry analyses revealed localized areas of significantly reduced gray matter density. These regions were concentrated within the anterior portion of the temporal poles; in the posterior cingulate; along the medial aspect of the frontal, parietal, and occipital lobes; and within the thalamus and cerebellum bilaterally. Our gray matter findings overlap considerably with studies using other imaging techniques, 28 , 29 as well as with the voxel-based morphometry findings of Gale et al. 9 and Salmond et al. 11 Although whole-brain gray matter volume reductions were not associated with poorer cognitive functioning in our TBI group, this does not preclude the possibility that atrophy of specific gray matter structures might be associated with cognitive changes following TBI. In their voxel-based morphometry study of gray matter changes following TBI, Gale and colleagues 9 found an association between performance on a test of visual sustained attention and gray matter concentrations in the frontal and temporal lobes. It remains unclear whether localized regions of gray matter atrophy are correlated with specific aspects of information processing when assessed with a more comprehensive battery of cognitive tests.
Several limitations to the present study should be noted. Injury severity ratings were made by one of the authors (VR) based, in part, on Glasgow Coma Scale score ranges, but specific Glasgow Coma Scale scores were not recorded, and the presence and duration of altered consciousness were not available for all patients. Lacking more precise quantification of acute brain injury severity precludes clear specification of the clinical population to which these findings generalize. In addition, some might consider the wide range in time since injury as a weakness of this study. However, we regard this as a strength because all participants were examined at a point in time in which structural brain changes should have stabilized. 4
Despite these limitations, the present study revealed widespread white matter atrophy whose severity correlated with aspects of cognitive functioning that are particularly susceptible to disruption by TBI in a long-term follow-up study of TBI survivors compared to carefully matched healthy adults. While it was beyond the scope of this article to examine associations between cognitive functioning and region-specific gray matter or white matter abnormalities on voxel-based morphometry, we currently are conducting these analyses.
1. Rutland-Brown W, Langlois JA, Thomas KE, et al: Incidence of traumatic brain injury in the United States, 2003. J Head Trauma Rehabil 2006; 21:544–548Google Scholar
2. Thurman DJ, Alverson C, Dunn KA, et al: Traumatic brain injury in the United States: a public health perspective. J Head Trauma Rehabil 1999; 14:602–615Google Scholar
3. Schretlen DJ, Shapiro AM: A quantitative review of the effects of traumatic brain injury on cognitive functioning. Int Rev Psychiatry 2003; 15:341–349Google Scholar
4. Povlishock JT, Katz DI: Update of neuropathology and neurological recovery after traumatic brain injury. J Head Trauma Rehabil 2005; 20:76–94Google Scholar
5. Bigler ED: Anterior and middle cranial fossa in traumatic brain injury: relevant neuroanatomy and neuropathology in the study of neuropsychological outcome. Neuropsychology 2007; 21:515–531Google Scholar
6. Bigler ED: Quantitative magnetic resonance imaging in traumatic brain injury. J Head Trauma Rehabil 2001; 16:117–134Google Scholar
7. Ashburner J, Friston KJ: Voxel-based morphometry–the methods. Neuroimage 2000; 11:805–821Google Scholar
8. Good CD, Johnsrude IS, Ashburner J, et al: A voxel-based morphometric study of ageing in 465 normal adult human brains. Neuroimage 2001; 14:21–36Google Scholar
9. Gale SD, Baxter L, Roundy N, et al: Traumatic brain injury and grey matter concentration: a preliminary voxel-based morphometry study. J Neurol Neurosurg Psychiatry 2005; 76:984–988Google Scholar
10. Tomaiuolo F, Worsley KJ, Lerch J, et al: Changes in white matter in long-term survivors of severe non-missile traumatic brain injury: a computational analysis of magnetic resonance images. J Neurotrauma 2005; 22:76–82Google Scholar
11. Salmond CH, Chatfield DA, Menon DK, et al: Cognitive sequelae of head injury: involvement of basal forebrain and associated structures. Brain 2005; 128:189–200Google Scholar
12. Blair JR, Spreen O: Predicting premorbid IQ: a revision of the National Adult Reading Test. Clin Neuropsychologist 1989; 3:129–136Google Scholar
13. Klove H: Clinical neuropsychology, in Medical Clinics of North America. Edited by Forster FM. New York, Saunders, 1963Google Scholar
14. Reitan RM: Validity of the Trail Making test as an indicator of organic brain damage. Percept Mot Skills 1958; 8:271–276Google Scholar
15. Schretlen D: Brief Test of Attention Professional Manual. Odessa, Fla, Psychological Assessment Resources, 1997Google Scholar
16. Rey A, Osterrieth PA: Translations of excerpts from André Rey’s psychological examination of traumatic encephalopathy and PA Osterrieth’s Complex Figure Copy Test. Clin Neuropsychol 1993; 7:4–21Google Scholar
17. Rey A: L’examen psychologique dans les cas d’encephalopathie traumatique. (Les problems.) Archives de Psychologie 1941; 28:215–285Google Scholar
18. Brandt J, Benedict HRB: Hopkins Verbal Learning Test-Revised Professional Manual. Odessa, Fla, Psychological Assessment Resources, 2001Google Scholar
19. Benedict HRB: Brief Visuospatial Memory Test—Revised Professional Manual. Odessa, Fla, Psychological Assessment Resources, 1997Google Scholar
20. Nelson HE: A modified card sorting test sensitive to frontal lobe defects. Cortex 1976; 11:918–932Google Scholar
21. Heaton RK: Wisconsin Card Sorting Test Manual. Odessa, Fla, Psychological Assessment Resources, 1981Google Scholar
22. SPSS: SPSS for Windows, Rel. 15.0, Chicago, SPSS, 2007Google Scholar
23. Mathworks: Matlab, 7th ed. Natick, Mass, MathWorks Inc, 2005Google Scholar
24. Smith CD, Chebrolu H, Wekstein DR, et al: Age and gender effects on human brain anatomy: a voxel-based morphometric study in healthy elderly. Neurobiol Aging 2007; 28:1075–1087Google Scholar
25. Ross BL, Temkin NR, Newell D, et al: Neuropsychological outcome in relation to head injury severity: contributions of coma length and focal abnormalities. Am J Phys Med Rehabil 1994; 73:341–347Google Scholar
26. Ponsford J, Draper K, Schonberger M: Functional outcome 10 years after traumatic brain injury: its relationship with demographic, injury severity, and cognitive and emotional status. J Int Neuropsychol Soc 2008; 14:233–242Google Scholar
27. Blatter DD, Bigler ED, Gale SD, et al: MR-based brain and cerebrospinal fluid measurement after traumatic brain injury: correlation with neuropsychological outcome. AJNR Am J Neuroradiol 1997; 18:1–10Google Scholar
28. Kim J, Avants B, Patel S, et al: Structural consequences of diffuse traumatic brain injury: a large deformation tensor-based morphometry study. Neuroimage 2008; 39:1014–1026Google Scholar
29. Levine B, Kovacevic N, Nica EI, et al: The Toronto Traumatic Brain Injury Study: injury severity and quantified MRI. Neurology 2008; 70:771–778Google Scholar
30. Trivedi MA, Ward MA, Hess TM, et al: Longitudinal changes in global brain volume between 79 and 409 days after traumatic brain injury: relationship with duration of coma. J Neurotrauma 2007; 24:766–771Google Scholar
31. MacKenzie JD, Siddiqi F, Babb JS, et al: Brain atrophy in mild or moderate traumatic brain injury: a longitudinal quantitative analysis. AJNR Am J Neuroradiol 2002; 23:1509–1515Google Scholar