Optical Imaging: A New Window to the Adult Brain
The concept that the functional state of tissue influences its optical properties in observable ways is well accepted. Familiar medical examples include hypoxia-induced cyanosis and anemia-related pallor. Both result from changes in the concentration of oxyhemoglobin (HbO2) and deoxyhemoglobin (HbR). Hemoglobin (Hb) is a chromophore, a chemical group that absorbs light at a specific frequency, thus imparting coloration. Most noninvasive optical neuroimaging approaches presently used in clinical practice and human research are based on using some version of near-infrared spectroscopy (NIRS) to measure intrinsic activation-related changes in the concentrations of oxyhemoglobin and deoxyhemoglobin. Thus, similar to fMRI, optical neuroimaging measures the hemodynamic response to brain activation. Unlike fMRI, which is based on detecting activation-related changes in HbR, NIRS can monitor localized changes in cerebral blood volume and both HbO2 and HbR.
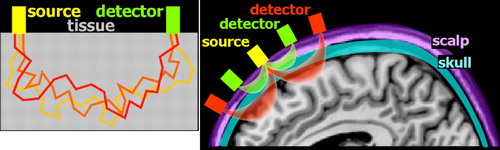
The initial demonstration of NIRS-based noninvasive monitoring of cerebral oxygenation state utilized transmission of light through the tissue of interest (transillumination). 11 While very useful for thinner structures (e.g., finger pulse oximetry), this approach is not well suited to noninvasive monitoring of the adult brain due to the size of the adult head and the thickness of overlying structures (e.g., scalp, skull, dura, CSF). It was not until the development of techniques based on detection of light emerging from the surface near the light source that NIRS began to be more widely utilized for human research. 12 The interaction between light and tissue depends upon scattering and absorption at the particular wavelength. 2 – 7 Scattering decreases with increasing wavelength. Compared to visible light, light in the near-infrared range easily penetrates into tissue. Unlike X-ray photons, which travel in a straight line through soft tissues (due to their higher energy), near-infrared photons will change direction multiple times ( Figure 1 ). Although comparatively less in the near-infrared range, scatter limits penetration depth and spatial resolution. Absorption in the near-infrared range is primarily due to the presence of endogenous chromophores such as water, hemoglobin, bilirubin, and cytochrome ( Figure 2 ). Tissue penetration is best at wavelengths between ∼700–900 nm. (Depth sensitivity is limited by hemoglobin absorption below this range and water absorption above it.) In this range, sometimes called the “biological optical window” or the “medical spectral window,” light can penetrate into tissue as much as several centimeters and still return to detectors at the surface. The separation between the source and detector is an essential factor in determining depth sensitivity, as photons reaching a detector farther from the source are more likely to have penetrated more deeply ( Figure 1 ). 13 Thus, signals from closely spaced source-detector pairs will be more sensitive to superficial tissues (e.g., scalp). This can be used to mathematically compensate for the effects of signal from superficial tissues on signals acquired from more widely spaced source-detector pairs.
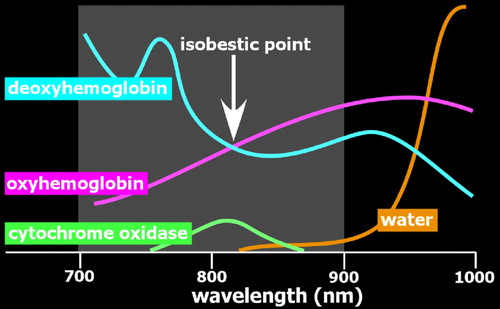
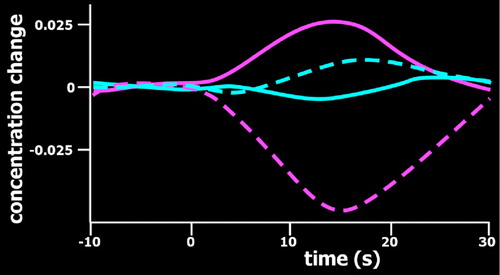
Optical imaging requires the use of devices (known as optodes) for coupling light between an optoelectronic component (e.g., light source, photodetector) and a surface (e.g., skin, scalp). 2 – 7 By utilizing more than one wavelength of light, measurements can be made that are differentially sensitive to changes in oxyhemoglobin and deoxyhemoglobin ( Figure 2 ). Some wavelengths are equally sensitive to both (isobestic points). At an isobestic point, changes in total hemoglobin concentration (HbT) can be measured directly. Although there are methods for measuring absolute concentrations, most optical imaging measures change relative to initial conditions ( Figure 3 ).
There are three major methods of noninvasive optical imaging. 2 – 7 The simplest approach is the original continuous wave method in which light sources provide a signal of constant amplitude and detectors measure light amplitude attenuation. Under these conditions, it is not possible to directly measure the scattering properties of tissue which cause photons to travel along different paths (and have different pathlengths) between the source and detector ( Figure 1 ). Assumption-based modeling and computer simulations are required to estimate these effects. Advantages of the continuous wave method include low cost; high safety (it can be done with light emitting diodes [LEDs]); and smaller, very portable equipment that is easily used in clinical settings and natural environments. Major disadvantages are limited spatial resolution (particularly in the more portable systems) and provision of relative rather than absolute measures of concentration change. The more complex time-resolved and frequency-domain approaches to optical imaging both provide better sensitivity, but require use of laser light sources, which increase cost and introduce potential safety issues. For time-resolved optical imaging, a pulsed laser is used as the light source, and the time it takes photons to arrive at the detector is measured (time of flight). 14 One benefit of this approach is that early arriving photons (short time of flight) have penetrated less deeply into tissue (shorter pathlength). Thus, the temporal distribution of photons can be used to resolve depth. For frequency-domain optical imaging, the light source is modulated and the phase delay (phase shift) of light at the detector(s) provides a measure of time of flight. 15 Greater phase delay indicates photons that have traveled more deeply (longer pathlength). Optimizing analysis of these types of data in order to improve depth sensitivity and quantitation is an area of very active research.
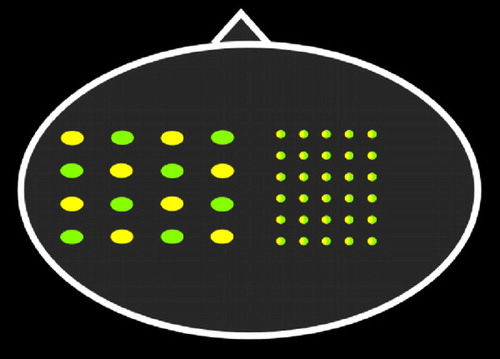
The two methods for analyzing noninvasive optical neuroimaging data in humans are optical topography and diffuse optical tomography (DOT). Optical topography is done with a sparse array ( Figure 4 ). Pairs of light-emitting and light-detecting optodes are separated by 2–4 cm, providing lower (generally >5 mm) spatial resolution. Point measurements are interpolated into a 2D topographic activation map that can be roughly superimposed onto the area of brain underlying the probe array. Diffuse optical tomography is generally done with a denser array ( Figure 4 ). 16 – 18 Dense arrays provide source-detector pairs with multiple separations. As noted in Figure 1 , pairs that are close together will be more sensitive to superficial tissues (e.g., scalp, skull), whereas pairs with a greater separation will be more sensitive to deeper tissues (e.g., cortex). In diffuse optical tomography, overlapping information from multiple detector pairs can be combined in the form of a model-based 3D image reconstruction. Reconstructing data can improve depth sensitivity and decrease physiological noise. Recent studies have demonstrated the feasibility of much higher resolution mapping of limited areas of the cortex using tomographic reconstruction approaches. 16 , 18 , 19
As described in recent review articles, optical neuroimaging has been utilized to study motor, sensory, and cognitive task-related activations in multiple populations including the very young and elderly and individuals with psychiatric disorders. 2 – 4 Recent studies illustrate the application of optical neuroimaging to processes and tasks that previously were not amenable to functional imaging. Monitoring during performance in more naturalistic situations allows exploration of complex cognitive functions. For example, a study that acquired repeated measures while the subjects performed a simulated naval air warfare management task that varied on task load, task difficulty, and requirement for divided attention found positive correlations between level of activations and level of performance. 20 Similarly, a study that acquired repeated measures while the subject was playing a game of Japanese chess ( shogi ) was able to correlate the cognitive demand level of the game stage with location and extent of activation. 21 Another that acquired repeated measures during a conversational task supports the potential for studying social interactions in a natural setting. 22 Other studies comparing task-related activation during actually performing a motor task versus some form of pretence (e.g., peeling an apple versus making similar hand motions, physically executing a movement versus mentally imagining performing it) have found that the activations differ, underscoring the importance of a functional imaging technique that allows subjects to move freely. 23 , 24
Optical neuroimaging also has the potential to improve clinical management in a variety of ways. For example, it may be useful for early diagnosis of some conditions. A recent study evaluated the potential of optical neuroimaging to inform diagnosis of Alzheimer’s disease based on the known early onset of visuospatial deficits in this population. 25 Performance was similar between groups on a simple line orientation naming task, but patients with mild-moderate dementia likely due to Alzheimer’s disease had much less activation in parietal cortex compared to age-matched healthy individuals. As noted by the authors, studies of individuals with mild cognitive impairment are required to fully evaluate the potential diagnostic utility of this approach. Initial studies in which optical neuroimaging has been combined with treatment indicate the potential of this technique to monitor treatment response and provide insight into the processes underlying clinical efficacy. 26 , 27
Similar to other neuroimaging methods, individual differences in physiology and anatomy are a potentially important source of variability in optical neuroimaging. Study participants can differ considerably in the proportion of hemoglobin in the arterial and venous compartments, as well as in total hemoglobin concentration. 7 Thickness and composition of the superficial layers, especially the skull and CSF, also vary across individuals. In some studies, addition of structural imaging (e.g., MRI, CT) has been used to improve localization by using models of light propagation that are based on the individual subject’s anatomy.
Optical neuroimaging is a relatively new addition to the field of functional neuroimaging, and there is little standardization as of yet. There is a growing effort within the optical imaging community to develop a more systematic framework for experimental design and data analysis. 5 , 6 , 28 One area of particular concern is minimizing factors that degrade the signal of interest. Inadequate shielding and/or poor coupling between optode and skin can allow ambient light to reach detectors. This has been addressed in multiple ways including decreasing ambient light (e.g., dim room light, covering sensor array with dark or opaque material), filtering, and differential detection. Movement of sources and detectors relative to the scalp can also cause significant changes in the coupling of light into and out of the head. Hair exacerbates this problem since it is highly absorbing (due to its melanin content) and can interfere with probe contact, causing fluctuations in light delivery and detection during movement. Thus, in addition to spring-loading of optodes to improve contact, secure anchoring of the probe array is essential. Elasticized bandages are commonly used to hold smaller arrays in place. Caps and helmets have been developed to accommodate larger arrays and tasks requiring more movement. Optimizing the probe design to match the demands of the desired task is recommended. Identification of motion artifacts can be done by visual inspection of data, as they are generally very large compared to the signal. Statistical methods for motion detection/correction (e.g., outlier detection, principal component analysis) have also been developed. Physiological noise (e.g., respiration, heart rate, etc.) will also be present. Filtering, signal averaging, gating, and comparing signals from near and distant detector pairs have all been used to decrease its impact on signal. 5 , 6 , 28
In summary, noninvasive optical imaging is an exciting new approach to functional neuroimaging with many advantages for use in psychiatric research. These include the ability to perform studies in a wide range of settings and in patient populations unable to tolerate confinement or loud noises. There is clear potential for applications to clinical care. In addition, there are optical imaging techniques in much earlier stages of development that hold the potential of providing entirely new types of information. One approach may allow optical imaging of brain activation directly by measurement of activation-induced intrinsic light scattering changes. 15 , 29 Another is development of fluorescent compounds that may have use as optical contrast agents. 30 , 31 Thus, optical imaging may provide a future tool for both assessment and monitoring treatment response in psychiatric illness.
1. Pfurtscheller G, Bauernfeind G, Wriessnegger SC, et al: Focal frontal (de)oxyhemoglobin responses to simple arithmetic. Int J Psychophysiol 2010; 76:186–192Google Scholar
2. Arenth PM, Ricker JH, Schultheis MT: Applications of functional near-infrared spectroscopy (fNIRS) to neurorehabilitation of cognitive disabilities. Clin Neuropsychol 2007; 21:38–57Google Scholar
3. Obrig H, Villringer A: Beyond the visible-imaging the human brain with light. J Cereb Blood Flow Metab 2003; 23:1–18Google Scholar
4. Irani F, Platek SM, Bunce S, et al: Functional near infrared spectroscopy (fNIRS): an emerging neuroimaging technology with important applications for the study of brain disorders. Clin Neuropsychol 2007; 21:9–37Google Scholar
5. Hillman EM: Optical brain imaging in vivo: techniques and applications from animal to man. J Biomed Opt 2007; 12:051402Google Scholar
6. Huppert TJ, Diamond SG, Franceschini MA, et al: HomER: a review of time-series analysis methods for near-infrared spectroscopy of the brain. Appl Opt 2009; 48:D280–D298Google Scholar
7. Murkin MJ, Arango, M: Near-infrared spectroscopy as an index of brain and tissue oxygenation. Br J Anaesth 2009; 103:i3–13Google Scholar
8. Toet MC, Lemmers PMA: Brain monitoring in neonates. Early Hum Dev 2009; 85:77–84Google Scholar
9. Giacomini M, Bolzon M: NIRS: a useful light in a dark world? Minerva Anestesiol 2010 Jun 28. [Epub ahead of print]Google Scholar
10. Robertson CS, Zager EL, Narayan RK, et al: Clinical evaluation of a portable near-infrared device for detection of traumatic intracranial hematomas. J Neurotrauma 2010; 27:1597–1604Google Scholar
11. Jobiss F: Noninvasive, infrared monitoring of cerebral and myocardial oxygen sufficiency and circulatory parameters. Science 1977; 198:1264–1267Google Scholar
12. Villringer A, Chance, B: Non-invasive optical spectroscopy and imaging of human brain function. Trends Neurosci 1997; 20:435–442Google Scholar
13. Mansouri C, L'huillier JP, Kashou NH, et al: Depth sensitivity analysis of functional near-infrared spectroscopy measurement using three-dimensional Monte Carlo modelling-based magnetic resonance imaging. Lasers Med Sci 2010; 25:431–438Google Scholar
14. Wabnitz H, Moeller M, Liebert A, et al: Time-resolved near-infrared spectroscopy and imaging of the adult human brain. Adv Exp Med Biol 2010; 662:143–148Google Scholar
15. Gratton G, Fabiani M: Fast optical imaging of human brain function. Front Hum Neurosci 2010; 4:52Google Scholar
16. Koch SP, Habermehl C, Mehnert J, et al: High-resolution optical functional mapping of the human somatosensory cortex. Front Neuroenergetics 2010; 2:12Google Scholar
17. Gregg NM, White BR, Zeff BW, et al: Brain specificity of diffuse optical imaging: improvements from superficial signal regression and tomography. Front Neuroenergetics 2010; 2:14Google Scholar
18. White BR, Culver JP: Phase-encoded retinotopy as an evaluation of diffuse optical neuroimaging. Neuroimage 2010; 49:568–577Google Scholar
19. White BR, Snyder AZ, Cohen AL, et al: Mapping the human brain at rest with diffuse optical tomography. Conf Proc IEEE Eng Med Biol Soc 2009; 2009:4070–4072Google Scholar
20. Izzetoglu M, Bunce SC, Izzetoglu K, et al: Functional brain imaging using near-infrared technology. IEEE Eng Med Biol Mag 2007; 26:38–46Google Scholar
21. Ogata K, Honda N: Study of change in brain activity due to blood flow while playing Shogi (Japanese chess). Electromyogr Clin Neurophysiol 2010; 50:137–148Google Scholar
22. Suda M, Takei Y, Aoyama Y, et al: Frontopolar activation during face-to-face conversation: an in situ study using near-infrared spectroscopy. Neuropsychologia 2010; 48:441–447Google Scholar
23. Okamoto M, Dan H, Shimizu K, et al: Multimodal assessment of cortical activation during apple peeling by NIRS and fMRI. Neuroimage 2004; 21:1275–1288Google Scholar
24. Amemiya K, Ishizu T, Ayabe T, et al: Effects of motor imagery on intermanual transfer: a near-infrared spectroscopy and behavioral study. Brain Res 2010; 1343:93–103Google Scholar
25. Zeller JB, Herrmann MJ, Ehlis AC, et al: Altered parietal brain oxygenation in Alzheimer’s disease as assessed with near-infrared spectroscopy. Am J Geriatr Psychiatry 2010; 18:433–441Google Scholar
26. Aoyama Y, Hanaoka N, Kameyama M, et al: Stimulus intensity dependence of cerebral blood volume changes in left frontal lobe by low-frequency rTMS to fight frontal lobe: a near-infrared spectroscopy study. Neurosci Res 2009; 63:47–51Google Scholar
27. Ohtani T, Matsuo K, Kasai K, et al: Hemodynamic responses of eye movement desensitization and reprocessing in posttraumatic stress disorder. Neurosci Res 2009; 65:375–383Google Scholar
28. Orihuela-Espina F, Leff DR, James DR, et al: Quality control and assurance in functional near infrared spectroscopy (fNIRS) experimentation. Phys Med Biol 2010; 55:3701–3724Google Scholar
29. Sable JJ, Rector DM, Gratton G: Optical neurophysiology based on animal models. IEEE Eng Med Biol Mag 2007; 26:17–24Google Scholar
30. Liebert A, Wabnitz H, Obrig H, et al: Non-invasive detection of fluorescence from exogenous chromophores in the adult human brain. Neuroimage 2006; 31:600–608Google Scholar
31. Steinbrink J, Liebert A, Wabnitz H, et al: Towards noninvasive molecular fluorescence imaging of the human brain. Neurodegener Dis 2008; 5:296–303Google Scholar