Cognitive Correlates of Human Brain Aging
Abstract
The relations between age-related changes in brain structure and neuropsychological test performance in 320 elderly nonclinical volunteers (ages 66–90) were examined by using quantitative MRI data and measures of attention, information processing speed, language, memory, and visuospatial ability. Final path analyses revealed significant brain–behavior relationships for two of the six cognitive measures: the Trail Making Test part B and visual delayed memory. Poorer performance on Trails B was associated with smaller cerebral hemisphere volumes and larger volumes of peripheral CSF, lateral ventricles, and third ventricle. Poorer recall on visual delayed memory was associated with larger volumes of the lateral ventricles and third ventricle. The findings demonstrate a relationship between age-related changes in brain structure and an age-related decline in attention, psychomotor speed, and visual delayed memory. The neurobiological basis for this relationship requires further investigation.
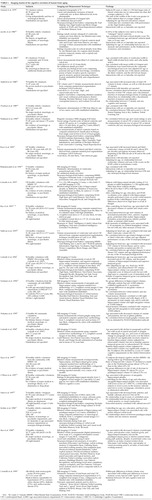
In vivo imaging studies have demonstrated that advancing age in humans is generally associated with decreased brain tissue size and increased brain cerebrospinal fluid (CSF) volume (reviewed by Coffey).1 In addition, aging may be characterized cognitively by generalized slowing of cognitive function and by decreased working memory.2,3 Only a small literature has examined whether the age-related changes in brain structure are related to the cognitive changes that accompany normal or usual aging. Furthermore, these studies have produced conflicting findings and they are difficult to compare given differences in subject samples (e.g., sample size, age range, exclusion criteria), imaging and data acquisition protocols (e.g., computed tomography [CT] vs. magnetic resonance [MR] imaging), brain measurement technique, cognitive test measures, and statistical analyses (Table 1).1,4–26
The present study used quantitative MR imaging morphometry to examine relationships between cognitive aging and age-related changes in the size of the cerebral hemispheres and CSF spaces in a large sample of elderly volunteers living independently in the community and with Mini-Mental State Examination (MMSE) scores of 24 or greater. We chose a set of measures that are known to be sensitive to aging, to test the hypothesis that age-related cognitive changes would be greater in those subjects with more extensive age-related changes in brain structure.
METHODS
Subjects
Subjects were selected from participants in the Cardiovascular Health Study (CHS), an ongoing multicenter, population-based observational study of 5,888 adults 65 years and older, including 2,495 men and 3,393 women.27–29 The major goal of the CHS is to identify risk factors related to the development and course of coronary heart disease and stroke in individuals living independently in the community. After providing informed consent, subjects undergo extensive clinical evaluation (home interview and physical examination) and laboratory testing (including brain MR imaging; see below) at baseline and at annual follow-up assessment. Additional details of the CHS have been published.27
A detailed description of recruitment for the CHS subjects has been published.28,29 For the present study, we identified from the CHS cohort a sample of 500 subjects recruited from two CHS sites (Pittsburgh, PA, and Hagerstown, MD) who gave written consent to participate in an ancillary investigation of cognitive functioning and aging (measures included the MMSE and a cognitive test battery; these data will be the subject of a future report).30 All available subjects from these two sites in whom brain MR imaging was performed within 1 year of this cognitive testing were screened for inclusion in this study. We subsequently excluded from this cohort a total of 170 subjects for one or more of the following reasons: not right-handed (subjects were determined to be right-handed if they used their right hand to write, throw a ball, and brush their teeth),31 lifetime history of any psychiatric illness (including dementia) or of any illness or injury referable to the brain (per the CHS clinical evaluation described earlier), incomplete cognitive test data, incomplete MR imaging data (e.g., scan artifact, missing slices), or MR images with structural abnormalities (cortical infarct, n=5; hydrocephalus, n=1; tumor, n=1; markedly thickened calvaria, n=1).32–34 For the present investigation, we excluded 10 additional subjects with scores less than 24 on the MMSE (administered per the ancillary investigation of cognitive functioning described above) to further ensure the absence of cognitive impairment. A cutoff score of 24 on the MMSE is a well-accepted measure of significant cognitive impairment consistent with dementia in the elderly.35
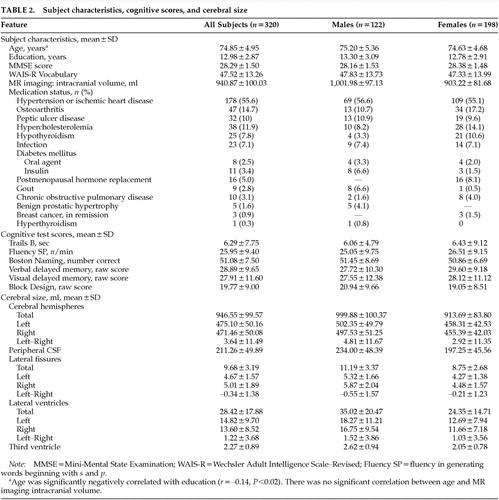
The final sample (Table 2) consisted of 320 subjects, 198 women (62%) and 122 men (38%), ranging in age from 66 to 90 years. This sample was included in an earlier study of the relationship of education to brain size in normal aging.36 The sample was similar to the CHS population as a whole with regard to age (CHS mean±SD=72.77±5.61 years), sex distribution (CHS=59% female), and years of education (CHS mean±SD=12.35±3.10 years). Years of education were determined by subjects' responses to a structured interview and defined as the number of years of full-time education normally required to reach the subject's reported final level (e.g., 10th grade=10 years; bachelor's degree=16 years). Subjects with a high school equivalency diploma (GED) were credited with 12 years. Of the 320 subjects, 226 (71%) were taking medications for one or more medical conditions (see Table 2). No subject was taking medication known to affect brain size (e.g., steroids). Additional subject characteristics are given in Table 2.
Cognitive Test Battery
Cognitive function was assessed by using a one-and-a-half- to two-hour battery of standard neuropsychological tests. This assessment was completed at the CHS annual evaluation 2 and 3 years after CHS baseline (i.e., in 1991 and 1992). The battery included measures of attention and information processing speed, language, memory, and visuospatial ability. For purposes of the present study, the following six scores were derived from the test battery:
Trails B: Scores (time per connection) for part B of the Trail Making Test,37 a measure of psychomotor speed and working memory. Time per connection was used as the measure of interest in order to distinguish among subjects who failed to complete the test in the allotted 300 seconds.
Fluency SP: Sum of scores from two verbal fluency tasks (number of words beginning with p and number of words beginning with s generated in 60 seconds), a measure of language and executive function.38
Boston Naming: Total confrontation naming score (spontaneously correct plus correct following a stimulus cue) from the Boston Naming Test,39 a language measure.
Verbal delayed memory: Comprises the delayed recall of the two short stories (Logical Memory) together with the weighted raw delayed recall score (Verbal Paired Associate Learning task) of the Wechsler Memory Scale–Revised,40 a widely used standard test of explicit memory.
Visual delayed memory: Comprises the delayed recall score from the four Visual Reproduction Figures together with the weighted raw delayed recall score from the Visual Paired Associate Learning test, both of the Wechsler Memory Scale–Revised.40
Block Design: Raw score on the Block Design subtest of the Wechsler Adult Intelligence Scale–Revised (WAIS-R),41 a measure of visuospatial/constructional ability.
Brain MR Imaging Scanning Technique
As noted earlier, brain MR imaging was performed on all subjects as a part of their participation in the CHS. The standardized CHS brain MR imaging acquisition protocol has been previously described.42 MR imaging was performed on either a 1.5-tesla scanner (General Electric, Milwaukee, WI; n=244) or a 0.35-tesla scanner (Toshiba; n=76) at one of two CHS field centers (Pittsburgh and Hagerstown, respectively). Head position was oriented in the scanner and was stabilized during the scanning procedure by the use of Velcro straps and foam head supports. To establish slice orientation, the first scanning sequence consisted of a T1-weighted sagittal series (TR repetition time=500 ms; TE echo time=20 ms; thickness=5 mm; gap=0 mm; matrix=128×256) centered at the midline to define the anterior commissure–posterior commissure (AC-PC) line. Then, a second series of proton density images (TR=3,000 ms, TE=30 ms, flow compensated) and T2-weighted (TR=3,000 ms, TE=100 ms, flow compensated) images was obtained (thickness=5 mm; gap=0 mm; matrix=256×192; number of excitations, one-half (1 on the 0.35-T scanner), oriented parallel to the AC-PC line, and extending from the vertex to the skull base. A third series consisting of T1-weighted axial images (TR=500 ms, TE=20 ms) was then obtained (thickness=5 mm; gap=0 mm; matrix=256×192; number of excitations=1), oriented parallel to the AC-PC line and extending from vertex to skull base. Images were stored on 9-track magnetic tape.
Image Analysis and Brain Morphometry
For the present study, the brain images were transferred from magnetic tape to read/write magneto-optical disks. Data were analyzed on a workstation (Power Mac 8100, Apple, Cupertino, CA) with high-resolution color graphic monitor. The measurements of regional brain size were made on the recalled T1-weighted axial images by one of two trained technicians blinded to all subject characteristics. Window center settings were first standardized to ensure precision in boundary detection.43 Structures were identified with the help of brain and MR imaging atlases44,45 and then measured with a combination of computer-assisted edge detection and manual tracing, using graphic analysis software (MedVision, Imnet/Evergreen Technologies, Castine, ME). The area (in square centimeters) within the outline was calculated automatically; volume (in milliliters) was determined by multiplying the area by the slice thickness and summing over the multiple slices in which the structure appeared (described later).
The following regions were defined for volume measurement:46
Intracranial volume (IV) was defined by the internal surface of the diploë47 and measured in every slice between the vertex and the superior border of the midbrain; approximately 12 to 15 slices per subject were measured. Intracranial size could not be reliably measured inferior to this level because of the presence of structures such as the globes and sinuses. As such, this measure is an underestimate of the true total intracranial volume. There was no significant correlation between age and intracranial volume.
Cerebral hemisphere volume was measured in every slice between the vertex and the skull base (approximately 18 to 20 slices per subject). Ventricular volumes were excluded from this measurement.
Peripheral (sulcal) CSF volume was a calculated value derived by subtracting the cerebral hemisphere and ventricular volumes from the intracranial volume, for each slice on which intracranial volume was measured. As such, this measure is an underestimate of the true total peripheral CSF volume.
Lateral (Sylvian) fissure CSF volume provided an indirect estimate of atrophy of the temporal lobe, as well as of the frontal and parietal lobes. The lateral fissures were measured in each slice on which they were present, beginning at the level of the foramen of Monro. When the lateral fissure communicated freely with the peripheral CSF, the anterior boundary of the fissure was defined by a horizontal line connecting the anterior tip of the temporal lobe to the medial temporal region.
Lateral ventricle volume was measured in each slice on which lateral ventricles were present. We also measured the various subregions of the lateral ventricles, including the body, the frontal horns, the posterior horns, and the temporal horns.
Third ventricle volume was measured in each slice beginning at the level of the foramen of Monro and extending inferiorly to the superior border of the midbrain (approximately 3 to 4 slices per subject).
Extensive reliability studies of our measurement techniques have indicated that our measurements of these regions are highly reliable.47 On the basis of a randomly selected sample of 10 brains from the current study,46 intraclass correlation coefficients for interrater reliability of the two raters ranged from 0.85 (for small regions such as the third ventricle) to 0.99 (for large regions such as the cerebral hemisphere). Similarly, intraclass correlation coefficients for intrarater reliability ranged from 0.84 to 0.99.
Statistical Analysis
Exploratory data analyses (boxplots, quantile-quantile plots, density plots, and resistant estimators of location and spread) were undertaken to review the distributions of the variables and identify distribution anomalies, outliers, extreme values, and floor or ceiling effects. These analyses revealed that all of the variables showed reasonably Gaussian distributions except for Trails B, which exhibited extreme right-skewness. A logarithmic transformation of Trails B yielded a nearly Gaussian distribution. All references to Trails B that follow are to the log-transformed version.
Path analysis was chosen as the primary statistical method. The path-analytic model was assembled in 5 sections. The first section comprised the estimation of each of the 5 adjusted cerebral volumes. Each adjusted volume was estimated as the residual from regressing it against 4 adjustment variables known to be associated with cerebral size: IV, sex, age, and the age-by-sex interaction.46 The second section comprised the estimation of the 6 adjusted cognitive test scores. Each adjusted score was estimated as the residual from regressing it against 4 adjustment variables associated with cognitive performance: education, sex, age, and the age-by-sex interaction. The third section comprised the estimation of 10 correlations among the 5 adjusted volumes. The fourth section comprised the estimation of the 15 correlations among the 6 adjusted tests scores. The fifth section, which contained the parameters of primary interest, comprised the estimation of the 30 correlations between each adjusted test score and each adjusted brain volume.
The final path-analytic model contained 141 parameters to be estimated from 152 sample moments. The parameters were simultaneously estimated by full information maximum likelihood (FIML), using the computer program Amos 4.0.48 Missing data occurred in 5 of the 320 subjects. One subject had no fluency score, one had no Boston Naming score, one had neither verbal delayed memory nor visuospatial delayed memory scores, and two had no scores for block design and verbal delayed memory. The missing data were assumed to be missing at random;49,50 therefore all other data for these subjects were retained in the data set. Under this assumption, the FIML procedure mentioned above allows the estimation of parameters with incomplete data.48,51
In a statistical model of this complexity, a natural and reasonable consideration is whether to reduce the complexity with either principal components analysis or latent variable factor analysis. These methods were considered but rejected because the primary interest here was in the relationships between specific, validated cognitive tests and specific brain regions. These alternatives would have melded the tests into composite scores and the brain volumes into composite volumes that would have obscured the patterns among individual tests and individual regions.
RESULTS
The cognitive test results and the regional cerebral volumes are shown in Table 2.
Effects of Age on Cerebral Volumes and on Cognitive Test Performance
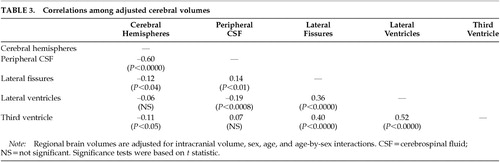
As previously reported,36 age was highly significantly related to regional brain volumes. Adjusting for the effects of IV and sex, increased age was associated with smaller cerebral hemisphere volume (b=–2.46, P<0.003) and with larger volumes of the lateral fissures (b=0.13, P<0.0001), the lateral ventricles (b=0.98, P<0.0001), and the third ventricle (b=0.05, P<0.0001), where b is the unstandardized regression coefficient. In addition, significant correlations were observed among the volumes of most of the brain regions (Table 3).
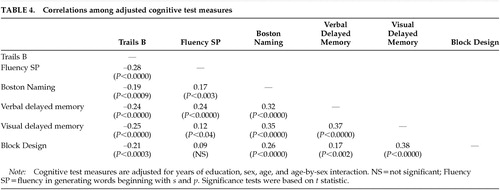
Age was also significantly related to cognitive test performance. Adjusting for the effects of education and sex, increased age was associated with poorer performance on Trails B (b=0.03, P<0.0001), verbal delayed memory (b=–0.45, P<0.0001), visual delayed memory (b=–0.69, P<0.0001), and Block Design (b=–0.41, P<0.0001). In addition, a significant age-by-sex interaction was found for Boston Naming (P<0.0003), with males (b=–0.587) showing a greater age-related decrement in scores than females (b=–0.045). Significant correlations were also observed among the scores of most of the cognitive test measures (Table 4).
Relationships Between Cognitive Test Performance and Cerebral Volumes
Initial analyses revealed no evidence for a differential effect of sex (male vs. female) or of cerebral hemisphere laterality (left vs. right) upon correlations between cognitive test performance and cerebral volumes. Consequently, all subsequent analyses were based on the total sample (males plus females) and used total (left plus right hemisphere) cerebral volumes.
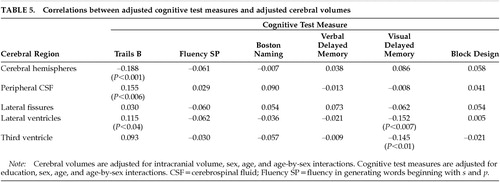
The path analyses revealed significant brain–behavior relationships for two of the six cognitive test measures: Trails B and visual delayed memory (Table 5). Performance on adjusted Trails B was significantly related to the adjusted volumes of the cerebral hemispheres, the peripheral CSF, the lateral ventricles, and the third ventricle. Longer times (poorer performance) on adjusted Trails B were associated with smaller adjusted cerebral hemisphere volumes (r=–0.19, P<0.001, effect size [ES]=0.30), as well as with larger adjusted volumes of the peripheral CSF (r=0.16, P<0.006, ES=0.25) and the lateral ventricles (r=0.12, P<0.04, ES=0.19). Adjusted visual delayed memory was significantly related to the adjusted volumes of the lateral and third ventricles. Poorer recall on adjusted visual delayed memory was associated with larger adjusted volumes of the lateral ventricles (r=–0.15, P<0.007, ES=0.24) and the third ventricle (r=–0.15, P<0.01, ES=0.23). No relationships were observed between the four remaining cognitive test measures and any of the brain regions examined.
DISCUSSION
In this large sample of 320 elderly individuals living independently in the community, increased age was associated with cerebral atrophy and ventricular enlargement, as well as with decreased performance on tests of attention and psychomotor speed, memory, and visuospatial construction. Our study has the advantage of a relatively large sample selected from community-dwelling participants who did not present for medical care, and, as such, our results are more likely to be representative of the community. In addition, our blinded measures of brain structure were highly reliable, and our estimates of their age-specific sizes agree closely with previous reports, including those using more sophisticated voxel-by-voxel tissue classification techniques.1 Our findings of age-related reductions in cognitive test performance are also consistent with the extant literature.2,3
The age-specific changes in cerebral size were associated with poorer performance on two of the cognitive test measures. First, cerebral atrophy (as measured by both decreased cerebral hemisphere volume and by increased peripheral CSF volume) and lateral ventricular enlargement were each associated with poorer performance on Trails B, a measure of attention, psychomotor speed, and working memory. Second, enlargement of the lateral ventricles and the third ventricle was associated with poorer visual delayed memory. Our interpretation of a complex pattern of correlations among brain structure and cognitive test variables was facilitated by the use of path analysis. Path analysis provided the simultaneous multivariate estimation of the adjusted brain volumes, the adjusted test scores, the mutual correlations among the adjusted brain volumes, the mutual correlations among the adjusted test scores, and the correlations between adjusted brain volumes and adjusted test scores.
Methodological Limitations
Our findings are subject to certain potential limitations. Although cross-sectional studies of age effects allow for relatively efficient and rapid acquisition of large amounts of data, they are subject to secular effects such as birth cohort.46 This effect refers to the possibility that brain size, like cranial size, may exhibit systematic changes over successive birth cohorts in the general population. If such trends actually exist in the population at large and if they are not secondary to secular trends associated with correlates such as cranial size (note that in the present study intracranial volume was not correlated with age), then an assessment of the true effects of aging per se on brain volume will require longitudinal investigation.
A second issue relates to the health status of our subjects. Our sample represents a group that may be somewhat healthier than the entire elderly population because of selection criteria for the CHS and the current study.28,29 As such, our findings may not be applicable to the entire population of seniors. There is also heterogeneity of health status within our subjects, in that 29% were free of major systemic illness and 71% had at least some mild physical disease, corresponding to the distinction between successful and usual aging.52 Such differences in health status could account for differences in brain aging, and indeed systemic disease such as hypertension has been found to be associated with changes in brain structure.42,53,54 In our sample, however, the presence of hypertension/ischemic heart disease was not associated with brain size (Wilks' lambda=0.95, df=13,306, P=0.26). Finally, it is possible that at least some subjects in our sample may have experienced undetected cognitive decline despite our screening and exclusionary criteria. Still, our use of an MMSE cutoff score of 24 is widely accepted in the literature35 and represents an appropriate strategy for selection of a sample that is representative of the community-resident “usual aging” population.
Third, there exists the possibility of a Type I error in our findings because many correlations were tested. Thus, our analyses must be considered exploratory, and our finding of a relationship requires confirmation by additional hypothesis-testing research.
Fourth, the tests used in this study constituted part of a larger test battery that was originally chosen to be maximally sensitive to aging rather than for its potential to provide information about the neuroanatomic basis of cognitive function. Many tests that are sensitive to aging, such as Trails B, are thought to be measures of functions (like information processing speed) that may be more diffusely represented in the brain. Therefore, the original purpose for the battery of tests used in this study may have led to the selection of instruments that are sensitive to global age-related changes but less suitable for the investigation of focal brain–behavior relationships. Consequently, tests such as Trails B may be particularly likely to correlate with the global anatomic variables reported in this study but less likely to be related to focal, lateralized brain changes.
Finally, the measurements of cerebral size in our study are subject to certain limitations.1 First, because of limitations inherent in the CHS MR imaging acquisition protocol, our analyses of cerebral size were restricted to the axial plane; three-dimensional reconstruction was not possible without dramatic loss of resolution. Second, accurate delineation of regional boundaries can be affected by several sources of technical error, including improper window center settings, magnetic field inhomogeneity (resulting in spatial distortion of objects and object pixel nonuniformity), and differences in MR imaging technical variables.43 The effects of these variables were minimized in this study by using a set of procedures that has been shown to optimize the accuracy of MR imaging size measurements.43,47 Third, field strength differences between the two scanners could affect estimates of brain size.1 Including scanner assignment in the path analysis did not, however, alter any of the correlations between cerebral volumes and neuropsychological test measures in our study.
Cognitive Correlates of Age-Specific Changes inCerebral Size
The following cognitive correlates with age-specific changes in cerebral size emerged from the present study:
Attention and Psychomotor Speed. We found that the two hallmarks of brain aging, cerebral atrophy (as measured both by decreased cerebral hemisphere volume and increased peripheral CSF volume) and ventricular enlargement, were each associated with poorer performance on the Trail Making Test, a measure of attention, psychomotor speed, and working memory. Our results are consistent with those of Earnest et al.,5 who observed that ventricular enlargement on CT was associated with poorer performance on the Digit Symbol subtest of the WAIS-R, a measure of attention and psychomotor speed (Table 1). In contrast, most of the extant literature reports no relationship between measures of attention and psychomotor speed and either cortical atrophy4,5,24–26 or ventricular enlargement,5,25 including studies using the Trail Making Test (Table 1).4,5,25,26 These negative findings are difficult to compare with the current study, however, because of differences in subject sample (age range, sex, exclusion criteria), brain imaging methods (e.g., CT vs. MR imaging) and measurement techniques (e.g., linear vs. volume measures), and approach to statistical analysis, including adjustments of cognitive test data for potential confounding variables. The negative findings from these studies4,5,25,26 may also have been the result of low power due to relatively small sample sizes.
Memory. We found that lateral ventricle volume and third ventricular volume were each associated with poorer recall on visual delayed memory (Table 5). Our results stand in contrast to negative findings from the three previous studies that have examined relationships between ventricular size and visual memory (Table 1).5,24,26 As discussed above, these negative findings are difficult to compare with the findings in the present study because of methodological differences, and they also suffer from low power associated with relatively small sample sizes. More recently, visual explicit memory (variously measured) has also been linked to the size of the visual cortex20 and corpus callosum.21 Conflicting findings have been reported for the hippocampus (Table 1).6,8,13,23
We found no relationship between verbal delayed memory and either age-specific cerebral atrophy (either cerebral hemisphere volume or peripheral CSF volume) or ventricular enlargement, a result that is in agreement with most of the extant literature (Table 1).5,7,10,20,24–26 In contrast, Carmelli et al.4 observed that the difference in brain volume between elderly male identical twins was associated with within-pair differences in memory performance on the California Verbal Learning Test (Table 1). Several other studies have examined relationships between verbal memory and discrete structures such as the medial temporal lobe, with conflicting findings reported for hippocampal size6–8,13,15,20,23 and negative results observed for the amygdala23 and parahippocampus (Table 1).13,20
Language and Visuospatial Function. We found no relationship between our two measures of language function (Fluency, Boston Naming) and either cerebral atrophy (cerebral hemisphere volume or peripheral CSF volume) or ventricular enlargement (Table 5). Others (Table 1) have likewise reported no relationship between CSF volume and various measures of language function,25 including the Boston Naming Test.16 In contrast, Stafford et al.24 found that total CSF volume on CT was related to a discriminant function of naming and abstraction that included the Boston Naming Test. O'Brien et al.15 recently reported that language function was not associated with age-related atrophy of the amygdala-hippocampal complex.
We also found no relationship between our measure of visuospatial construction (Block Design) and either cerebral atrophy (cerebral hemisphere volume or peripheral CSF volume) or ventricular enlargement (Table 5). All published studies of which we are aware have likewise reported no relationship between performance on the Block Design test and age-related changes in peripheral CSF volume25,26 or ventricular size (Table 1).5,25,26 Performance on other visuospatial tasks has likewise shown no relationship to age-related lateral ventricular enlargement.14 No previous study has examined relationships between Block Design performance and age-related changes in cerebral hemisphere volume per se, although the former was found to be unrelated to the size of corpus callosum, pons, or cerebellum (Table 1).21
In summary, our data suggest that global age-related changes in brain size, both cortical (e.g., cerebral atrophy and increased peripheral CSF volume) and subcortical (e.g., ventricular enlargement), are associated with age-related decrements in attention, psychomotor speed, and visual delayed memory. These results are consistent with other data suggesting that the neural substrates for these functions involve multiple systems distributed throughout the brain. Still other functions, such as verbal memory, language, and visuospatial functioning, were not related to age-linked changes in cerebral size in our study. Attempts by others to relate these functions to more discrete brain structures have met with inconsistent results (Table 1). These discrepant findings regarding relations between cognition and brain structure might mean that cognitive aging is truly a function of diffuse global brain changes, or that age-related cognitive decline is multifactorial, such that changes in several brain regions may have similar effects on cognitive test performance. Slowing on Trails B, for example, could be caused by reduced motor speed, impaired working memory, poor visual scanning, or several cognitive deficits. A finer-grained analysis of the relationships between the specific changes associated with aging and the morphology of more discrete brain structures is required to resolve this issue.
ACKNOWLEDGMENTS
This study was supported in part by the Allegheny-Singer Research Institute (Pittsburgh, PA), the Mental Illness Research Association (Detroit, MI), and the National Institutes of Health (MH46643).
 |
 |
 |
 |
 |
1 Coffey CE: Anatomic imaging of the aging human brain, in Textbook of Geriatric Neuropsychiatry, 2nd edition, edited by Coffey CE, Cummings JL. Washington, DC, American Psychiatric Press, 2000, pp 181-238Google Scholar
2 Podell K, Lovell MR: Neuropsychological assessment, in Textbook of Geriatric Neuropsychiatry, 2nd edition, edited by Coffey CE, Cummings JL. Washington, DC, American Psychiatric Press, 2000, pp 143-164Google Scholar
3 Ratcliff G, Saxton J: Age-associated memory impairment, in Textbook of Geriatric Neuropsychiatry, 2nd edition, edited by Coffey CE, Cummings JL. Washington, DC, American Psychiatric Press, 2000, pp 165-179Google Scholar
4 Carmelli D, Swan GE, Reed T, et al: Midlife cardiovascular risk factors and brain morphology in identical older male twins. Neurology 1999; 52:1119-1124Crossref, Medline, Google Scholar
5 Earnest MP, Heaton RK, Wilkinson WE, et al: Cortical atrophy, ventricular enlargement and intellectual impairment in the aged. Neurology 1979; 29:1138-1143Crossref, Medline, Google Scholar
6 Golomb J, de Leon MI, Kluger A, et al: Hippocampal atrophy in normal aging: an association with recent memory impairment. Arch Neurol 1993; 50:967-973Crossref, Medline, Google Scholar
7 Golomb J, Kluger A, de Leon MJ, et al: Hippocampal formation size in normal human aging: a correlate of delayed secondary memory performance. Learn Mem 1994; 1:45-54Medline, Google Scholar
8 Golomb J, Kluger A, de Leon MJ, et al: Hippocampal formation size predicts declining memory performance in normal aging. Neurology 1996; 47:810-813Crossref, Medline, Google Scholar
9 Hokama H, Shenton ME, Nestor PG, et al: Caudate, putamen, and globus pallidus volume in schizophrenia: a quantitative MRI study. Psychiatry Research: Neuroimaging 1995; 61:209- 229Crossref, Medline, Google Scholar
10 Jacoby RJ, Levy R, Dawson JM: Computed tomography in the elderly, I: the normal population. Br J Psychiatry 1980; 136:249-255Crossref, Medline, Google Scholar
11 Kaye JA, DeCarli C, Luxenberg JS, et al: The significance of age-related enlargement of the cerebral ventricles in healthy men and women measured by quantitative computed x-ray tomography. J Am Geriatr Soc 1992; 40:225-231Crossref, Medline, Google Scholar
12 Kaye JA, Swihart T, Howieson D, et al: Volume loss of the hippocampus and temporal lobes in healthy elderly persons destined to develop dementia. Neurology 1997; 48:1297-1304Crossref, Medline, Google Scholar
13 Kohler S, Black SE, Sinden M, et al: Memory impairments associated with hippocampal versus parahippocampal-gyrus atrophy: an MR volumetry study in Alzheimer's disease. Neuropsychologia 1998; 36:901-914Crossref, Medline, Google Scholar
14 Matsubayashi K, Shimada K, Kawamoto A, et al: Incidental brain lesions on magnetic resonance imaging and neurobehavioral functions in the apparently healthy elderly. Stroke 1992; 23:175-180Crossref, Medline, Google Scholar
15 O'Brien JT, Desmond P, Ames D, et al: Magnetic resonance imaging correlates of memory impairment in the healthy elderly: association with medial temporal lobe atrophy but not white matter lesions. Int J Geriatr Psychiatry 1997; 12:369-374Crossref, Medline, Google Scholar
16 Pearlson GD, Rabins PV, Kim WS, et al: Structural brain CT changes and cognitive deficits in elderly depressives with and without reversible dementia (pseudodementia). Psychol Med 1989; 19:573-584Crossref, Medline, Google Scholar
17 Raz N, Torres IJ, Spencer WD, et al: Pathoclysis in aging human cerebral cortex: evidence from in vivo MRI morphometry. Psychobiology 1993; 21:151-160Google Scholar
18 Raz N, Torres IJ, Spencer WD, et al: Neuroanatomical correlates of age-sensitive and age-invariant cognitive abilities: an in vivo MRI investigation. Intelligence 1993; 17:407-422Crossref, Google Scholar
19 Raz N, Torres IJ, Acker JD: Age, gender, and hemispheric differences in human striatum: a quantitative review and new data from in vivo MRI morphometry. Neurobiol Learn Mem 1993; 63:133-142Crossref, Google Scholar
20 Raz N, Gunning-Dixon FM, Head D, et al: Neuroanatomical correlates of cognitive aging: evidence from structural magnetic resonance imaging. Neuropsychology 1998; 12:95-114Crossref, Medline, Google Scholar
21 Salat D, Ward A, Kaye JA, et al: Sex differences in the corpus callosum with aging. Neurobiol Aging 1997; 18:191-197Crossref, Medline, Google Scholar
22 Soininen H, Puranen M, Riekkinen PJ: Computed tomography findings in senile dementia and normal aging. J Neurol Neurosurg Psychiatry 1982; 45:50-54Crossref, Medline, Google Scholar
23 Soininen HS, Partanen K, Pitkanen A, et al: Volumetric MRI analysis of the amygdala and the hippocampus in subjects with age-associated memory impairment. Neurology 1994; 44:1660- 1668Crossref, Medline, Google Scholar
24 Stafford JL, Albert MS, Naeser MA, et al: Age-related differences in computed tomographic scan measurements. Arch Neurol 1988; 45:409-415Crossref, Medline, Google Scholar
25 Sullivan EV, Shear PK, Mathalon D, et al: Greater abnormalities of brain cerebrospinal fluid volumes in younger than in older patients with Alzheimer's disease. Arch Neurol 1993; 50:359-373Crossref, Medline, Google Scholar
26 Wahlund LO, Agartz I, Almqvist O, et al: The brain in healthy aged individuals: MR imaging. Radiology 1990; 174:675-679Crossref, Medline, Google Scholar
27 Fried LP, Borhani NO, Enright P, et al: The Cardiovascular Health Study: design and rationale. AEP 1991; 3:263-276Google Scholar
28 Longstreth WT, Manolio TA, Arnold A, et al: Clinical correlates of white matter findings on cranial magnetic resonance imaging of 3301 elderly people. Stroke 1996; 27:1274-1282Crossref, Medline, Google Scholar
29 Tell GS, Fried LP, Hermanson B, et al: Recruitment of adults 65 years and older as participants in the Cardiovascular Health Study. Ann Epidemiol 1993; 3:311-317Crossref, Google Scholar
30 Saxton J, Ratcliff G, Newman A, et al: Cognitive test performance and subclinical cardiovascular disease in the Cardiovascular Health Study. Neuroepidemiology 2000; 19:312-319Crossref, Medline, Google Scholar
31 Newcombe FG, Ratcliff GG, Carrivick PJ, et al: Hand preference and IQ in a group of Oxfordshire villages. Ann Hum Biol 1975; 2:235-242Crossref, Medline, Google Scholar
32 Yue NC, Longstreth WT, Elster AD, et al: Clinically serious abnormalities found incidentally at MR imaging of the brain: data from the Cardiovascular Health Study. Radiology 1997; 202:41-46Crossref, Medline, Google Scholar
33 Bryan RN, Wells SW, Miller TJ, et al: Infarctlike lesions in the brain: prevalence and anatomic characteristics at MR imaging of the elderly: data from the Cardiovascular Health Study. Radiology 1997; 202:47-54Crossref, Medline, Google Scholar
34 Chang Yue N, Longstreth WT Jr, Elster AD, et al: Clinically serious abnormalities found incidentally at MR imaging of the brain: data from the Cardiovascular Health Study. Radiology 1997; 202:41-46Crossref, Medline, Google Scholar
35 Tatyemichi TK, Sacktor N, Mayeux R: Dementia associated with cerebrovascular disease, other degenerative diseases, and metabolic disorders, in Alzheimer's Disease, edited by Terry RD, Katzman R, Bick KL. New York, Raven, 1994, pp 123-166Google Scholar
36 Coffey CE, Saxton JA, Ratcliff G, et al: Relation of education to brain size in normal aging: implication of the reserve hypothesis. Neurology 1999; 53:189-196Crossref, Medline, Google Scholar
37 Reitan RM: Validity of the Trailmaking Tests as an indication of organic brain damage. Percept Mot Skills 1958; 8:271-76Crossref, Google Scholar
38 Benton AL: Differential behavioral effects in frontal lobe disease. Neuropsychologia 1968; 6:53-60Crossref, Google Scholar
39 Kaplan E, Goodglass H, Weintraub S: Boston Naming Test. Philadelphia, Lea and Febiger, 1983Google Scholar
40 Wechsler D: Wechsler Memory Scale-Revised Manual. San Antonio, TX, Psychological Corporation, 1987Google Scholar
41 Wechsler D: Wechsler Adult Intelligence Scale-Revised Manual. New York, Psychological Corporation, 1981Google Scholar
42 Manolio TA, Kronmal RA, Burke GL, et al: Magnetic resonance abnormalities and cardiovascular disease in older adults: the Cardiovascular Health Study. Stroke 1994; 25:318-327Crossref, Medline, Google Scholar
43 Jack CR, Gehring DC, Sharbrough FW, et al: Temporal lobe measurement from MR images: accuracy and left-right asymmetry in normal persons. J Comput Assist Tomogr 1988; 12:21- 29Crossref, Medline, Google Scholar
44 DeArmand SJ, Fusce MM, Dewey MM: Structure of the Human Brain, 2nd edition. New York, Oxford University Press, 1976Google Scholar
45 Daniels DL, Haughton VM, Naidich TP: Cranial and Spinal MRI: An Atlas and Guide. New York, Raven, 1987Google Scholar
46 Coffey CE, Lucke J, Ratcliff G, et al: Sex differences in brain aging: a controlled magnetic resonance imaging investigation. Arch Neurol 1998; 55:169-179Crossref, Medline, Google Scholar
47 Coffey CE, Wilkinson WE, Parashos IA, et al: Quantitative cerebral anatomy of the aging human brain: a cross-sectional study using magnetic resonance imaging. Neurology 1992; 42:527-536Crossref, Medline, Google Scholar
48 Arbuckle JL, Wothke W: Amos 4.0 User's Guide. Chicago, SmallWaters Corp, 1999Google Scholar
49 Rubin DB: Inference and missing data. Biometrika 1976; 63:581- 592Crossref, Google Scholar
50 Little RJA, Rubin DB: Statistical Analysis With Missing Data. New York; Wiley, 1987Google Scholar
51 Arbuckle JA: Full information estimation in the presence of incomplete data, in Advanced Structural Equation Modeling: Issues and Techniques, edited by Marcoulides GA, Schumacker RE. Mawah, NJ, Lawrence Erlbaum, 1996Google Scholar
52 Rowe JW, Kahn RL: Human aging: usual and successful. Science 1987; 237:143-149Crossref, Medline, Google Scholar
53 Salerno JA, Murphy DGM, Horwitz B, et al: Brain atrophy in hypertension: a volumetric magnetic resonance imaging study. Hypertension 1992; 20:340-348Crossref, Medline, Google Scholar
54 Schmidt R, Fazekas F, Koch M, et al: Magnetic resonance imaging cerebral abnormalities and neuropsychologic test performance in elderly hypertensive subjects. Arch Neurol 1995; 52:905-910Crossref, Medline, Google Scholar
55 Gado M, Hughes CP, Danziger W, et al: Aging, dementia, and brain atrophy: a longitudinal computed tomography study. AJNR 1983; 4:699-702Medline, Google Scholar