Morphometry of the Superior Temporal Plane In Schizophrenia: Relationship to Clinical Correlates
Abstract
A magnetic-resonance-imaging-based method of cortical parcellation was used to evaluate the morphology of the superior temporal plane and its subregions (Heschl's gyrus [HG], planum temporale [PT], and planum polare [PP]) in a group of 30 patients with schizophrenia versus a matched group of healthy subjects. Right HG volume was significantly reduced in patients compared with control subjects. Each subregion showed a unique set of structure/function relationships: reduced volumes of the HG were associated with greater duration of illness; reduced volumes of the PT were associated with positive symptoms; and in most contrast, elevated volumes of the PP were associated with cumulative neuroleptic exposure.
The temporal lobe and its subregions have long been a focus of study in schizophrenia research. The superior temporal plane (STP), or the dorsal surface of the superior temporal gyrus (STG), is located within the sylvian fissure and is divided into Heschl's gyrus (HG), the planum temporale (PT), and the planum polare (PP). Heschl's gyrus is considered to be primary auditory cortex and lies somewhat diagonally across the STP. The PP and the PT are designated as auditory association cortices and these regions surround HG, with the PP located directly anterior and the PT located directly posterior to HG. The fact that these structures govern the processing of auditory information and aspects of language function makes them prime regions of interest in schizophrenia because these functions are so often disturbed.
There have, in fact, been multiple studies on the morphology of these regions. However, this body of literature constitutes the most inconsistent findings of brain morphology in schizophrenia research. While the normal morphology of this region (typically confined to the measurement of the PT) has a left>right asymmetry, studies of schizophrenia have found patterns of normal asymmetry, lack of asymmetry, or even reversed asymmetry. The most common finding in this literature is a negative finding—both patients and control subjects having the normal leftward asymmetry,1–6which includes two studies from our group.7,8 In 1999, Shapleske et al. conducted a metaanalysis of seven studies of PT morphology in schizophrenia and found reduced asymmetry in the patient group compared to control subjects.9 However, more recently this same group published one of the largest magnetic resonance imaging (MRI) studies on PT morphology and reported negative results: no differences between patients and control subjects in PT asymmetry.10 Most recently, McCarley et al. found reversed asymmetry, with first-episode subjects having significantly smaller left PT compared to control subjects.11
Studies of HG have been less numerous but are also conflicting. Some studies have reported reduced HG volume,11–13 but most report no difference in volume, cortical surface size and the asymmetry coefficient of the HG between patients and control subjects.11
The PP is an area of the STP that has rarely been studied as an independent region of interest. Like the PT, the PP is considered an auditory association area, though it has been found to have a role in processing auditory information that is functionally distinct from the PT.14,15 The only study to date in schizophrenia that has looked at the PP as a separate region was conducted by Goldstein et al. in 1999. They found the PP to have nonsignificantly smaller volumes in subjects with schizophrenia compared to control subjects.16 Whether this region has a unique functional contribution has yet to be determined. However, as a recent electrophysiologic study of the STG indicates, functionally distinct cortical regions involved in auditory and language processing can be comprised of very small areas.17
Despite the wealth of information on the morphology of STP structures, there is a paucity of studies evaluating the clinical correlates of these regions. Early studies showed that global measures of the STG were correlated to thought disorder18 and to auditory hallucinations.19 Later studies looked specifically at the STP regions and have reported significant correlations between severity of thought disorder and reduction of left PT surface area20 and volume.21 One report has also shown relationship between left PT volume reduction and suspiciousness.22 However other reports have found no clinical correlates to PT morphology.2,10,13
Our lab has recently evaluated the morphology of several cortical regions including the insula,23 the ventral frontal cortex,24 and the lateral aspect of the STG in subjects with schizophrenia compared to control subjects.25 The pattern throughout all of these studies has been relatively subtle changes in morphology. However in all of these cortical regions, morphology of the cortical region was significantly correlated with symptomatology. Therefore, when subjects were classified based on severity of a specific symptom, there were robust differences within the patient group itself. As an example, we found that reduction in volume of anterior STG was correlated to severity of positive symptoms.25 In an analysis of the patient group compared to the healthy subjects, the morphology of this region was not significantly different. However when comparing subsamples of the patient group divided into those with severe positive symptoms compared to those with mild positive symptoms, there was a robust reduction in the volume of this region in the “severe” group compared to the “mild” group. This type of analysis highlights the potential utility of structural brain imaging data in the evaluation of brain structure/function relationships.
The current study was designed to evaluate the morphology of the STP structures in a group of subjects with schizophrenia compared to control subjects using a recently developed MRI-based method of cortical parcellation. As a unique contribution to this body of literature, the focus was to evaluate the HG, PT, and the PP. Another main objective was to evaluate thoroughly the potential relationships between morphology of these regions and clinical correlates including duration of illness, cumulative neuroleptic exposure, and severity of symptoms.
METHOD
Subjects
All patients were inpatient admissions to the Mental Health Clinical Research Center. The patient group (N=30) was designed to represent a wide variety of phenomenologic profiles in order to provide sufficient variance in multiple measures, including severity of illness, duration of illness, and exposure to neuroleptics. In addition, since symmetry of STP structures such as the PT has been shown to be affected by gender and handedness, the sample was restricted to right-handed males. In addition, since atypical neuroleptics have been shown to have a different effect on the morphology of brain tissue compared to typical neuroleptics, subjects who had been treated with typical neuroleptics only were included. That is, none of them had ever received atypical neuroleptics such as clozapine, risperidone, olanzapine or quetiapine. Of the 30 patients, six were “first episode” (defined as first psychiatric hospitalization), 11 were “recent onset” (within 5 years) and the remaining 13 were “chronic.”
There were no significant differences between groups in age, height, and socioeconomic status of their parents. As expected, there was a significant difference in years of education between groups (control subjects mean=14.30, SD=2.07; patients mean=12.83, SD=2.42) (t=2.52, df= 58, P<0.02).
All patients met DSM-III-R criteria for schizophrenia and were evaluated with the Comprehensive Assessment of Symptoms and History (CASH).26 Clinical symptoms were rated using the Scale for the Assessment of Negative Symptoms (SANS)27 and the Scale for the Assessment of Positive Symptoms (SAPS).28 Summary scores for three dimensions of symptoms (psychotic, negative, and disorganized) were calculated using the sum of global scores from the SANS and SAPS. The psychotic symptom dimension was the sum of global scores for hallucinations and delusions. The negative symptom dimension score was the sum of global scores for alogia, affective flattening, avolition-apathy, and anhedonia-asociality. The disorganized symptom dimension was comprised of the global scores of positive formal thought disorder, disorganized/bizarre behavior, and inappropriate affect. A “global” or overall index of severity was calculated by summing the scores of all three dimensions.
The “dose-year” formula29 was used to measure neuroleptic exposure. This required conversion of neuroleptic medication to chlorpromazine equivalents.30 Exposure was calculated over time, weighted for dose. Though at the time of scanning, all subjects had been exposed to neuroleptics. Exposure ranged from 0.5 to 184.0 “dose-years.”
The control subjects consisted of 30 healthy males, individually matched with the patients for age and handedness. Control subjects were recruited from the community through a newspaper advertisement. They had no current or past history of psychiatric, neurological or general medical illness, including substance abuse, as determined using an abbreviated version of the CASH. All subjects gave written informed consent in accordance with the Human Subjects Institutional Review Board of the University of Iowa. Table 1 summarizes the demographic characteristics of the two groups.
MRI Acquisition
All multimodal MRI scans were obtained at the University of Iowa Hospitals and Clinics using a 1.5-Tesla General Electric SIGNA System (GE Medical Systems, Milwaukee, WI). Three-dimensional T1-weighted images, using a spoiled grass (SPGR) sequence, were acquired in the coronal plane with the following parameters: echo time (TE)=5 msec, repetition time (TR)=24 msec, numbers of excitations (NEX)=2, rotation angle=45°, field of view (FOV)=26×24×18.8 cm, and a matrix of 256×192×124. Two-dimensional proton density (PD) and T2 sequences were acquired as follows: 3.0- or 4.0-mm thick coronal slices, TR=3000 msec, TE=36 msec (for PD) and 96 msec (for T2), NEX=1, FOV=26×26 cm, matrix=256×192.
Image Processing
Magnetic resonance data were processed on Silicon Graphics workstations using our locally developed software, BRAINS.31 The T1-weighted images were spatially normalized and resampled to 1.0 mm3 voxels so that the anterior-posterior axis of the brain was realigned parallel to the anterior commissure-posterior commissure line and the interhemispheric fissure aligned on the other two axes. The T2- and PD-weighted images were aligned to the spatially normalized T1-weighted image.32 The data sets were then segmented using the multispectral data and a discriminant analysis method based on automated training class selection.33 The tissue-classified image was then used to generate a triangle-based iso-surface by using a threshold of 130 to represent pure gray matter, which corresponds to the parametric center of the cortex.34 An initial polygonalization of cortical surface was done using the method described by Wyvill et al.35 The surface was then retiled, since the initial surface contained 300,000–500,000 triangles per hemisphere. A retiling algorithm36 was used to reduce the image to a more manageable size of approximately 100,000 triangles per hemisphere. Decimation yielded a very similar surface with better-shaped triangles. This triangulated surface was used as the basis for our calculations of cortical areas and volumes. An automated algorithm was used to verify that there were not holes or handles on the surface.34
Region of Interest Definition and Reliability
A detailed description of the anatomical boundaries and the method to define supratemporal subregions (i.e., HG, PT, and PP) are presented elsewhere.37,38 (Figure 1)
Heschl's gyrus (HG). The first step was to identify Heschl's sulcus (HS), a prominent deep transverse sulcus originating from retroinsular area and extending to the lateral surface. Tracing began on the most caudal coronal slice containing HS, where it commenced as a notch near the medial end of the supratemporal plane. The lateral border was HS and, in case the sulcus intermedius (SI) appeared on the medial side of HS, the lateral border of HG was changed to the SI. Tracing stopped when HS (or the SI, if it exists) was no longer visible or reached the lateral rim of the supratemporal plane. The deepest point of the Sylvian fissure (SF) on the posterior aspect, the circular sulcus of insula (CSI) after the insula appears and the deepest point of the first transverse sulcus (FTS) when it appears was considered to be the medial border of the HG in the series of coronal slices.
Planum temporale (PT). Tracing was done on coronal slices. However, sagittal and transaxial slices were also examined to obtain an overall view of the course of HS and the pattern of the PT. Tracing began on the coronal plane containing the posterior end of the horizontal limb of the SF, which indicated the posterior boundary of the PT (for a detailed description of how to identify the controversial posterior border of the PT, see Kim et al.38). Until HS appeared, the superior surface of the temporal lobe was traced as the PT, following the deepest point of the SF medially and the lateral rim of the supratemporal plane laterally. After HS appeared, the medial border was replaced from the deepest point of the SF to HS. If the SI appeared on the medial side of HS, the medial border of the PT was changed again to the SI. The lateral rim of the supratemporal plane was constantly the lateral border of the PT. Tracing ended at the coronal slice where HS (or the SI, if it exists) disappeared on the superior surface or reached the lateral rim.
Planum polare (PP). Tracing began at the level of the posterior end of the FTS, where the FTS was separated from the CSI. Tracing was continued following the FTS laterally and the CSI medially. On the level of the anterior tip of HS or the SI, the lateral border of the PP was changed from the FTS to the lateral rim of the supratemporal plane.
The reliability study for STP subregions was performed on a set of ten MR scans by two raters (B.C.F. and J.J.K.). The intraclass r coefficients for right and left gray matter volumes and cortical surface sizes of supratemporal regions ranged from r=0.93 to r=0.98.38 One rater (B.C.F.) used this method to manually trace STP subregions in coronal slices of all subjects.
Statistical Analyses
All measures of gray matter volume and cortical surface size were subjected to analysis of covariance (ANCOVA), with diagnosis as the between-group factor and the total intracranial volume as the covariate.
In addition, an asymmetry coefficient (AC) for PT, HG and PP gray matter volume and surface area was calculated using the following formula: (right − left)/ (right + left). A negative value indicates a larger left-sided structure. A t test was used to compare AC between groups.
To evaluate the relationship between STP morphology and clinical correlates such as severity of symptoms, duration of illness, and cumulative neuroleptic exposure, Spearman correlation coefficients were calculated. Age was matched in the patient group and in the healthy subjects; however, the correlation analyses were conducted within patient group. Age was found to have a significant negative correlation with volume of the supratemporal plane volume (Spearman r=−0.260, P=0.046, N=60). Therefore, partial correlation coefficients were used controlling for both the effects of age and intracranial volume. The nonparametric method was chosen to minimize the effect of potential outliers in morphometric measures. Also, to limit the number of tests run and thereby reducing the chance of a type I error, only the volume measure of each substructure was used for the correlation analyses.
All tests were two-tailed and the significance level adopted was α=0.05, unless otherwise indicated.
RESULTS
Volumetric and Surface Size Measurements
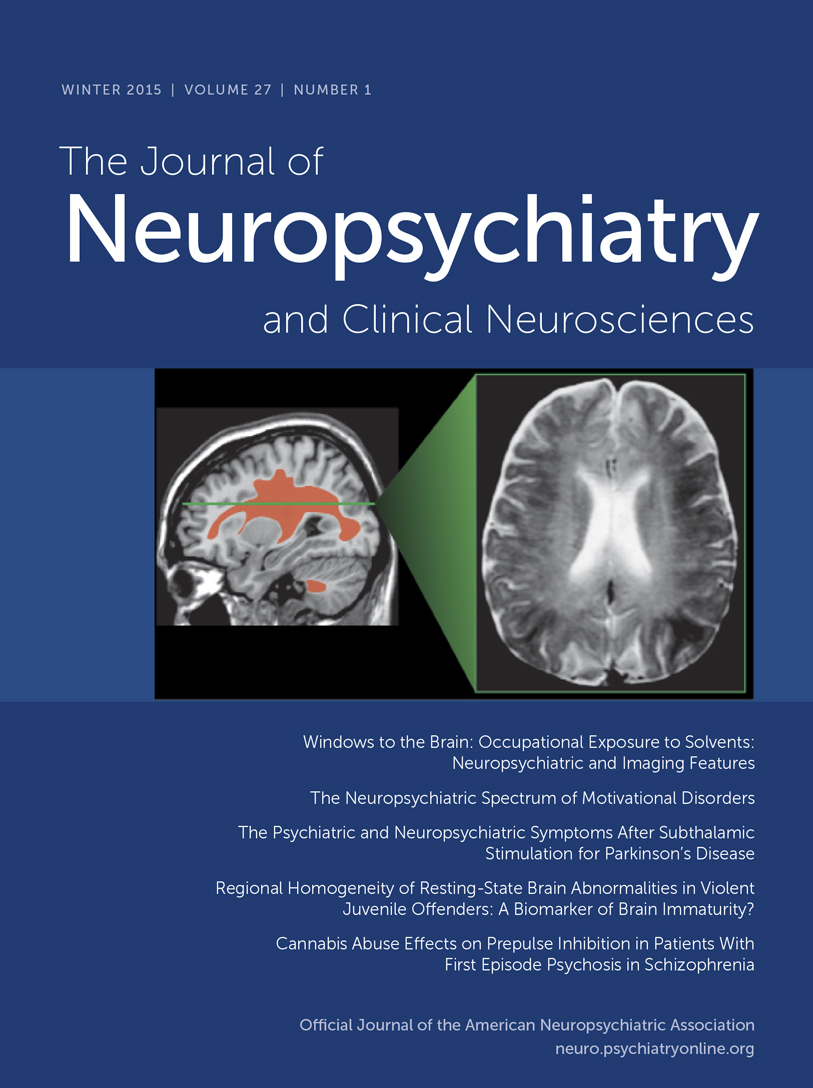
Comparisons of cortical measures between patients and healthy volunteers are shown in Table 2. Patients with schizophrenia had a significant reduction in gray matter volume in the right HG (F=5.79, df=1, 57, P=0.019). Also, surface area of the right HG in patients was less compared to control subjects (F=3.97, df=1, 57, P=0.051). There was no significant difference between groups in the volume or area of the PT nor the PP. No significant differences were found in asymmetry coefficients between groups (Table 3). Overall, both groups showed larger left-side structures (Table 3) (i.e., PT, HG, and PP).
Correlations Between Supratemporal Morphological Abnormalities and Clinical Variables
Table 4 shows the results of the correlation analysis between STP region volume and clinical variables of dose-years, duration of illness, positive, negative, and disorganized symptoms. Heschl's gyrus showed a significant inverse correlation with duration of illness (r =−0.497, P=0.007), indicating that the longer the duration of illness, the smaller the volume of this brain region. The relationship between HG volume and dose-year was also inverse and significant (r=−0.375, P=0.049). Correlations between HG and the three symptom dimensions were all inverse as well, though none reached significance. PT volume showed a significant inverse relationship with positive symptoms (r=−0.413, P=0.028), indicating that the more severe these symptoms, the smaller the volume. The remaining correlations between PT volume and other clinical variables were inverse, but did not reach significance. PP morphology also showed significant correlations to both dose-years (r=0.546, P=0.002) and duration of illness (r=0.439, P=0.019), but in contrast to the HG and PT, the correlation was positive. Larger neuroleptic exposure and longer duration of illness corresponded to larger volumes of the PP. The correlations between PP and positive and negative symptoms were also positive, but did not reach significance.
Cumulative exposure to neuroleptics and duration of illness are clearly related. Those subjects who have the longest duration of illness are most likely to have the highest dose-years measure. Therefore, to examine the effect of these variables independently, we repeated the analysis of HG and PP morphology. For the correlation between HG and PP volume and dose-years, Spearman correlations were calculated, controlling for age, intracranial volume and duration of illness. Results are shown in Table 5. For the correlation between HG and PP volume and duration of illness, Spearman correlations were calculated controlling for age, intracranial volume, and dose-years (Table 6). This analysis clarified the relationships substantially. After controlling for duration of illness, the relationship between the HG and dose-years diminished (r=−0.163, P=0.414), yet the correlation between PP and dose-years remained significant (r=0.417, P=0.030). Conversely, after controlling for dose-years, the relationship between duration of illness and PP dropped substantially (r=0.224, P= 0.261) while the correlation between the HG and duration of illness remained significant (r=−0.384, P= 0.047).
DISCUSSION
By carefully identifying a unique sample of patients and thereby eliminating potential confounders of morphology (sex, handedness, exposure to only typical neuroleptics), the current study was able to detect important relationships between structures of temporal lobe brain regions and several clinical correlates. Moreover, each of the three brain regions examined displayed a distinctive set of relationships between structures and clinical variables: reduced volumes of HG were associated with greater duration of illness; reduced volumes of the PT were associated with positive symptoms; and elevated volumes of the PP were associated with cumulative neuroleptic exposure.
The fact that each of these small regions of cortex displayed unique pattern of relationship to clinical correlates is interesting in several respects. The pattern of structure/clinical variable relationships of the HG and PT is strikingly similar, with none of the correlations being significantly different from each other. However, the volume of the PP appears to have clinical correlates distinct and inverse from the other two regions. Given their shared location and similar function, the fact that the HG and PT have similar clinical correlates is not surprising. However, the PP is a small piece of cortex adjacent to these regions and is considered to be functionally similar to the PT (both being auditory association cortices). The finding indicating that this region has different clinical correlates compared to the other two regions is surprising.
Any suggestion that such small regions of cortex are functionally distinct regions is probably an oversimplification. That is, although the brain may be organized into functionally distinct regions, these regions do not act in isolation, but rather in complex systems of neural circuitry that are constantly in a dynamic flux of feed-forward and feedback loops. Given that as a foundation, it is of interes to note that by investigating the morphology of smaller and smaller regions of cortex, the use of structural imaging as a tool to examine correlates of brain function becomes more powerful, though still at best a “proxy” measure that ultimately must be integrated with functional imaging data.
These findings can also provide a possible explanation for why many previous morphologic studies were either negative1–8,10 or conflicting11 in their patient versus control analysis. Like our study, there were only minor differences between the patients and control subjects. However, the clinical and cognitive correlates showed significant relationships within the patient group. For descriptive purposes, these correlations allow for construction of subgroups within the patient sample based on symptom profile. Using this extreme group comparison strategy, significant morphologic differences emerge using only small, yet very homogenous groups of patients. For example the morphology of the PP was significantly correlated with cumulative exposure to neuroleptics (dose-years). In a post hoc extreme group analysis, subjects having the lowest dose-years (less than or equal to 1.6, N=8 or the lowest quartile), and subjects having the highest dose-years (greater than or equal to 45, N=8, or the highest quartile), were compared to the healthy subjects using an ANCOVA with intracranial volume and age (since the patient groups are not age matched) as covariates. Even with these very small samples, there was a significant main effect of group (F=3.22, P=0.05). Post hoc t tests showed no significant differences in volume of the PP between the control subjects (adjusted means cc=2.74) and the patients with “low” dose-years (adjusted mean cc=2.39). However, the 8 patients with the highest dose-years had significantly larger PP volumes (adjusted means cc=3.15) than the patients with the lowest dose-years (t=2.53, P=0.01) and were nonsignificantly larger than the control subjects (t=1.73, P=0.09).
Duration of Illness and Medication Exposure
The findings of decrement in the cortical volume of HG over time independent of drug exposure was unexpected. Although duration of illness has typically not been studied in such small regions of interest, there have been longitudinal studies that indicate that the temporal lobes in particular may decrease in volume over time.39–41 Other longitudinal studies however do not show significant morphologic change in temporal lobe morphology over time.42–44 The caveat here once again is that many of the longitudinal studies evaluated either very large/gross regions of cortex (e.g., temporal lobes), or the regions studied were not of the STP. Evaluation of large brain regions may mask the functional relationships of much smaller subregions. Prospective studies of STP morphology will need to be conducted in the future to replicate the current findings of possible change over time.
In the current study, the volume of the PP was found to increase with increasing exposure to typical neuroleptics. Although other studies have indicated that morphologic change in specific brain regions is due to exposure to neuroleptic exposure, all of these studies have been on the basal ganglia, not cortical regions.45–48 Our findings are consistent with these basal ganglia studies, indicating that neuroleptics may affect both cortical and subcortical regions. The mechanisms by which neuroleptic medication may affect the volume of the cerebral cortex are uncertain. Medication-induced changes in cerebral blood flow49,50 or up-regulation in the striatal dopamine (D2) receptors51,52 has been postulated as the mechanism behind drug-induced increase in basal ganglia volume. PET studies mapping extrastriatal D2-like receptors in the cerebral cortices showed that the highest cortical D2-like receptor binding was found in the temporal cortex and hippocampus.53 Interestingly, an inverse relationship has been reported between reduced STG volume and the elevated striatal D2-density in schizophrenia.54 Further investigation is warranted to explore the effect of antipsychotic medication, typical and atypical, in the cortex in general, and in circumscribed cortical regions in particular.
A Further Look at Symptom Correlates
Although the only significant finding in regard to symptom correlations was between volume of the PT and psychotic symptoms, this relationship does not appear to be exclusive to the PT. Although none of them reached significance, all symptom domain measures were inversely correlated with the HG. In addition, the correlations between PT and negative and disorganized symptoms were also inverse, but not significant.
All correlations were made using “global” scores (a sum of individual symptom items) of each of the three symptom “domains”—positive, negative, and disorganized. For instance, the psychotic symptom score was composed of ratings of both hallucinations and delusions. It could be hypothesized that the relationship between the PT and psychotic symptoms may be more specific to auditory hallucinations rather than delusions, given the fact that the PT is a secondary auditory cortex. Follow-up Spearman correlations show that the PT has inverse correlations with both hallucinations (r=−0.43, P=0.02) and delusions (r=-0.40, P=0.03), indicating that its role in this disease pathology is not only in auditory perceptual aberration, but more complex abnormalities of inferential thought processes.
Similarly, previous studies have found significant correlations between PT morphology and positive formal thought disorder,18,20,21 one of the three items used to make the disorganized dimension score. However, a follow-up Spearman correlation from this study found no significant relationship between PT morphology and positive formal thought disorder (r=–0.05, P=0.77).
Although there were no significant correlations between the PP and any global symptom dimension score, all were in the positive direction. There was a trend for a relationship between PP volume and negative symptoms. Of the four symptom items that make up the negative symptom score, only one (alogia) could be considered to be related to language function and could therefore be hypothesized to be related to supratemporal subregions. Follow-up Spearman correlations show that although the PP had positive correlations to all four symptom items, the most robust correlation and the only statistically significant one was, indeed, with alogia: flat affect r=0.16, P=0.39; alogia r=0.37, P=0.04; avolition-apathy r=0.15, P=0.44; anhedonia-asociality r=0.01, P=0.94.
Limitations of this study include a large number of analyses within a modestly sized sample. Although the sample was designed to diminish potential confounding factors, it also created a unique sample in which findings may not be generalized. Moreover, the pattern of clinical correlates varied significantly between small regions of cortex, and some were unexpected or counterintuitive. Validation of these findings will undoubtedly need replication in an independent sample.
In summary, evaluation of the morphology of the STP in subjects with schizophrenia versus control subjects shows a reduction in volume of HG on the right in the patient group. There was no difference between groups in asymmetry coefficient. When the three subregions of the STP were evaluated in relationship to clinical variables, each region showed a unique set of structure/ function relationships: reduced volumes of the HG were associated with greater duration of illness; reduced volumes of the PT were associated with positive symptoms; and in most contrast, elevated volumes of the PP were associated with cumulative neuroleptic exposure.
ACKNOWLEDGMENTS
This study was performed at the University of Iowa, Iowa City, Iowa, with grant support from the MH-31593, MH-40856, MH-19113, and MH-CRC43271.
 |
 |
 |
 |
 |
 |

FIGURE 1. Supratemporal Subregions
(A) Superior view of the 3D rendered brain on which the supratemporal subregions (PT: Planum Temporale; Heschl’s Gyrus; PP: Planum Polare and the Temporal pole) have been displayed in distinctive colors and the position of the reference planes have been marked. Four coronal slices (B-E) showing four examples of real tracings (Kim et al, 2000 and Crespo-Facorro et al, 2000b for a detailed description of the parcellation method). The position of these four slices is marked in the 3D image (arrows). The continuous black line represents the intersection between the triangulated surface and each two-dimensional coronal plane.
1 Kulynych JJ, Vladar K, Jones DW, et al: Three-dimensional surface rendering in MRI morphometry: a study of the planum temporale. J Comput Assist Tomogr 1993; 17:529–535Crossref, Medline, Google Scholar
2 DeLisi L, Hoff A, Neale C, et al: Asymmetries in the superior temporal lobe in male and female first-episode schizophrenic patients: measures of the planum temporale and superior temporal gyrus by MRI. Schizophr Res 1994; 12:19–28Crossref, Medline, Google Scholar
3 Kleinschmidt A, Falkai P, Huang Y, et al: In vivo morphometry of planum temporale asymmetry in first-episode schizophrenia. Schizophr Res 1994; 12:9–18Crossref, Medline, Google Scholar
4 Rossi A, Serio A, Stratta P, et al: Planum temporale asymmetry and thought disorder in schizophrenia. Schizophr Res 1994; 12:1–7Crossref, Medline, Google Scholar
5 Kulynych JJ, Vladar K, Fantie BD, et al: Normal asymmetry of the planum temporale in patients with schizophrenia: three dimensional cortical morphometry with MRI. Br J Psychiatry 1995; 166:742–749Crossref, Medline, Google Scholar
6 Frangou S, Sharma T, Sigmudsson T, et al: The Maudsley Family Study, 4: normal planum temporale asymmetry in familial schizophrenia: a volumetric MRI study. Br J Psychiatry 1997; 170:328–333Crossref, Medline, Google Scholar
7 Mosnik DM, O'Leary DS, Tranel AP, et al: Left hemisphere language dominance in schizophrenic patients and normal controls: a study of functional and anatomical asymmetries. Schizophr Res 1995; 2:30–31Crossref, Google Scholar
8 O'Leary DS, Kesler M, Mosnik DM, et al: Regional cerebral blood flow within Heschl's gyrus and the planum temporale in schizophrenic patients and controls during language tasks: an MRI and PET study. Schizophr Res 1995; 2:94Crossref, Google Scholar
9 Shapleske J, Rossell SL, Woodruff PW, et al: The planum temporale: a systematic, quantitative review of its structural, functional and clinical significance. Brain Res Brain Res Rev 1999; 29:26–49Crossref, Medline, Google Scholar
10 Shapleske J, Rossell SL, Simmons A, et al: Are auditory hallucinations the consequence of abnormal cerebral lateralization? a morphometric MRI study of the sylvian fissure and planum temporale. Biol Psychiatry 2001; 49:685–693; correction, 50:394Crossref, Medline, Google Scholar
11 McCarley R, Salisbury DF, Hirayasu Y, et al: Association between smaller left posterior superior temporal gyrus volume on magnetic resonance imaging and smaller left temporal P300 amplitude in first-episode schizophrenia. Arch Gen Psychiatry 2002; 59:321–331Crossref, Medline, Google Scholar
12 Rojas DC, Teale P, Sheeder J, et al: Sex-specific expression of Heschl's gyrus functional and structural abnormalities in paranoid schizophrenia. Am J Psychiatry 1997; 154:1655–1662Medline, Google Scholar
13 Hirayasu Y, McCarley RW, Salisbury DF, et al: Planum temporale and Heschl gyrus volume reduction in schizophrenia: a magnetic resonance imaging study of first-episode patients. Arch Gen Psychiatry 2000; 57:692–699Crossref, Medline, Google Scholar
14 Rauschecker JP: Cortical processing of complex sounds. Curr Opin Neurobiol 1998; 8:516–521Crossref, Medline, Google Scholar
15 Kaas JH, Hackett TA: “What” and “where” processing in auditory cortex. Nat Neurosci 1999; 2:1045–1047Crossref, Medline, Google Scholar
16 Goldstein JM, Goodman JM, Seidman LJ, et al: Cortical abnormalities in schizophrenia identified by structural magnetic resonance imaging. Arch Gen Psychiatry 1999; 56:537–547Crossref, Medline, Google Scholar
17 Howard MA, Volkov IO, Mirsky R, et al: Auditory cortex on the human posterior superior temporal gyrus. J Comp Neurol 2000; 416:79–92Crossref, Medline, Google Scholar
18 Shenton M, Kikinis R, Jolesz F, et al: Abnormalities of the left temporal lobe and thought disorder in schizophrenia: a quantitative magnetic resonance imaging study. N Engl J Med 1992; 327:604–612Crossref, Medline, Google Scholar
19 Barta P, Pearlson G, Powers R, et al: Auditory hallucinations and smaller superior temporal gyrus volume in schizophrenia. Am J Psychiatry 1990; 147:1457–1462Crossref, Medline, Google Scholar
20 Petty RG, Barta PE, Pearlson GD, et al: Reversal of asymmetry of the planum temporale in schizophrenia. Am J Psychiatry 1995; 152:715–721Crossref, Medline, Google Scholar
21 Barta PE, Pearlson GD, Brill LB II, et al: Planum temporale asymmetry reversal in schizophrenia: replication and relationship to gray matter abnormalities. Am J Psychiatry 1997; 154:661–667Crossref, Medline, Google Scholar
22 Kwon J, McCarley R, Anderson J, et al: Left planum temporale volume reduction in schizophrenia. Arch Gen Psychiatry 1999; 56:142–148Crossref, Medline, Google Scholar
23 Crespo-Facorro B, Kim J, Andreasen NC, et al: Insular cortex abnormalities in schizophrenia: a structural magnetic resonance imaging study of first-episode patients. Schizophr Res 2000; 46:35–43; correction, 2001; 51:183–184Google Scholar
24 Chemerinski E, Nopolous PC, Crespo-Facorro B, et al: Morphology of the ventral frontal cortex in schizophrenia: relationship with social dysfunction. Biol Psychiatry 2002; 52:1–8Crossref, Medline, Google Scholar
25 Kim JJ, Crespo-Facorro B, Andreasen NC, et al: Morphology of the lateral superior temporal gyrus in neuroleptic naive patients with schizophrenia: relationship to symptoms. Schizophr Res 2003; 60:173–181Medline, Google Scholar
26 Andreasen NC, Flaum M, Arndt S: The Comprehensive Assessment of Symptoms and History (CASH): an instrument for assessing psychopathology and diagnosis. Arch Gen Psychiatry 1992; 49:615–623Crossref, Medline, Google Scholar
27 Andreasen NC: The Scale for the Assessment of Negative Symptoms (SANS). Iowa City, University of Iowa, 1983Google Scholar
28 Andreasen NC: The Scale for the Assessment of Positive Symptoms (SAPS). Iowa City, University of Iowa, 1984Google Scholar
29 Miller DD, Flaum M, Nopoulos P, et al: The concept of dose years: a reliable method for calculating lifetime psychotropic drug exposure. Schizophr Res 1995; 15:159 Crossref, Google Scholar
30 Davis JM: Dose equivalence of the antipsychotic drugs. J Psychiatr Res 1974; 11:65–69Crossref, Medline, Google Scholar
31 Andreasen NC, Cohen G, Harris G, et al: Image processing for the study of brain structure and function: problems and programs. J Neuropsychiatry Clin Neurosci 1992; 4:125–133Link, Google Scholar
32 Woods RP, Cherry SR, Mazziotta JC: Rapid automated algorithm for aligning and reslicing PET images. J Comput Assist Tomogr 1992; 16:620–633Crossref, Medline, Google Scholar
33 Harris G, Andreasen NC, Cizadlo T, et al: Improving tissue classification in MRI: a three-dimensional multispectral discriminant analysis method with automated training class selection. J Comput Assist Tomogr 1999; 23:144–154Crossref, Medline, Google Scholar
34 Magnotta V, Heckel D, Andreasen NC, et al: Measurement of brain structures by artificial neural networks: two- and three-dimensional applications. Radiology 1999; 211:781–790Crossref, Medline, Google Scholar
35 Wyvill G, McPheeters C, Wyvill B: Data structures for soft objects. Visual Computer 1986; 2:227–234Crossref, Google Scholar
36 Turk G: Re-tiling polygonal surfaces. Computer Graphics 1992; 26:55–64Crossref, Google Scholar
37 Crespo-Facorro B, Kim J, Andreasen NC, et al: Cerebral cortex: a topographic segmentation method using magnetic resonance imaging. Neuroimage 2000; 100:97–126Crossref, Google Scholar
38 Kim JJ, Crespo-Facorro B, Andreasen NC, et al: An MRI-based parcellation method for the temporal lobe. Neuroimage 2000; 11:271–288Crossref, Medline, Google Scholar
39 Jacobsen LK, Giedd JN, Castellanos FX, et al: Progressive reduction of temporal lobe structures in childhood-onset schizophrenia. Am J Psychiatry 1998; 155:678–685Crossref, Medline, Google Scholar
40 Rapoport JL, Giedd JN, Blumenthal J, et al: Progressive cortical change during adolescence in childhood-onset schizophrenia: a longitudinal magnetic resonance imaging study. Arch Gen Psychiatry 1999; 56:649–654Crossref, Medline, Google Scholar
41 Mathalon DH, Sullivan EV, Lim KO, et al: Progressive brain volume changes and the clinical course of schizophrenia in men: a longitudinal magnetic resonance imaging study. Arch Gen Psychiatry 2001; 58:148–157Crossref, Medline, Google Scholar
42 Lieberman J, Chakos M, Wu H, et al: Longitudinal study of brain morphology in first episode schizophrenia. Biol Psychiatry 2001; 49:487–499Crossref, Medline, Google Scholar
43 Gur RE, Cowell P, Turetsky BI, et al: A follow-up magnetic resonance imaging study of schizophrenia: relationship of neuroanatomical changes to clinical and neurobehavioral measures. Arch Gen Psychiatry 1998; 55:145–152Crossref, Medline, Google Scholar
44 Wood SJ, Velakoulis D, Smith DJ, et al: A longitudinal study of hippocampal volume in first episode psychosis and chronic schizophrenia. Schizophr Res 2001; 52:37–46Crossref, Medline, Google Scholar
45 Chakos MH, Lieberman JA, Alvir J, et al: Caudate nuclei volumes in schizophrenic patients treated with typical antipsychotics or clozapine. Lancet 1995; 345:456–457Crossref, Medline, Google Scholar
46 Chakos MH, Lieberman JA, Bilder RM, et al: Increase in caudate nuclei volumes of first-episode schizophrenic patients taking antipsychotic drugs. Am J Psychiatry 1994; 151:1430–1436Crossref, Medline, Google Scholar
47 Corson PW, Nopoulos P, Miller D, et al: Change in basal ganglia volume over 2 years in patients with schizophrenia: typical versus atypical neuroleptics. Am J Psychiatry 1999; 156:1200–1204Medline, Google Scholar
48 Keshavan MS, Bagwell WW, Haas GL, et al: Changes in caudate volume with neuroleptic treatment (letter). Lancet 1994; 344:1434Crossref, Medline, Google Scholar
49 Miller DD, Andreasen NC, O'Leary DS, et al: Effect of antipsychotics on regional cerebral blood flow measured with positron emission tomography. Neuropsychopharmacology 1997; 17:230–240Crossref, Medline, Google Scholar
50 Miller DD, Rezai K, Alliger R, et al: The effect of antipsychotic medication on relative cerebral blood perfusion in schizophrenia: assessment with TC-99m HMPAO SPECT. Biol Psychiatry 1997; 41:550–559Crossref, Medline, Google Scholar
51 Mackay AV, Iversen LL, Rossor M, et al: Increased brain dopamine and dopamine receptors in schizophrenia. Arch Gen Psychiatry 1982; 39:991–997Crossref, Medline, Google Scholar
52 Seeman P, Bzowej NH, Guan HC, et al: Human brain D1 and D2–dopamine receptors in schizophrenia, Alzheimer's, Parkinson's, and Huntington's diseases. Neuropsychopharmacology 1987; 1:5–15Crossref, Medline, Google Scholar
53 Okubo Y, Olsson H, Ito H, et al: PET mapping of extrastriatal D2–-like dopamine receptors in the human brain using an anatomic standardization technique and [11C]FLB 457. Neuroimage 1999; 10:666–674Crossref, Medline, Google Scholar
54 Tune L, Barta P, Wong D, et al: Striatal dopamine D2 receptor quantification and superior temporal gyrus: volume determination in 14 chronic schizophrenic subjects. Psychiatry Res 1996; 67:155–158Crossref, Medline, Google Scholar