Volumetric Investigation of the Frontal-Subcortical Circuitry in Patients With Obsessive-Compulsive Disorder
Abstract
The pathophysiology of obsessive-compulsive disorder (OCD) is thought to involve disturbance of the frontal-subcortical circuitry. To investigate the morphological characteristics of this circuitry, we examined the volume of the orbitofrontal cortex, anterior cingulate, thalamus, caudate, and the putamen in 36 age- and sex-matched OCD patients and normal control subjects using three-dimensional magnetic resonance (MR) brain imaging. The left orbitofrontal volumes were found to be significantly smaller in the OCD patients and showed significant negative correlations with obsessive-compulsive symptom severity. These findings suggest that a structural abnormality of this brain region is implicated in the pathophysiology of OCD.
Although the pathophysiology of obsessive-compulsive disorder (OCD) remains controversial, there is substantial evidence suggesting that disturbances in the frontal-subcortical circuitry may be implicated.1,2 Evidence of this hypothesis stems mainly from the elevated rates of OCD in individuals with basal ganglia disorders3,4 and from functional neuroimaging studies that indicate hyperfunction in the frontal-subcortical circuitry in patients with OCD.5–7 However, despite evidence implicating functional abnormalities in the frontal-subcortical circuitry, these regions have not been well investigated by magnetic resonance imaging (MRI). The majority of studies have examined these areas separately, and have yielded contradictory results.8–11 Recently, considerable evidence suggests that pathological changes in patients with OCD may be expressed at the level of the spatially distributed network that subsumes the multiple, densely interconnected cortical and subcortical cortices.12–14 This shift from key regions to key neural circuits in the research on OCD may be attributed to the diverse clinical symptoms of the disorder and neuropsychological dysfunctions observed.
Our group recently reported on the increased gray matter density of the frontal subcortical circuitry in patients with OCD by employing a novel voxel-based analysis of segmented MR images.15 However, our finding of the increased regional density of the left orbitofrontal cortex is to some extent conflicting with previous reports by Szeszko et al.11 In their study, Szeszko et al. reported reduced total orbital frontal volume in OCD employing the region of interest (ROI) method. In another MRI investigation using the semiautomated method for neocortical parcellation, Grachev et al.16 reported no volume difference in the orbital frontal regions of 10 female patients with OCD and 10 female normal control subjects. Furthermore, we could not find any regional density differences in the basal ganglia structures, which are consistently suggested to be implicated in the symptomatic expression of OCD, between the patients with OCD and normal control subjects.1,2,4,8 Although these discrepancies between studies may partly arise from methodological differences between voxel-based morphometry (VBM) and ROI methods and the heterogenous study sample, it is necessary to reconcile this disparity in order to more accurately understand the pathophysiology of OCD.
To replicate our prior VBM reports employing ROI approach, we measured volumes of the orbitofrontal cortex, anterior cingulate gyrus, thalamus, and caudate nucleus, which are the main components of the frontal subcortical circuitry in patients with OCD and in normal subjects. On the basis of our previous findings of increased regional density of the left orbitofrontal cortex and thalamus, we hypothesized that patients with OCD would also show increased gray matter volumes in those regions in which ROI method was employed.
METHODS
Subjects
Thirty-six patients with OCD (28 men and eight women) were recruited from the OCD clinic at Seoul National University Hospital. These patients fulfilled the DSM-IV criteria17 for OCD, as diagnosed using the Structured Clinical Interview for DSM-IV (SCID).18 The normal control group consisted of 36 age- and sex-matched healthy volunteers (28 men and eight women) who were recruited from the community through newspaper advertisement. Exclusion criteria for OCD subjects and normal controls were the presence of a significant medical condition, neurological disorder, or history of other major psychiatric disorders such as substance abuse, schizophrenia, and bipolar disorder, which was screened using the SCID. This study was conducted under the use of human subjects established by the institutional review board. After a complete description of the scope of the study, written informed consent was obtained from all subjects.
The mean ages of the OCD group and the control group were 26.33 years (SD=6.18) and 26.33 years (SD=7.58), respectively. The mean periods of education were 13.86 years (SD=2.04) and 15.17 years (SD=1.89) (t=2.814, df=70, p=0.006), respectively, and the mean socioeconomic status19 was ranked 3.00 (SD=0.71) and 2.86 (SD=0.73) (t=−0.79, df=70, P=0.43), respectively. All patients with OCD and normal control subjects were right-handed.20 At the time of the study, the patients had a mean duration of illness of 8.90 years (SD=7.00), ranging from 1 year to 26 years. Four patients with OCD had a major depressive disorder as a comorbidity, but had no other DSM-IV axis I disorder, and five patients with OCD had histories of transient tic disorder, which spontaneously resolved. Eleven patients were drug naïve, and 25 received a prior treatment for their disorder, including selective serotonin reuptake inhibitors or clomipramine (six included a history of combined therapy with neuroleptics), but they all remained psychotropic-free for a period of at least 4 weeks. Clinical assessment included the Yale-Brown Obsessive Compulsive Scale21 (Y-BOCS) for determining OCD symptom severity (mean score for obsessive symptom= 13.31, SD=3.54; mean score for compulsive symptom= 11.22, SD=4.26; mean total score=24.17, SD=5.94).
Magnetic Resonance Image Acquisition and Image Processing
Three-dimensional T1-weighted spoiled gradient echo MR images were acquired on a 1.5-T GE SIGNA Scanner (GE Medical System, Milwaukee). Imaging parameters were: 1.5-mm sagittal slices, echo time=5.5 msec, repetition time=14.4 msec, number of excitation=1, rotation angle=20°, field of view=21×21 cm, and a matrix of 256×256. Magnetic resonance images were processed using an image-processing software package, ANALYZE (version 4.1, Mayo Foundation, Rochester, Minnesota). Images were resampled to 1.0 mm3 voxels, reoriented to the conventional position, and spatially realigned so that the anterior-posterior axis of the brain was aligned parallel to the intercommissural line, and the other two axes were aligned along the interhemispheric fissure. The data sets were then filtered using anisotropic diffusion methods to improve the signal-to-noise ratio. The semiautomated region growing method removed images of tissues exterior to the brain. The extracted brain images were segmented into gray matter, white matter, and cerebrospinal fluid by employing the fuzzy C-mean algorithm.22 Intracranial volume was calculated by adding the volumes of these three components.
Boundary of Region of Interests
We focused on 12 cortical and subcortical subregions (both right and left), namely, the orbitofrontal cortex, rostral-anterior cingulate gyrus, caudal-anterior cingulate gyrus, caudate, putamen, and thalamus. Tracing was performed manually on all coronal slices in the ANALYZE ROI module.
Anterior Cingulate Gyrus
Boundary definition and the method of tracing anterior cingulate gyrus were performed as described by Crespo-Faccoro et al.23 As previously reported by Crespo-Faccoro et al., we chose 1) the coronal plane passing through the point where the central sulcus intersects with the midsagittal plane (plane A) as the border between the anterior and posterior cingulate gyrus, and 2) the coronal plane (plane B) passing through the anterior-most tip of the inner surface of the genu of the corpus callosum as the border between the rostral and caudal anterior cingulate gyrus. The deepest point of the callosal sulcus and the most medial point of the dorsal bank of the cingulate sulcus constitute the inner and outer boundaries of the anterior cingulated gyrus in each coronal slice, respectively (Figure 1). Tracing begins at the plane A and continues rostrally to the most anterior coronal slice containing anterior cingulate gyrus tissue.
Orbitofrontal Cortex
Methods for measuring the orbitofrontal cortex were adapted from Crespo-Faccoro et al.,23 with several modifications for use in our MRI24 (Figure 1). Differing from previous methods by Crespo-Faccoro et al.,23 the straight gyrus and the medial frontal cortex was included in the delineation of the orbitofrontal cortex in this study because it is difficult to distinguish these areas in the absence of triangulated line.24 Before beginning the tracing, the lateral orbital sulcus was identified on the intermediate aspect of the frontal lobe, where it was clearly seen. On the anterior portion of the frontal lobe, the frontomarginal sulcus constitutes the lateral boundary of the orbitofrontal cortex until the lateral orbital sulcus appears. Moving caudally on the serial coronal slices, the deepest point of the lateral orbital sulcus constitutes the lateral boundary of the orbitofrontal cortex. When the lateral orbital sulcus disappears on the coronal slices, the inferior margin of the circular sulcus of the insula defines the lateral boundary of the orbitofrontal cortex caudally. The deepest inferior medial point of the cingulated sulcus constitutes the medial boundary of the orbitofrontal cortex on the posterior and intermediate portions of the orbitofrontal cortex. On the anterior portion, the deepest point of the superior rostral sulcus represents the medial boundary of the orbitofrontal cortex. Anterior boundary is defined by anterior extreme of the frontal pole, and posterior boundary is defined as the most posterior coronal slice that contains some aspect of the posterior medial orbitofrontal gyrus.
Caudate and Putamen
The caudate and the putamen were traced on coronal slices from the rostral to caudal aspect, first on the right side of the image and then on the left side (Figure 1). The sequence of tracing was right caudate, left caudate, right putamen, and left putamen. Tracing commenced when the structure could be seen with the naked eye and ended when the structure was no longer discernible. Anatomical landmarks and boundaries for the caudate and putamen were determined with the aid of the human brain atlas.25
Thalamus
To define the anterior and the posterior boundaries of the thalamus on coronal slices, the sagittal plane was used as a reference line. The main tracing was performed on the coronal plane, in which the boundaries of the thalamus were based on the detailed guidelines of Portas et al.26 the internal capsule, laterally; the third ventricle and the habenular nucleus, medially; the lateral ventricle and the crux fornix, dorsally; and the zona inserta and the red nucleus, ventrally (Figure 1). The lateral and medial geniculate bodies were included as a part of the thalamus.
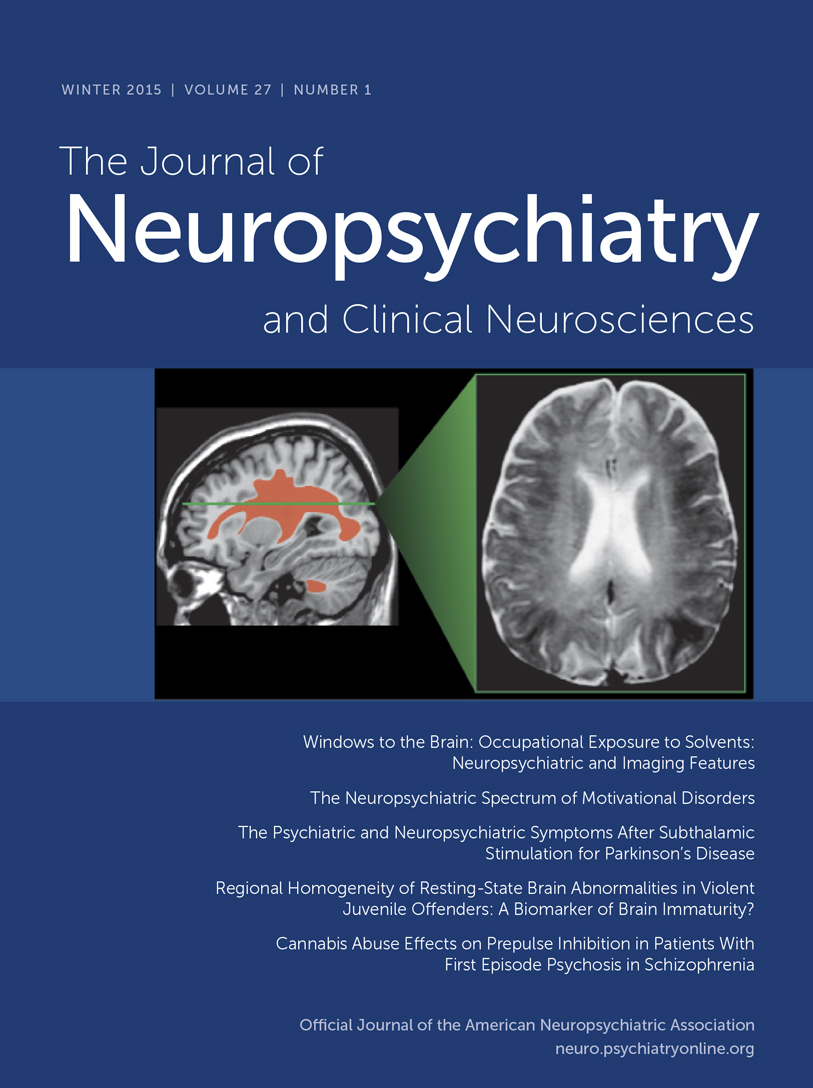
The interrater reliability for each structure volume was assessed in a randomly selected subset of 10 MR scans. As shown in Table 1, the intraclass correlation coefficient (ICC) for the reliability of gray matter volume ranged from a low of r=0.76 (right putamen) to a high of r=0.97 (right thalamus).
Statistical Analyses
We used t tests to examine group differences in demographic and clinical variables. All measures of cortical regional gray matter volumes were subjected to analysis of covariance (ANCOVA), with diagnosis as a between-group factor and the total brain volume as a covariate. The relations between the volumes of each region and subjects characteristics (age, duration, and symptom severity) were examined using Pearson correlation coefficients. All statistical analyses were two-tailed, and P<0.05 was used as the level of significance. Brain structures were examined separately because of their functional and neuroanatomical heterogeneity and the possibility that OCD may involve structural pathology in a single frontal region or subcortical region.
RESULTS
Mean intracranial volume was 1,454.81 cm3 (SD= 135.07) for the OCD group, and 1,408.98 cm3 (SD=144.33) for the normal comparison group, which was not statistically different (t=−1.396, df=70, P=0.679). Table 1 shows gray matter volumes of each ROI subregion and the results of the ANCOVA, taking total brain volume as a covariate and diagnosis as a grouping variable. As shown in Table 1, the left orbitofrontal volume was significantly smaller in patients with OCD (F=5.352, df=1, P=0.024). No significant differences were found in the volumes of the other cortical and subcortical regions measured in this study, which included the right orbitofrontal cortex, anterior cingulate gyrus, thalamus, caudate, and putamen. The volume of the left orbitofrontal cortex showed significant negative correlation (r=−0.402, P=0.017) with the total Yale-Brown Obsessive Compulsive Scale (Y-BOCS) scores of the OCD patients (Figure 2), and the right orbitofrontal cortex volume negatively correlated (r=−0.344, P=0.040) with the compulsive subscale of Y-BOCS. However, no significant association was found between brain structure volumes and the duration of illness or age at clinical symptom onset in patients with OCD.
DISCUSSION
The main finding of this study is that the left orbitofrontal volume is reduced in OCD patients. Although there have been relatively few volumetric studies of the orbitofrontal cortex in OCD, our finding is partially consistent with a previous report by Szeszko et al.11 In their study, Szeszko et al. reported reduced total orbital frontal volume, which included both gray and white matter in OCD, while only the left orbital frontal volume showed a significant group difference. For a parcellation of the orbitofrontal cortex, however, Szeszko et al.11 employed topographic methods based on surface sulcal landmarks, which involve the substantial variability of the interindividual and interhemispheric gyral and sulcal patterns.23,27 Yet, a more detailed topographic method was used in our study for a delineation of the orbitofrontal cortex, as suggested by Crespo-Faccoro et al.,23 to reflect interindividual variability of the orbitofrontal cortex. In another MRI investigation using semiautomated method for neocortical parcellation, Grachev et al.16 reported no volume difference in the orbital frontal regions of 10 female patients with OCD and 10 female normal control subjects. However, the statistical capacity of their study may have been limited by their small sample size. In the current study, reduced volume of the left orbitofrontal cortex in OCD was shown, using a more detailed topographic method for a delineation of the orbitofrontal cortex.
However, our finding of reduced volume of the left orbitofrontal cortex conflicts with that of our prior study, which employed VBM in OCD.15 In the previous study, we reported increased gray matter density of the left orbitofrontal cortex. There are several hypotheses accounting for these discrepant results. First, the regional differences detected in the previous study should be viewed as representing foci of maximal change rather than regions that are exclusively affected because VBM does not reflect changes of the whole region of the orbitofrontal structure. Second, the sources of differences may arise from the changes in the shape or displacement of structures in the course of spatial normalization.28 Finally, statistical problems of multiple comparisons may cause the different findings between studies, although we attempted to apply a strict criterion (clusters of more than 50 contiguous voxels with a threshold of P<0.001) to avoid type I errors in the VBM study. In particular, Kubichi et al.28 emphasized the importance of comparisons with manual ROI studies as well as careful interpretation of the results, given that factors other than volume alone influence VBM results.
In the present study, a significant negative correlation was found between the left orbitofrontal volume and the symptom severity, as measured by Y-BOCS in patients with OCD, but no significant correlations were found between the gray matter volumes demarcated and the duration of illness or the age at onset. In the previous functional studies, it was reported that the orbitofrontal cortex had increased glucose metabolic rates when compared to normal control subjects in resting states7,29 and decreased rates after successful treatment of symptoms .5,30 This suggests that the orbitofrontal cortex region may be involved in mediating the expression of obsessive-compulsive symptoms. Furthermore, there has been much experimental and clinical evidence that the orbitofrontal cortex is involved in the mediation of emotional response to biologically significant stimuli and in the inhibition of behavioral response.31 Our results suggest that a structural abnormality of the left orbitofrontal cortex plays a critical role in symptomatic expression of OCD.
On the other hand, no significant group differences were found in the anterior cingulate gyrus, thalamus, and basal ganglia structures. Prior reports of a structural investigation of the caudate nucleus are controversial.8,9,32,33 Yet, our results are consistent with those of the previous studies, which reported normal caudate volume.9,32,33 In a comprehensive analysis of prior structural and functional imaging studies, Aylward et al.9 suggested that the heterogenous nature of OCD might explain the inconsistencies between studies. In particular, they insisted that structural aberrations of the caudate nucleus are more evident in patients with ventricular enlargement and the soft neurological signs that are common in childhood onset. Patients in the present study were relatively free from soft neurological signs such as tics (only five patients had tic history). The nonsignificant group differences identified in the thalamus and in the anterior cingulate are consistent with previous MRI investigations in adults with OCD, which uniformly yielded negative findings.10,11,32
The most striking finding in the present study is that only the left orbitofrontal volume was significantly reduced in patients with OCD, and there were no additional structural abnormalities in other brain regions composing the frontal-subcortical tracts (i.e., abnormalities that have been implicated in previous functional neuroimaging studies of OCD, as mentioned above). One possible explanation for this morphological and functional discrepancy might be related to the methodological limitations of delineating ROIs in the current study. These may have been large enough to prevent the detection of subtle neuronal changes, and thus a significant change in some neuronal field could have been obscured, as surrounding areas within the same ROI showed no changes. In fact, other measures such as 1H-magnetic resonance spectroscopy of N-acetylaspartate have identified abnormalities of the thalamus,34,35 anterior cingulate,36 and striatum36,37 in OCD patients.
Despite these thought-provoking results, our study has several limitations. First, it does not provide information about white matter volumes because of difficulties concerning the localization of clear anatomic landmarks that define white matter subregions, which would have helped in the interpretation of our results. Second, we parceled most of the main subregions composing the frontal-subcortical circuitry, which inevitably leads to an increase in the number of comparisons, and thus increases the risk of a type I error in the interpretation of results. To conclude, we found reduced left orbitofrontal volume in patients with OCD and significant negative correlations between the bilateral orbital frontal cortex and symptom severity by simultaneously investigating the main structures composing the frontal-subcortical circuitry. These findings suggest that a structural abnormality of the left orbitofrontal cortex plays a critical role in both the clinical and cognitive expression of OCD. Future research to determine the involvement of white matter tracts of this circuitry may shed further light on the pathophysiology of this disorder.
ACKNOWLEDGMENTS
This study was supported by the Korean Research Foundation (2001-041-F00182).

FIGURE 1. Delineation of the Anterior Cingulate, Orbitofrontal Cortex, Caudate Nucleus, Putamen and Thalamus Regions of Interest
A. Caudal-anterior cingulate (1,2) is well dermarcated in coronal plane.
B. Rostral-anterior cingulate (3,4), and orbitofrontal cortex (5,6) are visualized in coronal plane.
C. Caudate nucleus (7,8) and putamen (9,10) are visualized in coronal plane.
D. Thalamus (11,12) is visualized in coronal plane.

FIGURE 2. Correlation Analysis Between Left Orbitofrontal Volume and the YBOCS.
Significant negative correlation (r=−0.402, p=0.017) was observed
 |
1 Insel TR: Toward a neuroanatomy of obsessive-compulsive disorder. Arch Gen Psychiatry 1992; 49:739–744Crossref, Medline, Google Scholar
2 Saxena S, Brody AL, Schwartz JM, et al: Neuroimaging and frontal-subcortical circuitry in obsessive-compulsive disorder. Br J Psychiatry 1998; 35(suppl):26–37Google Scholar
3 De Marchi N, Mennella R: Huntington's disease and its association with psychopathology. Harv Rev Psychiatry 2000; 7:278–289Crossref, Medline, Google Scholar
4 Rauch SL, Savage CR: Neuroimaging and neuropsychology of the striatum: bridging basic science and clinical practice. Psychiatr Clin North Am 1997; 20:741–768Crossref, Medline, Google Scholar
5 Saxena S, Brody AL, Maidment KM, et al: Localized orbitofrontal and subcortical metabolic changes and predictors of response to paroxetine treatment in obsessive-compulsive disorder. Neuropsychopharmacology 1999; 21:683–693Crossref, Medline, Google Scholar
6 Rauch SL, Jenike MA, Alpert NM, et al: Regional cerebral blood flow measured during symptom provocation in obsessive-compulsive disorder using oxygen 15-labeled carbon dioxide and positron emission tomography. Arch Gen Psychiatry 1994; 51:62–70Crossref, Medline, Google Scholar
7 Kwon JS, Kim JJ, Lee DW, et al: Neural correlates of clinical symptoms and cognitive dysfunctions in obsessive-compulsive disorder. Psychiatry Res Neuroimaging 2003; 122:37–47Crossref, Medline, Google Scholar
8 Robinson D, Wu H, Munne RA, et al: Reduced caudate nucleus volume in obsessive-compulsive disorder. Arch Gen Psychiatry 1995; 52:393–398Crossref, Medline, Google Scholar
9 Aylward EH, Harris GJ, Hoehn-Saric R, et al: Normal caudate nucleus in obsessive-compulsive disorder assessed by quantitative neuroimaging. Arch Gen Psychiatry 1996; 53:577–584Crossref, Medline, Google Scholar
10 Jenike MA, Breiter HC, Baer L, et al: Cerebral structural abnormalities in obsessive-compulsive disorder: a quantitative morphometric magnetic resonance imaging study. Arch Gen Psychiatry 1996; 53:625–632Crossref, Medline, Google Scholar
11 Szeszko PR, Robinson D, Alvir JM, et al: Orbital frontal and amygdala volume reductions in obsessive-compulsive disorder. Arch Gen Psychiatry 1999; 56:913–919Crossref, Medline, Google Scholar
12 Bradshaw JL, Sheppard DM: The neurodevelopmental frontostriatal disorders: evolutionary adaptiveness and anomalous lateralization. Brain Lang 2000; 73:297–320Crossref, Medline, Google Scholar
13 Rosenberg DR, Keshavan MS: AE Bennett Research Award: Toward a neurodevelopmental model of obsessive-compulsive disorder. Biol Psychiatry 1998; 43:623–640Crossref, Medline, Google Scholar
14 Saxena S, Rauch SL: Functional neuroimaging and the neuroanatomy of obsessive-compulsive disorder. Psychiatr Clin North Am 2000; 23:563–586Crossref, Medline, Google Scholar
15 Kim JJ, Lee MC, Kim JS, et al: Grey matter abnormalities in obsessive-compulsive disorder: statistical parametric mapping of segmented magnetic resonance images. Br J Psychiatry 2001; 179:330–334Crossref, Medline, Google Scholar
16 Grachev ID, Breiter HC, Rauch SL, et al: Structural abnormalities of frontal neocortex in obsessive-compulsive disorder. Arch Gen Psychiatry 1998; 55:181–182Crossref, Medline, Google Scholar
17 American Psychiatric Association: Diagnostic and Statistical Manual of Mental Disorders, 4th ed (DSM-IV). Washington, DC, American Psychiatric Press, 1994Google Scholar
18 First MB, Spitzer RL, Gibbon M, et al: Structured Clinical Interview for DSM-IV Axis I Disorders (SCID), Clinician Version. Washington, DC, American Psychiatric Press, 1996Google Scholar
19 Hollingshead AB, Redlich FC: Social Class and Mental Illness: A Community Study. New York, John Wiley & Sons, 1958Google Scholar
20 Annett M: A classification of hand preference by association analysis. Br J Psychol 1970; 61:303–321Crossref, Medline, Google Scholar
21 Goodman WK, Price LH, Rasmussen SA, et al: The Yale-Brown Obsessive Compulsive Scale, I: development, use, and reliability. Arch Gen Psychiatry 1989; 46:1006–1011Crossref, Medline, Google Scholar
22 Cannon RL, Dave J, Bezdek J: Efficient implementation of the fuzzy C-means clustering algorithm. IEEE T Pattern Anal 1986; 8:248–255Crossref, Medline, Google Scholar
23 Crespo-Facorro B, Kim JJ, Andreasen NC, et al: Human frontal cortex: an MRI-based parcellation method. Neuroimage 1999; 10:500–519Crossref, Medline, Google Scholar
24 Kim JJ, Kwon JS, Kang DH, et al: Frontal substructural abnormalities evaluated by the parcellation of MRI in patients with schizophrenia. J Korean Neuropsychiatr Assoc 2002; 41:998–1009Google Scholar
25 Duvernoy HM, Bourgouin P, Cabanis EA, et al: The Human Brain: Surface, Three-Dimensional Sectional Anatomy With MRI, and Blood Supply. New York, Springer-Verlag, 1999Google Scholar
26 Portas CM, Goldstein JM, Shenton ME, et al: Volumetric evaluation of the thalamus in schizophrenic male patients using magnetic resonance imaging. Biol Psychiatry 1998; 43:649–659Crossref, Medline, Google Scholar
27 Steinmetz H, Herzog A, Schlang G, et al: Brain (a)symmetry in monozygotic twin. Cereb Cortex 1995; 5:296–300Crossref, Medline, Google Scholar
28 Kubicki M, Shenton ME, Salisbury DF, et al: Voxel-based morphometric analysis of gray matter in first episode schizophrenia. Neuroimage 2002; 17:1711–1719Crossref, Medline, Google Scholar
29 Rubin RT, Villanueva-Meyer J, Ananth J, et al: Regional xenon 133 cerebral blood flow and cerebral technetium 99m HMPAO uptake in unmedicated patients with obsessive-compulsive disorder and matched normal control subjects: determination by high-resolution single-photon emission computed tomography. Arch Gen Psychiatry 1992; 49:695–702Crossref, Medline, Google Scholar
30 Kang DH, Kwon JS, Kim JJ, et al: Brain glucose metabolic changes associated with neuropsychological improvements after 4 months of treatment in patients with obsessive-compulsive disorder. Acta Psychiatr Scand 2003; 107:291–297Crossref, Medline, Google Scholar
31 Zald DH, Kim SW: Anatomy and function of the orbital frontal cortex, II: function and relevance to obsessive-compulsive disorder. J Neuropsychiatry Clin Neurosci 1996; 8:249–261Link, Google Scholar
32 Kellner CH, Jolley RR, Holgate RC, et al: Brain MRI in obsessive-compulsive disorder. Psychiatry Res 1991; 36:45–49Crossref, Medline, Google Scholar
33 Stein DJ, Hollander E, Chan S, et al: Computed tomography and neurological soft signs in obsessive-compulsive disorder. Psychiatry Res 1993; 50:143–150Crossref, Medline, Google Scholar
34 Rosenberg DR, Amponsah A, Sullivan A, et al: Increased medial thalamic choline in pediatric obsessive-compulsive disorder as detected by quantitative in vivo spectroscopic imaging. J Child Neurol 2001; 16:636–641Crossref, Medline, Google Scholar
35 Fitzgerald KD, Moore GJ, Paulson LA, et al: Proton spectroscopic imaging of the thalamus in treatment-naive pediatric obsessive-compulsive disorder. Biol Psychiatry 2000; 47:174–182Crossref, Medline, Google Scholar
36 Ebert D, Speck O, Konig A, et al: 1H-magnetic resonance spectroscopy in obsessive-compulsive disorder: evidence for neuronal loss in the cingulate gyrus and the right striatum. Psychiatry Res 1997; 74:173–176Crossref, Medline, Google Scholar
37 Bartha R, Stein MB, Williamson PC, et al: A short echo 1H spectroscopy an volumetric MRI study of the corpus striatum in patients with obsessive-compulsive disorder. Am J Psychiatry 1998; 155:1584–1591Crossref, Medline, Google Scholar