Anxiety and Regional Cortical Glucose Metabolism in Patients With Alzheimer’s Disease
Previous studies found abnormalities of cerebral metabolism and blood flow in the temporal cortex and hippocampus in patients with panic disorder. 16 – 20 Patients with generalized anxiety disorder revealed increased glucose metabolism in the temporal lobe and decreased absolute metabolism in the basal ganglia. 21 In patients with posttraumatic stress disorder, hippocampal volume reduction, increased activation of the amygdala with symptom provocation, and decreased activity of Broca’s area have been reported. 22 , 23 Studies of social anxiety disorder indicate exaggerated responsiveness of medial temporal lobe structures during symptom provocation. 24 , 25 Increased activity in the orbitofrontal cortex, the anterior cingulate gyrus, the caudate nuclei, and the thalamus reflects the hyperactivity in cortico-striato-thalamo-cortical circuitry in obsessive-compulsive disorder. 26 On the other hand, in patients with posttraumatic stress disorder, decreased NAA (N-acetyl aspartate)/creatine ratios in the medial temporal lobes bilaterally were reported in a magnetic resonance spectroscopy study. 27 These studies suggest that neurophysiological changes or altered neural responsiveness in the amygdala and related limbic areas, such as the hippocampus, parahippocampal area, insular cortex, and anterior cingulate cortex, contributes to anxiety disorders. 26
The etiology and the pathological mechanisms related to anxiety in patients with Alzheimer’s disease remain unclear, and few studies 28 have used neuroimaging or other techniques to examine regional brain structure or function. In this study, we investigated the relationship between anxiety and regional glucose metabolism in Alzheimer’s disease by using the Neuropsychiatric Inventory (NPI) 29 and [ 18 F] fluorodeoxyglucose positron emission tomography (PET).
METHOD
Patients
This study included 41 outpatients (35 men, six women) diagnosed with probable Alzheimer’s disease, according to NINCDS-ADRDA criteria, 30 and recruited from the VA Greater Los Angeles Health Care System or other outpatient settings affiliated with the University of California, Los Angeles. Each participant underwent a thorough clinical evaluation that included a detailed history, assessment of individual cognitive domains, review of psychiatric symptoms, and a laboratory evaluation with structural neuroimaging study. A clinical research investigator reviewed clinical evaluations and confirmed an Alzheimer’s disease diagnosis. The mean age was 75.5 (SD=8.4) years, the mean duration of dementia was 2.8 (SD=2.3) years, and the mean Mini-Mental State Examination (MMSE) score was 19.6 (SD=6.1). The participants had not taken any psychotropic medication during the 3 weeks before the research assessment and PET imaging, except for a daily regimen of trazodone, up to 50 mg, as needed for sleep. No patient was taking a cholinesterase inhibitor or memantine. The study procedures and risks were discussed with each participant and his or her family representative. Written informed consent was obtained according to Institutional Review Board guidelines after the procedures had been fully explained.
Clinical Assessment
Each participant underwent the clinical assessment immediately before the PET imaging procedure. The assessments included the MMSE and NPI. Caregivers were interviewed following the NPI procedures previously described, with screening questions for each behavior posed first. 29 The caregiver was asked if the behavior represented a change from that exhibited by the patient prior to the onset of the dementia and whether it was present during the past month. If a positive response was obtained from the screening question, then the behavioral domain was explored with scripted questions that focused on specific features of the behavioral disturbance. The caregiver then rated the extent of the symptom; scores from 1 to 4 (with 4 being the most severe) for the frequency and 1 to 3 (with 3 being the most severe) for the severity of each behavior. The composite score for each domain was the product of the frequency and severity subscores; the maximum attainable score was 12. The NPI has demonstrated content validity, convergent validity, item independence, interrater reliability and test-retest reliability in patients with Alzheimer’s disease. 29 For some analyses in this study, the 41 patients were divided into two groups: those with anxiety symptoms (anxiety group; caregiver endorsed patient anxiety on the NPI) and those without anxiety symptoms (non-anxiety group).
PET Imaging
PET imaging of cerebral metabolic activity was performed by using the Siemens 953/31 tomographic scanner (Siemens Medical Solutions, Hoffman Estates, Ill), which captures approximately 3-mm slices of activity and has in-plane and axial resolution of approximately 5 mm at full width at half maximum. Radial artery cannulation was performed in order to sample arterial blood to measure the input function for use in the kinetic model. Each participant received an intravenous dose of 5 to 10 mCi [ 18 F] fluorodeoxyglucose (FDG), which was synthesized at the PET Imaging Facility of the VA Greater Los Angeles Health Care System according to the technique used by Hamacher et al. 31 During the 40-minute uptake phase, the patient rested in a dimly lit room with eyes open and ears unplugged. Arterial blood samples were obtained at defined intervals to describe the input function. The patient was then positioned in the tomograph, with the imaging plane parallel to the canthomeatal line. Head position was maintained with the aid of a thin restraining tape across the patient’s forehead. Metabolic data were acquired over approximately 40 minutes.
Image Analyses
Data analysis was performed using statistical parametric mapping (SPM2; www.fil.ion.ucl.ac.uk/spm) in Matlab 6.5 (Mathworks, Natick, MA) software. The PET images from each subject were transformed to a standard template in the Montreal, Que., Canada, Neurological Institute Talairach and Tournoux atlas space. 32 Metabolic values were scaled proportionately. Images were smoothed with a 6 mm Gaussian filter. A simple regression was conducted to analyze the correlation between regional glucose metabolism and NPI anxiety item score (frequency × severity). MMSE and NPI depression items (frequency × severity) were individually entered into the model as covariates. The stereotactic coordinates of the peak voxel differences were determined with reference to the Talairach and Tournoux atlas. Voxel differences achieving a threshold of at least p<0.01 (uncorrected) were displayed in three orthogonal projections. Only clusters larger than 200 voxels were reported as significant. Significant clusters are identified by the voxel of peak significance.
In a second analysis, PET imaging data from each patient were coregistered to his or her MR image 33 and resliced to 3 mm thickness in the axial plane. PET data were corrected for partial volume effects due to atrophy or other factors using segmented MR images and the calibrated Gaussian impulse response function. 34 , 35 Regions of interest (ROI) in the temporal lobe were outlined on each subject’s MRI and transferred onto the coregistered PET image. The temporal regions included bilateral amygdala, hippocampus, parahippocampal gyrus, anterior superior temporal gyrus, posterior superior temporal gyrus, temporal pole, insula, middle/inferior temporal gyrus, and fusiform gyrus. We calculated the mean glucose metabolic rate in each ROI volume. The glucose metabolic rate in each ROI was expressed relative to the mean metabolic rate in the primary visual cortex as a reference region. We compared regional glucose metabolic rates between the anxiety group and the non-anxiety group using the two-sample t test. We quote two-tailed p values.
RESULTS
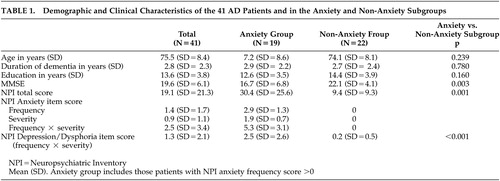
Table 1 shows the demographic features, MMSE scores, and NPI item scores for the overall sample of 41 Alzheimer’s disease patients and for the anxiety and non-anxiety subgroups. A high proportion of patients were men due to prominent participation of veterans. However, the proportions of men and women were not different in the group with anxiety (3/19 were women) compared to the group without anxiety (3/22 were women). In addition, by chi-square analysis there was no difference in caregiver gender, caregiver race, or caregiver relationship to the patient between the group of patients with anxiety and those without anxiety. Three of the 41 patients were taking a low dose of trazodone infrequently as a sleep aid; none was taking trazodone regularly. The range of NPI anxiety scores (frequency × severity) in the entire sample was 0 to 12. NPI anxiety item scores and depression item scores (frequency × severity) were significantly correlated (r=0.571, p<0.001). NPI anxiety item score was also associated with NPI total score (r=0.70, p<0.001).
 |
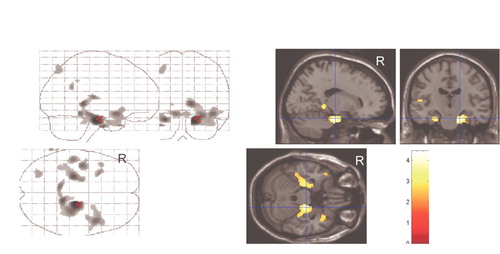
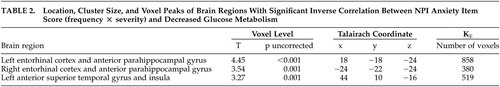
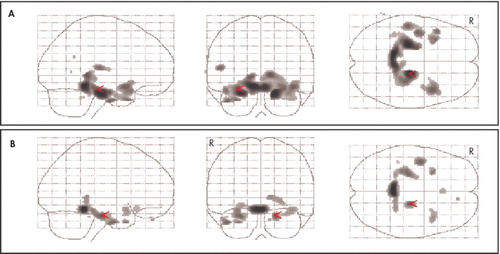
In the SPM analysis, a higher NPI anxiety item score was associated with lower resting metabolism in the bilateral entorhinal cortex, anterior parahippocampal gyrus, and left anterior superior temporal gyrus and insula ( Figure 1 ) ( Table 2 ). Cortical regions with significant associations were generally symmetrical across the hemispheres, with slightly higher correlations in broader areas of the left hemisphere. These negative correlations persisted when an MMSE score was included as a covariate in the analysis ( Figure 2A ). With control for an NPI depression item score, the strength of statistical relationships was lower, but the association with the glucose metabolic rate in the right entorhinal cortex and anterior parahippocampal gyrus persisted ( Figure 2B ). With control for the total NPI score, the relationship between anxiety and low cortical metabolism persisted in the left superior temporal gyrus, was less robust in the left entorhinal and anterior parahippocampal region, and was no longer present in the right entorhinal and anterior parahippocampal region.
 |
In order to explore further the influence of other neuropsychiatric symptoms on the observed relationship between anxiety and regional cortical metabolism, SPM analyses were repeated with the scores on those NPI items with at least a modest association with NPI anxiety item scores included as covariates in the model. These covariates included delusion item score (r=0.50, p<0.001), hallucination item score (r=0.48, p=0.001), agitation item score (r=0.37, p=0.018), apathy item score (r=0.31, p=0.05), and disinhibition item score (r=0.31, p=0.048). With control for each of these NPI scores, the association between anxiety and low metabolic rate in the right entorhinal cortex and anterior parahippocampal gyrus persisted. There was no significant relationship between a higher anxiety item score and higher metabolism in any region.
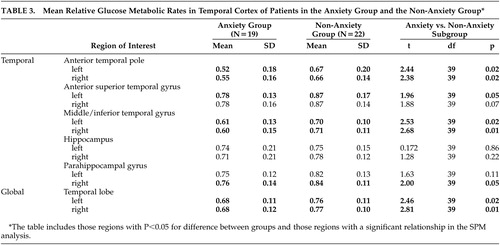
In the ROI analysis, patients with anxiety had significantly lower metabolism in the anterior temporal pole and the middle/inferior temporal gyrus, bilaterally, compared with those without anxiety ( Table 3 ). There was also a trend for lower metabolism in the anterior aspect of the left superior temporal gyrus (p=0.05) and in the right parahippocampal gyrus (p=0.05) among those with anxiety. The mean glucose metabolic rate in the global temporal lobe in each hemisphere was also lower in the Alzheimer’s disease patients who had anxiety. In no temporal cortex region was the glucose metabolic rate higher in the group with anxiety.
 |
DISCUSSION
This study shows that anxiety symptoms in Alzheimer’s disease are inversely related to resting glucose metabolism in the bilateral entorhinal cortex and anterior parahippocampal gyrus. There is an additional association with low metabolism in the left anterior superior temporal gyrus and insula. The results of this study indicate that reduced functional activity in the bilateral anterior inferomedial temporal cortex may contribute to the expression of anxiety in Alzheimer’s disease. These findings are not likely to be due to cognitive decline because associations persisted when the MMSE score was included as a covariate in the SPM analysis. When the NPI depression item score was included, the strength of statistical associations was lower. This may be due to the co-occurrence of anxiety and depression in Alzheimer’s disease as measured on the NPI in this study. Alternatively, reduced metabolism in these temporal regions may contribute to both anxiety and dysphoria and reflect shared regional pathophysiological contributions.
SPM achieves a voxel-by-voxel analysis and allows examination of smaller cortical areas that may be significant findings but may not be detected in the ROI analysis because the overall ROI effect is diminished by proximate areas within the anatomical region that lack association. On the other hand, the ROI analysis allows for comparisons of glucose metabolism in brain regions with boundaries chosen a priori. To confirm anatomical relationships identified using SPM, we included an ROI analysis to compare the anxiety group with the non-anxiety group. In this ROI analysis, the mean metabolic rate in bilateral temporal cortex in the anxiety group was 13% lower than in the non-anxiety group. Overall, the results in the ROI and SPM analyses are similar, with relative hypometabolism in the anterior and medial temporal cortex among those Alzheimer’s disease patients with anxiety. The difference between the analyses is most notable for the parahippocampal gyrus. SPM revealed that metabolism in only a distinct portion (anterior part) of this gyrus is associated with anxiety, while the corresponding ROI measurement includes metabolic activity in its entire longitudinal extent in the temporal lobe.
There are few reports that describe the relationship between glucose metabolism and anxiety symptoms in Alzheimer’s disease. Sultzer et al. 28 found significant correlations between the anxiety/depression factor score on the Neurobehavioral Rating Scale and metabolism in the parietal lobe, without a relationship with metabolic activity in temporal cortex. However, this previous study included mood and anxiety symptoms in a combined factor score, used a different instrument to measure clinical symptoms, and examined only relationships with mean glucose metabolic rate across cortical lobes rather than individual regions.
Metabolic activity in medial temporal legions in both hemispheres was associated with anxiety in Alzheimer’s disease patients in this study, although the relationship with anterior superior temporal gyrus metabolism was most prominent in the left hemisphere. The laterality effect varied across the SPM and ROI analyses. Laterality effects might be caused by several factors, such as the influence of other lesions or the severity of the disease, or may reflect sample size and statistical thresholds.
Functional neuroimaging studies have found medial temporal involvement in other anxiety disorders. Several studies of patients with panic disorder in the resting condition have suggested that abnormalities in the hippocampus, parahippocampal area, and superior temporal regions are associated with anxiety. 18 – 20 In a single photon emission computed tomography (SPECT) study, panic disorder subjects exhibited reduced regional cerebral blood flow in the hippocampal area bilaterally. 18 In an FDG-PET study, subjects with panic disorder exhibited a lower left/right hippocampal ratio of glucose metabolism. 19 In contrast, another FDG-PET study found that panic disorder subjects exhibited elevated metabolism in the left hippocampus and parahippocampal area, but reduced metabolism in right superior temporal regions. 20 In addition to these findings, studies of patients with social anxiety disorder 24 , 25 and posttraumatic stress disorder 22 , 23 have found exaggerated responsiveness of medial temporal lobe structures during symptom provocation. 26 Patients with generalized anxiety disorder had increased temporal cortex metabolism in concert with decreaed basal ganglia metabolism, 21 suggesting that subcortical functional activity may play a role and that the specific circuits involved may vary across the anxiety syndromes or clinical populations. Other physiological studies have also supported the relationship between anxiety and functional activity in the medial temporal cortex. Increased reactivity of the amygdala has been seen in individuals with a polymorphism in the promoter region of the serotonin transporter gene. 36 Electrical stimulation of the amygdala in humans elicits feelings of fear and anxiety and autonomic arousal, 37 and lesion of the amygdala in humans impairs the perception of fear or danger. 38
Our results support medial temporal involvement in the expression of anxiety, across those disorders that have a prominent component of anxiety. Functional neuroimaging techniques have demonstrated that the neural substrates of emotions are not confined to one specific area of the brain but consist of complex interactions between different brain structures. Several studies support the amygdala as a pivotal structure in the genesis of fear and anxiety. 39 , 40 Dysfunction in other areas of the temporal cortex, which are reciprocally connected to the amygdala and related regions, may contribute prominently to anxiety symptoms via such functional connections.
There are several limitations to this study. First, the analyses do not consider interactions with metabolism in other brain areas. It is also possible that anatomically distant lesions contribute to anxiety through a neural network. Second, the NPI is a caregiver-rated instrument and may not entirely capture the true extent of anxiety experienced by Alzheimer’s disease patients. It also is not designed specifically to establish a diagnosis or anxiety disorder; further research using other instruments is needed to confirm our results. Third, Alzheimer’s disease patients have substantially reduced temporal metabolism compared with elderly healthy subjects. There may be a threshold effect in this study, and regional temporal cortex metabolic effects here are occurring in the context of modest hypometabolism across broader cortical areas in all patients with Alzheimer’s disease. Fourth, we are not able to exclude the effect of stress response during the PET scan procedure. The brain metabolism in some patients might have at least partly reflected this effect rather than being exclusively due to an enduring cortical “anxiety substrate” caused by the disease. Fifth, the difference in education between the anxiety and the non-anxiety groups was close to significant. A lower cognitive reserve may contribute to higher anxiety in Alzheimer’s disease, possibly via a more limited functional capacity in the temporal cortex or in an alternative neural mechanism.
The results of this study suggest that dysfunction in temporolimbic circuits contributes to anxiety symptoms across neuropsychiatric disorders. Clarifying the relationship between anxiety symptoms and regional cortical metabolism in patients with Alzheimer’s disease can provide a framework to understand neurophysiological events that are involved in development of symptoms, longitudinal stability of symptoms, and response to treatment.
1. Benoit M, Dygai I, Migneco O, et al: Behavioral and psychological symptoms in Alzheimer’s disease: relation between apathy and regional cerebral perfusion. Dement Geriatr Cogn Disord 1999; 10:511–517Google Scholar
2. Mirakhur A, Craig D, Hart DJ, et al: Behavioural and psychological syndromes in Alzheimer’s disease. Int J Geriatr Psychiatry 2004; 19:1035–1039Google Scholar
3. Eustace A, Coen R, Walsh C, et al: A longitudinal evaluation of behavioural and psychological symptoms of probable Alzheimer’s disease. Int J Geriatr Psychiatry 2002; 17:968–973Google Scholar
4. Moran M, Walsh C, Lynch A, et al: Syndromes of behavioural and psychological symptoms in mild Alzheimer’s disease. Int J Geriatr Psychiatry 2004; 19:359–364Google Scholar
5. Porter VR, Buxton WG, Fairbanks LA, et al: Frequency and characteristics of anxiety among patients with Alzheimer’s disease and related dementias. J Neuropsychiatry Clin Neurosci 2003; 15:180–186Google Scholar
6. Burns A, Jacoby R, Levy R: Psychiatric phenomena in Alzheimer’s disease, IV: disorders of behaviour. Br J Psychiatry 1990; 157:86–94Google Scholar
7. Teri L, Ferretti LE, Gibbons LE, et al: Anxiety of Alzheimer’s disease: prevalence, and comorbidity. J Gerontol A Biol Sci Med Sci 1999; 54:348–352Google Scholar
8. Ferretti L, McCurry SM, Logsdon R, et al: Anxiety and Alzheimer’s disease. J Geriatr Psychiatry Neurol 2001; 14:52–58Google Scholar
9. Chemerinski E, Petracca G, Manes F, et al: Prevalence and correlates of anxiety in Alzheimer’s disease. Depress Anxiety 1998; 7:166–170Google Scholar
10. Ownby RL, Harwood DG, Barker WW, et al: Predictors of anxiety in patients with Alzheimer’s disease. Depress Anxiety 2000; 11:38–42Google Scholar
11. Mintzer JE, Brawman-Mintzer O: Agitation as a possible expression of generalized anxiety disorder in demented elderly patients: toward a treatment approach. J Clin Psychiatry 1996; 57(suppl 7):55–63; discussion 73–55Google Scholar
12. Banazak DA: Anxiety disorders in elderly patients. J Am Board Fam Pract 1997; 10:280–289Google Scholar
13. Finkel SI: Behavioral and psychologic symptoms of dementia. Clin Geriatr Med 2003; 19:799–824Google Scholar
14. Kaufer DI, Cummings JL, Christine D, et al: Assessing the impact of neuropsychiatric symptoms in Alzheimer’s disease: the Neuropsychiatric Inventory caregiver distress scale. J Am Geriatr Soc 1998; 46:210–215Google Scholar
15. Haupt M, Karger A, Janner M: Improvement of agitation and anxiety in demented patients after psychoeducative group intervention with their caregivers. Int J Geriatr Psychiatry 2000; 15:1125–1129Google Scholar
16. Bremner JD, Innis RB, White T, et al: Spect [I-123]iomazenil measurement of the benzodiazepine receptor in panic disorder. Biol Psychiatry 2000; 47:96–106Google Scholar
17. Meyer JH, Swinson R, Kennedy SH, et al: Increased left posterior parietal-temporal cortex activation after D-fenfluramine in women with panic disorder. Psychiatry Res 2000; 98:133–143Google Scholar
18. De Cristofaro MT, Sessarego A, Pupi A, et al: Brain perfusion abnormalities in drug-naive, lactate-sensitive panic patients: a spect study. Biol Psychiatry 1993; 33:505–512Google Scholar
19. Nordahl TE, Semple WE, Gross M, et al: Cerebral glucose metabolic differences in patients with panic disorder. Neuropsychopharmacology 1990; 3:261–272Google Scholar
20. Bisaga A, Katz JL, Antonini A, et al: Cerebral glucose metabolism in women with panic disorder. Am J Psychiatry 1998; 155:1178–1183Google Scholar
21. Wu JC, Buchsbaun MS, Hershey TG, et al: PET in generalized anxiety disorder. Biol Psychiatry 1991; 29:1181–1199Google Scholar
22. Hull AM: Neuroimaging findings in post-traumatic stress disorder: systematic review. Br J Psychiatry 2002; 181:102–110Google Scholar
23. Taber KH, Rauch SL, Lanius RA, et al: Functional magnetic resonance imaging: application to posttraumatic stress disorder. J Neuropsychiatry Clin Neurosci 2003; 15:125–129Google Scholar
24. Birbaumer N, Grodd W, Diedrich O, et al: fMRI reveals amygdala activation to human faces in social phobics. Neuroreport 1998; 9:1223–1226Google Scholar
25. Schneider F, Weiss U, Kessler C, et al: Subcortical correlates of differential classical conditioning of aversive emotional reactions in social phobia. Biol Psychiatry 1999; 45:863–871Google Scholar
26. Rauch SL, Shin LM, Wright CI: Neuroimaging studies of amygdala function in anxiety disorders. Ann N Y Acad Sci 2003; 985:389–410Google Scholar
27. Freeman TW, Cardwell D, Karson CN, et al: In vivo proton magnetic resonance spectroscopy of the medial temporal lobes of subjects with combat-related posttraumatic stress disorder. Magn Reson Med 1998; 40:66–71Google Scholar
28. Sultzer DL, Mahler ME, Mandelkern MA, et al: The relationship between psychiatric symptoms and regional cortical metabolism in Alzheimer’s disease. J Neuropsychiatry Clin Neurosci 1995; 7:476–484Google Scholar
29. Cummings JL, Mega M, Gray K, et al: The Neuropsychiatric Inventory: comprehensive assessment of psychopathology in dementia. Neurology 1994; 44:2308–2314Google Scholar
30. McKhann G, Drachman D, Folstein M, et al: Clinical diagnosis of Alzheimer’s disease: report of the NINCDS-ADRDA work group under the auspices of department of health and human services task force on Alzheimer’s disease. Neurology 1984; 34:939–944Google Scholar
31. Hamacher K, Coenen HH, Stocklin G: Efficient stereospecific synthesis of no-carrier-added 2-[18F]-fluoro-2-deoxy-D-glucose using aminopolyether supported nucleophilic substitution. J Nucl Med 1986; 27:235–238Google Scholar
32. Talairach J, Tournoux P: Co-Planar Stereotactic Atlas of the Human Brain 3-Dimentional Proportional System: An Approach to Cerebral Imaging. New York, Thieme Medical, 1988Google Scholar
33. Itti L, Chang L, Mangin JF, et al: Robust multimodality registration for brain mapping. Hum Brain Mapp 1997; 5:3–17Google Scholar
34. Itti L, Chang L, Ernst T, et al: Improved 3D correction for partial volume effects in brain spect. Hum Brain Mapp 1997; 5:379–388Google Scholar
35. Aston JA, Cunningham VJ, Asselin MC, et al: Positron emission tomography partial volume correction: estimation and algorithms. J Cereb Blood Flow Metab 2002; 22:1019–1034Google Scholar
36. Furmark T, Tillfors M, Garpenstrand H, et al: Serotonin transporter polymorphism related to amygdala excitability and symptom severity in patients with social phobia. Neurosci Lett 2004; 362:189–192Google Scholar
37. Gloor P, Olivier A, Quesney LF, et al: The role of the limbic system in experiential phenomena of temporal lobe epilepsy. Ann Neurol 1982; 12:129–144Google Scholar
38. Adolphs R, Tranel D, Damasio H, et al: Fear and the human amygdala. J Neurosci 1995; 15:5879–5891Google Scholar
39. LaBar KS, LeDoux JE, Spencer DD, et al: Impaired fear conditioning following unilateral temporal lobectomy in humans. J Neurosci 1995; 15:6846–6855Google Scholar
40. Morris JS, Frith CD, Perrett DI, et al: A differential neural response in the human amygdala to fearful and happy facial expressions. Nature 1996; 383:812–815Google Scholar