Neuroimaging Correlates of Apathy and Depression in Alzheimer’s Disease
There are few neuroimaging or neurophysiological studies of depression in Alzheimer’s disease. Using SPECT we found that Alzheimer’s disease patients with major depression had a significantly lower blood perfusion in left temporal and parietal regions than nondepressed Alzheimer’s disease patients. 8 Using quantified electroencephalography (qEEG) we found that depressed Alzheimer’s disease patients had a significantly higher percentage of theta activity in posterior brain areas than nondepressed patients with Alzheimer’s disease. 9 We also reported a significant association between depression (with or without Alzheimer’s disease) and a significantly lower alpha relative power in the right posterior brain region as compared to nondepressed individuals with or without Alzheimer’s disease. 10
For the present study we examined the association between apathy, depression, and structural brain changes in a consecutive series of 79 patients with mild, mild, or moderate Alzheimer’s disease. All patients were assessed for both apathy and depression using a structured psychiatric interview and standardized diagnostic criteria. Gray matter, white matter, and white matter hyperintensity-lobar volumes were measured using a semiautomated volumetric and fully quantified technique. Based on our previous findings, we hypothesized that Alzheimer’s disease patients with apathy would show a relatively larger volume of frontal white matter hyperintensities and frontal cortical atrophy than Alzheimer’s disease patients without apathy and that Alzheimer’s disease patients with depression would show similar abnormalities in right posterior brain regions.
METHODS
Participants
Our Alzheimer’s disease group included a consecutive series of 79 outpatients attending a dementia clinic of a tertiary care center for evaluation and treatment of progressive cognitive decline. We used the following inclusion criteria: NINCDS-ADRDA (National Institute of Neurological and Communicative Diseases and Stroke-Alzheimer’s Disease and Related Disorders Association) criteria for probable Alzheimer’s disease; 11 no history of closed head injuries with loss of consciousness, stroke, or other neurological disorder with CNS involvement; normal results on laboratory tests (to rule out other etiologies of dementia); and no focal lesions on MRI scan (i.e., patients with lacunes or any other focal vascular lesion were excluded from the study). Informed written consent for participation in the study was obtained from patients and caregivers. The study was approved by the Institutional Human Subjects Committee Board.
Psychiatric Examination
Psychiatric evaluations were completed by a psychiatrist who was blind to the neuroimaging findings. The evaluation included administration of the Structured Clinical Interview for DSM-IV (SCID), 12 a semistructured diagnostic interview for assessing signs and symptoms necessary for the major axis I DSM-IV diagnoses of major and minor depression; the Mini-Mental State Exam (MMSE), 13 a global measure of cognitive deficits; the Hamilton Depression Rating Scale (HAM-D), 14 a 17-item interviewer-rated scale for rating the severity of symptoms of depression; and the Apathy Scale, a 14-item scale for rating the severity of symptoms of apathy. 15 Patients with Alzheimer’s disease were interviewed first. Simultaneously, caregivers, who were blind to the results of these interviews, rated the patients’ behaviors with the Apathy Scale. Finally, the psychiatrist administered the SCID to each patient, with both the patient and the caregiver present. Diagnoses of apathy were generated based on caregivers’ ratings on the Apathy Scale, using the diagnostic criteria for apathy reported previously. 16
MRI
All MRI data were acquired on a 1.5 Tesla Signa Horizon system (GE, Milwaukee) using a standard circularly polarized head coil. The imaging protocol included the following sequences: multiplanar “FLASH” localizer; coronal 3D T 1 -weighted gradient echo orthogonal to the anterior commissure-posterior commissure (AC-PC) line (SPGR: TR/TE =24/5 msec, flip angle =40°, in-plane resolution =0.88×1.35 mm, slice thickness =1.5 mm, 2 acquisitions); coronal proton density and T 2 -weighted fast spin echo oriented parallel to coronal 3D T 1 -weighted gradient echo (TR/TE1/TE2 =3,500/32/96 msec, echo train length =8, in-plane resolution =0.88×1.35 mm, slice thickness =3mm, no gap, 1 acquisition). Image post-processing was performed on a Silicon Graphics workstation (Mountain View, Calif.) using the “BRAINS” software (“Brain Research: Analysis of Images, Networks and Systems”; Mental Health Clinical Research Center, University of Iowa Hospitals and Clinics). 17 T 1 , T 2 , and proton density images were realigned on the coronal plane orthogonal to the axial AC-PC and sagittal interhemispheric planes. Reformatted images resolution was extrapolated to 1 mm 3 . Images were then automatically included in a modified Talairach space, which divides the brain into 12 subregions (left and right frontal, parietal, temporal, occipital, subcortical area and cerebellum). After selection of representative pixels of gray matter, white matter, and cerebral spinal fluid (CSF), images were automatically segmented using a Bayesian method based upon discriminant analysis. Total intracranial volume was obtained by manually editing neural net-generated traces along the inner margin of the subarachnoid space. At the foramen magnum, the limit of the cranial compartment was defined by the axial plane containing the line that connected the basion with the ophistion.
White matter hyperintensities, which appear as hyperintense signals on proton density and T 2 images and as hypointensity on T 1 images, were manually edited. For this purpose, polygons surrounding the areas of white matter hyperintensities were traced onto reformatted axial T 2 images. Axial and coronal reformatted images were simultaneously evaluated for better delineation of white matter hyperintensity regions. The BRAINS program assigns white matter hyperintensity pixels to gray matter, which was reclassified after polygon tracing to the category of white matter hyperintensities. Additional information on this technique is provided in a previous publication. 18 Lobar volumes of different tissue types (gray matter, white matter, white matter hyperintensities, and CSF) were normalized to total intracranial volume and expressed as a percentage thereof.
Statistical Analysis
Statistical analysis was carried out using means, standard deviations (SD), Student t tests, and analysis of covariance (ANCOVA) with repeated measures, followed by post-hoc t tests. Age and MMSE scores were entered as covariates given the well-known correlation between increasing age and dementia with increasing brain atrophy. Frequency distributions were compared with chi-square and Fisher’s exact tests. All tests were two-tailed.
RESULTS
Demographic and Clinical Findings
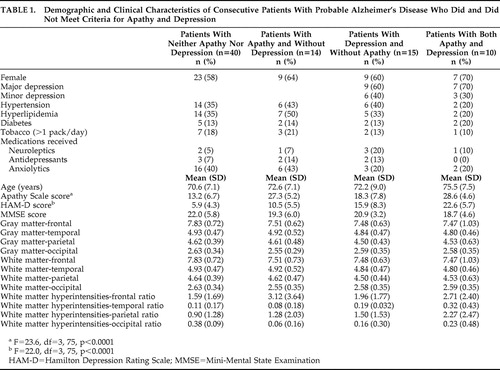
Fourteen of the 79 patients (18%) met criteria for apathy only, 15 patients (19%) met criteria for depression only, 10 patients (13%) met criteria for both apathy and depression, and 40 patients (50%) met criteria for neither apathy nor depression ( Table 1 ). There were no significant between-group differences on main demographic variables. As expected, patients with a clinical diagnosis of apathy had significantly higher Apathy Scale scores, whereas patients with a clinical diagnosis of depression had significantly higher HAM-D scores. None of the patients in our study had received ECT in the past. Patients with apathy had slightly lower MMSE scores than those without apathy. Although this difference was not significant (F=1.54, df=3, 75, p=0.21), we used MMSE scores as a covariate for our neuroimaging statistical analyses.
 |
Neuroimaging Findings
An ANCOVA with repeated measures was calculated with diagnoses of apathy and depression as between-group variables; brain lobes (frontal, temporal, parietal, and occipital) and hemisphere (right and left) as the repeated measures; age and MMSE scores as covariates; and the ratio of white matter hyperintensity volume to total intracranial volume as the dependent variable. There was a significant main effect for region (F=54.9, df=3, 222, p<0.0001): the brunt of white matter hyperintensities was located in the frontal white matter ( Figure 1 ). There was a significant apathy × region interaction (F=3.14, df=3, 222, p<0.05): patients with apathy had a larger white matter hyperintensity volume in the frontal lobes as compared to patients without apathy ( Figure 1 ). There also was a significant depression × region × side interaction (F=6.46, df=3, 222, p<0.001): patients with depression had a larger white matter hyperintensity volume in the right parietal lobe as compared to patients without depression ( Figure 2 ). Finally, there was a significant apathy × depression × region × side interaction (F=3.50, df=3, 222, p<0.05): patients with apathy and depression had a larger white matter hyperintensity volume in the right parietal lobe than the other groups ( Figure 2 ).
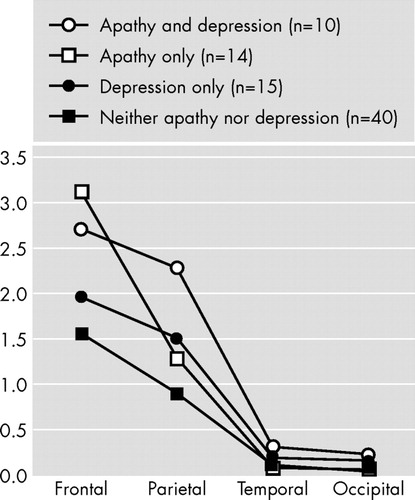
Alzheimer’s disease patients with apathy (with or without depression) had a significantly larger white matter hyperintensity to total intracranial volume ratio in the frontal lobes relative to Alzheimer’s disease patients without apathy (F=3.14, df=3, 222, p<0.05).

Alzheimer’s disease patients with apathy and depression had a significantly larger white matter hyperintensity to total intracranial volume ratio in the right parietal lobe as compared to the other three groups (F=3.50, df=3, 222, p<0.05).
Finally, ANCOVAs with repeated measures for gray matter and white matter volumes (apathy × depression × region × side) showed no significant main effects or interactions for apathy or depression ( Table 1 ).
DISCUSSION
We examined the association between apathy, depression, and brain structural findings in a consecutive series of patients with Alzheimer’s disease and no focal brain lesions, and there were several important findings. First, apathy was significantly associated with a larger white matter hyperintensity volume in the frontal lobes. Second, depression was significantly associated with a larger white matter hyperintensity volume in the right parietal lobe. Finally, there were no significant associations between apathy or depression and gray matter or white matter lobar volumes.
Before further comments, several limitations of our study should be pointed out. First, temporal and occipital white matter hyperintensity volumes were small, and our study may be underpowered to detect significant between-group differences on these structures. Second, while the difference was not statistically significant, nondepressed patients had a higher intake of anxiolytics than depressed patients. Depression was clearly undertreated in our patients, which is congruent with findings from other groups. 19 Third, our brain segmentation method was based on Talairach’s voxels and was restricted to gray matter, white matter, and white matter hyperintensities volumes in brain lobes. A study by Apostolova et al. 20 demonstrated significant correlations between increased apathy scores and decreased gray matter volume in the bilateral anterior cingulate and left mesial frontal cortex. Future studies may use lobar segmentation and recently developed techniques (e.g., diffusion tensor imaging) to examine associations between behavioral disorders and hyperintensities in specific white matter tracts. 21 , 22 However, to our knowledge this is the first study to examine associations between specific brain structural changes and both apathy and depression in dementia using a semiautomatic and fully quantified method, and to use standardized clinical diagnoses for both apathy and depression. In a recent study, Staekenborg et al. 23 found no association between white matter hyperintensities and behavioral and psychological symptoms in a series of 111 patients with Alzheimer’s disease. The degree of white matter hyperintensity severity was rated visually, and most patients had no or mild psychiatric symptoms. The authors suggested using quantitative techniques to measure white matter hyperintensities and to examine the association between regional white matter hyperintensities and specific psychiatric disorders.
Whereas apathy is one of the most frequent and severe behavioral changes in Alzheimer’s disease, the concept of apathy (i.e., whether apathy is a symptom or a syndrome) is still not clear, and this condition has been diagnosed using different strategies. We recently validated Marin’s 24 conceptual construct of apathy into standardized criteria. 16 We used this diagnostic scheme in a study that included 319 patients with Alzheimer’s disease and found apathy to be significantly associated with relatively more severe impairments in activities of daily living and cognitive functions, older age, and poor awareness of behavioral and cognitive changes relative to patients without apathy. The present finding of a significant association between apathy and a larger frontal white matter hyperintensities volume provides further validation to our diagnostic criteria.
We now question the putative role of frontal white matter hyperintensities in the mechanism of apathy. Pathological studies demonstrated that white matter hyperintensities are related to different severity of myelin degradation, loss of axons and oligodendroglia, gliosis, disruption of the ependymal lining, and/or infarction. 25 – 27 Recent studies suggest that white matter hyperintensities are associated with reduced blood perfusion in brain areas without white matter hyperintensities such as the basal ganglia and thalamus. 28 – 31 Cummings 32 suggested that apathy in dementia results from damage to a frontal-subcortical circuit that normally mediates complex cognitive functions and motivation. Our findings provide support to Cummings’ hypothesis and suggest that frontal white matter hyperintensities could produce apathy by disrupting deep white matter afferents and efferents to the basal ganglia and/or by decreasing metabolic activity in frontal subcortical regions.
Among nondemented individuals, increased white matter hyperintensity severity was associated with new onset and a more chronic course of depression and poor response to antidepressant medication. 33 , 34 Several studies reported a significant association between greater white matter hyperintensities in frontal brain regions and depression. 34 In this study we found that patients with depression had a significantly larger white matter hyperintensity volume in the right parietal lobe than patients without depression, and no significant association was found between depression and frontal white matter hyperintensities. In a study that examined quantified electroencephalographic (qEEG) correlates of depression in Alzheimer’s disease, we found a significant association between depression and increased theta power in posterior brain areas. 9 In a subsequent study we compared 17 Alzheimer’s disease patients with comorbid depression with 13 age-matched individuals with depression, but no dementia and 10 age-matched healthy comparison subjects. 10 While depression (with or without Alzheimer’s disease) was significantly associated with lower alpha relative power, among Alzheimer’s disease patients this change was restricted to posterior brain areas. Furthermore, Alzheimer’s disease patients with depression also showed significant increases in delta power in posterior brain areas as compared to depressed individuals without dementia. Using 99mTcHMPAO SPECT, we compared 10 Alzheimer’s disease patients with major depression with 21 Alzheimer’s disease nondepressed patients. The main finding was that patients with major depression had significant hypoperfusion in temporoparietal regions as compared to the nondepressed group. 8 Among 93 patients with a right hemisphere stroke, we found a significant association between depression and right parietal damage. 35 Future studies should compare the severity and location of white matter hyperintensities in comparable samples of demented and nondemented individuals with depression.
In conclusion, we found a significant association between white matter hyperintensities and behavioral disorders in patients with Alzheimer’s disease. Whereas apathy was significantly associated with larger white matter hyperintensities in the frontal lobes, depression was associated with larger right parietal white matter hyperintensities. On the other hand, neither gray nor white matter atrophy was associated with apathy or depression. Future studies may use more sophisticated neuroimaging techniques to further examine the association between pathological white matter changes and the behavioral disorders of dementia.
1. Boyle PA, Malloy PF, Salloway S, et al: Executive dysfunction and apathy predict functional impairment in Alzheimer disease. Am J Geriatric Psychiatry 2003; 11:214–221Google Scholar
2. Landes AM, Sperry SD, Strauss ME, et al: Apathy in Alzheimer’s disease. J Am Geriatr Soc 2001; 49:1700–1707Google Scholar
3. Starkstein SE, Sabe L, Vazquez S, et al: Neuropsychological, psychiatric, and cerebral perfusion correlates of leukoaraiosis in Alzheimer’s disease. J Neurol Neurosurg Psychiatry 1997; 63:66–73Google Scholar
4. Craig AH, Cummings JL, Fairbanks L, et al: Cerebral blood flow correlates of apathy in Alzheimer disease. Arch Neurol 1996; 53:1116–1120Google Scholar
5. Ott BR, Noto RB, Fogel BS: Apathy and loss of insight in Alzheimer’s disease: a SPECT imaging study. J Neuropsychiatry Clin Neurosci 1996; 8:41–46Google Scholar
6. Benoit M, Dygai I, Migneco O, et al: Behavioral and psychological symptoms in Alzheimer’s disease: relation between apathy and regional cerebral perfusion. Dement Geriatr Cogn Disord 1999; 10:511–517Google Scholar
7. Migneco O, Benoit M, Koulibaly PM, et al: Perfusion brain SPECT and statistical parametric mapping analysis indicate that apathy is a cingulate syndrome: a study in Alzheimer’s disease and nondemented patients. Neuroimage 2001; 13:896–902Google Scholar
8. Starkstein SE, Vazquez S, Migliorelli R, et al: A SPECT study of depression in Alzheimer’s disease. Neuropsychiatry Neuropsychol Behav Neurol 1995; 8:38–43Google Scholar
9. Pozzi D, Golimstock A, Migliorelli R, et al: Quantified electroencephalographic correlates of depression in Alzheimer’s disease. Biol Psychiatry 1993; 34:386–391Google Scholar
10. Pozzi D, Golimstock A, Petracchi M, et al: Quantified electroencephalographic changes in depressed patients with and without dementia. Biol Psychiatry 1995; 38:677–683Google Scholar
11. McKhann G, Drachman D, Folstein M, et al: Clinical diagnosis of Alzheimer’s disease: report of the NINCDS-ADRDA work group under the auspices of department of health and human services task force on Alzheimer’s disease. Neurology 1984; 34:939–944Google Scholar
12. Spitzer RL, Williams JB, Gibbon M, et al: The structured clinical interview for DSM-III-R (SCID), I: history, rationale, and description. Arch Gen Psychiatry 1992; 49:624–629Google Scholar
13. Folstein MF, Folstein SE, McHugh PR: “Mini-Mental State”: a practical method for grading the cognitive state of patients for the clinician. J Psychiatr Res 1975; 12:189–198Google Scholar
14. Hamilton M: A rating scale for depression. J Neurol Neurosurg Psychiatry 1960; 23:56–62Google Scholar
15. Starkstein SE, Migliorelli R, Manes F, et al: The prevalence and clinical correlates of apathy and irritability in Alzheimer’s disease. Eur J Neurol 1995; 2:540–546Google Scholar
16. Starkstein SE, Petracca G, Chemerinski E, et al: Syndromic validity of apathy in Alzheimer’s disease. Am J Psychiatry 2001; 158:872–877Google Scholar
17. Andreasen NC, Rajarethinam R, Cizadlo T, et al: Automatic atlas-based volume estimation of human brain regions from MR images. J Comput Assist Tomogr 1996; 20:98–106Google Scholar
18. Capizzano AA, Acion L, Bekinschtein T, et al: White matter hyperintensities are significantly associated with cortical atrophy in Alzheimer’s disease. J Neurol Neurosurg Psychiatry 2004; 75:822–827Google Scholar
19. Kales HC, Chen P, Blow FC, et al: Rates of clinical depression diagnosis, functional impairment, and nursing home placement in coexisting dementia and depression. Am J Geriatric Psychiatry 2005; 13:441–449Google Scholar
20. Apostolova LG, Akopyan GG, Partiali N, et al: Structural correlates of apathy in Alzheimer’s disease. Dement Geriatr Cogn Disord 2007; 24:91–97Google Scholar
21. O’Sullivan M, Summers PE, Jones DK, et al: Normal-appearing white matter in ischemic leukoaraiosis: a diffusion tensor MRI study. Neurology 2001; 57:2307–2310Google Scholar
22. Taylor WD, Payne ME, Krishnan KR, et al: Evidence of white matter tract disruption in MRI hyperintensities. Biol Psychiatry 2001; 50:179–183Google Scholar
23. Staekenborg SS, Gillissen F, Romkes R, et al: Behavioral and psychological symptoms are not related to white matter hyperintensities and medial temporal lobe atrophy in Alzheimer’s disease. Int J Geriatr Psychiatry 2008; 23:387–392Google Scholar
24. Marin RS: Apathy: a neuropsychiatric syndrome. J Neuropsychiatry Clin Neurosci 1991; 3:243–254Google Scholar
25. Thomas AJ, O’Brien JT, Davis S, et al: Ischemic basis for deep white matter hyperintensities in major depression: a neuropathological study. Arch Gen Psychiatry 2002; 59:785–792Google Scholar
26. Mezzapesa DM, Rocca MA, Pagani E, et al: Evidence of subtle gray-matter pathologic changes in healthy elderly individuals with nonspecific white-matter hyperintensities. Arch Neurol 2003; 60:1109–1112Google Scholar
27. Fazekas F, Kleinert R, Offenbacher H, et al: Pathologic correlates of incidental MRI white matter signal hyperintensities. Neurology 1993; 43:1683–1689Google Scholar
28. Oda K, Okubo Y, Ishida R, et al: Regional cerebral blood flow in depressed patients with white matter magnetic resonance hyperintensity. Biol Psychiatry 2003; 53:150–156Google Scholar
29. Markus HS, Lythgoe DJ, Ostegaard L, et al: Reduced cerebral blood flow in white matter in ischaemic leukoaraiosis demonstrated using quantitative exogenous contrast based perfusion MRI. J Neurol Neurosurg Psychiatry 2000; 69:48–53Google Scholar
30. Brown WR, Moody DM, Thore CR, et al: Cerebrovascular pathology in Alzheimer’s disease and leukoaraiosis. Ann N Y Acad Sci 2000; 903:39–45Google Scholar
31. Udaka F, Sawada H, Kameyama M: White matter lesions and dementia: MRI-pathological correlation. Ann N Y Acad Sci 2002; 977:411–415Google Scholar
32. Cummings JL: Frontal-subcortical circuits and human behavior. Arch Neurol 1993; 50:873–880Google Scholar
33. Tupler LA, Krishnan KR, McDonald WM, et al: Anatomic location and laterality of MRI signal hyperintensities in late-life depression. J Psychosom Res 2002; 53:665–676Google Scholar
34. Nebes RD, Reynolds CF III, Boada F, et al: Longitudinal increase in the volume of white matter hyperintensities in late-onset depression. Int J Geriatr Psychiatry 2002; 17:526–530Google Scholar
35. Starkstein SE, Robinson RG, Honig MA, et al: Mood changes after right-hemisphere lesions. Br J Psychiatry 1989; 155:79–85Google Scholar