A Continuous Clustering Algorithm for Detection of Local Sleep in Humans
Abstract
Objective:
Research in animal models has shown that many EEG sleep features reflect local conditions, which is a consequence of relative inactivity of neuronal clusters. In humans, the authors previously reported that focal sleep patterns appear on the cortex during the wake state and suggested that this underlies the condition described as drowsiness. The focal changes at individual electrodes appeared as a combination of increased instantaneous amplitude in the delta band and decreased instantaneous frequency in the theta-alpha band during non-REM sleep, with the opposite occurring during the wake state, permitting their categorization as “active” and “inactive.” A limitation of the previous work was the use of a binary k-means clustering algorithm, which created the possibility that the findings were biased toward a predominantly inactive state while the study subject was still awake. The present study tested the hypothesis that analyzing the same data by using a continuous rather than binary classifier would overcome this limitation.
Methods:
An analysis was performed on records from six patients with refractory epilepsy who were undergoing video-electrocorticographic monitoring with implanted subdural grid electrodes. A fuzzy c-means clustering algorithm was utilized after feature extraction from the recordings to create state classifications for each moment in each recording. A subsequent analysis was performed to determine the relative contributions of instantaneous amplitude versus instantaneous frequency to the classification.
Results:
Localized state changes consistent with the hypothesis were observed. The contributions from instantaneous frequency and amplitude appeared roughly equal.
Conclusions:
This study reveals evidence of local sleep during the wake state in humans.
The likelihood that a certain cortical column enters into a sleep-like state is essentially related to the degree of previous activity (1–3). Therefore, the sleep-like states are distributed spatially in a patchwork structure. Localized sleep-like states can be observed when the study subject is awake (4–6), while localized wake-like states can be observed when the study subject is sleep (1).
In a recent study, we presented evidence based on intracranial subdural grid recordings supporting the concept of local sleep while awake occurring in humans, and we postulated that this underlies the condition commonly described as drowsiness (7). At each moment in time, the electrical activity over each subdural grid electrode was classified as either “active” or “inactive.” The method for determining whether activity at a given subdural electrode was in the active or inactive state relied on the dual observations of an increase in the instantaneous amplitude of the delta band (δA), with a decreased instantaneous frequency in the combined theta-alpha band (θαF), while the study subject was in non-REM (NREM) sleep. The classifier utilized a k-means clustering algorithm that produced the binary outputs (either active or inactive).
One potential flaw in this approach lies in the use of the k-means algorithm. Forcing a binary classification might result in the appearance of a progression toward an increasing number of electrodes with activity appearing consistent with sleep while the study subject is still awake, while the truth might be that the actual underlying values have only shifted slightly on average, moving from one edge of the classifier to the other. A classifier that produces a continuous range of results rather than a binary classification would address this possibility. Accordingly, we have reanalyzed the human electrocorticography (ECoG) data using a fuzzy c-means (FCM) clustering algorithm (8). FCM clustering results in a continuous series of values rather than pure binary classifications, eliminating the potential biases created by the latter method.
One additional benefit to the use of FCM clustering is that it allows for the comparison of the relative contribution of each of the two variables (instantaneous θαF and instantaneous δA) to the overall state classification. While an increase in delta-band spectral power has been demonstrated to be a strong signature of the sleep state, we hypothesized that the instantaneous θαF might serve as a similar signature of the waking state, and the analysis of the individual contributions to the classification could test this proposition.
Methods
Details of the study subjects and the method of ECoG acquisition, along with a very detailed description of the instantaneous amplitude and frequency computation through Hilbert transform, is published elsewhere (7). Briefly, recordings were obtained from adult (age >17 years) patients with medically refractory epilepsy who were undergoing intracranial monitoring before resective epilepsy surgery. We used 12 short recordings (1–1.5 hours) from six study subjects, with six recordings having only the wake state and six recordings having both the wake and sleep states. We also used six long recordings of 24 hours each from four study subjects. Recording days during which seizures occurred were excluded from the analysis. A human observer reviewed the video portion of each sample to identify a 1-hour section during the day when the patient was behaviorally clearly awake (morning circadian peak) and 1 hour at night after sleep onset in which the patient was clearly asleep and remained asleep. The sleep samples were chosen at time points before 80 minutes after sleep onset in an effort to limit the recordings to periods of NREM sleep. When available, concurrent scalp EEG recordings were also reviewed for consistency with NREM sleep. These 1-hour samples served as the baseline exemplar recordings (individual to each patient), from which the salient features associated with the sleep and wake states were derived.
Computation of the Instantaneous Amplitude and Frequency
The instantaneous amplitude of a signal x(n) is the modulus of the analytical signal z(n)=x(n) + jHT[x(n)], where HT[.] is the Hilbert transform (9). The instantaneous frequency is the time derivative of the phase of analytical signal z(n), and it approximates the change with time of the signal x(n) frequency. First, we filtered the z-score of the raw ECoG signal in the delta band (0–4Hz) and theta-alpha band (4–12 Hz). Then, we computed the instantaneous amplitude in the δ band, denoted as δA, and the instantaneous frequency in the θα band, denoted as θαF, from the filtered signals. Finally, we used the median and moving average filtering to smooth and down sample both δA and θαF to 0.5 Hz. To process the 24-hour records, we down sampled δA and θαF to 1 Hz. We denoted as mA the average over all channels of the amplitude δA,  , where δAk is the amplitude of channel k, M is the number of channels, and n is the time moment. We denoted as mF the average over all channels of the frequency θαF,
  , where θαFk is the frequency of channel k.
Computation of the Channel Activity Score
For each ECoG channel, we determined the activity score by using the fuzzy c-means (FCM) clustering (8). In the FCM clustering technique, each data point (in our analysis, the pair δA(n), θαF(n), where n is the time moment) belongs to each cluster to some degree between 0 and 1, which is specified by a membership function. In our analysis, we had two clusters corresponding to the wake (active) and sleep (inactive) states. Thus, for each pair, δA(n), θαF(n), we obtained the degrees of belonging to the active and inactive clusters. These degrees were given by the membership function of the active cluster, MFA(n), and the membership function of the inactive cluster, MFI(n), with MFI(n)=1–MFA(n). We used the MFA as the activity score. All data points with an MFA >0.5 belong to the crisp active set, which is in fact the projection of MFA on the plane of instantaneous amplitude and frequency. Meanwhile, the data points with an MFA <0.5 belong to the crisp inactive set (Figure 1A and 1B). In the fuzzy sets theory, the regular sets, which have the membership function 0 or 1, are called crisp sets (10). For comparison purposes, we also computed the activity scores when only δA (Figure 2A) or θαF (Figure 2B) was used in the FCM clustering. We denoted as mAS the average over all channels of the activity score,  , where MFAk is the activity score of channel k, and n is the time moment (Figure 2C).
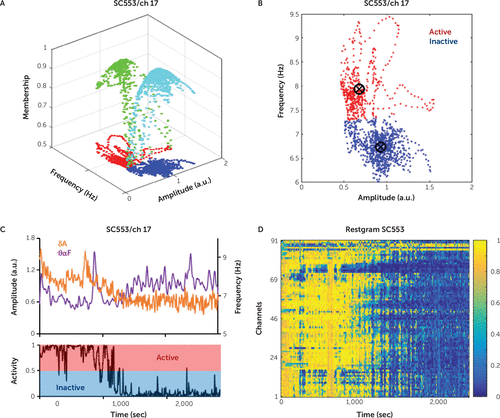
FIGURE 1. Estimation of channel activity for study subject SC553a
a Panel A shows the activity score, which is the membership function of the active (MFA) class (green). The membership function of the inactive (MFI) class (cyan) is equal to 1–MFA. If the MFA is >0.5 for a certain pair (amplitude, frequency), then the pair is considered to belong to the active crisp set (red); otherwise, the pair belongs to the inactive crisp set (blue). The active crisp set is the projection of the MFA on the (amplitude, frequency) plane, while the inactive crisp set is the projection of the MFI on the same plane. Panel B shows the active crisp set (red) and the inactive crisp set (blue) for channel 17 of the study subject. Panel C shows the delta amplitude (purple) and theta-alpha frequency (orange) for channel 17 of the study subject and the corresponding activity score obtained after fuzzy c-means clustering. Panel D shows the restgram results (a matrix with numbers between 0 and 1, which comprise the activity scores of all the channels) for the study subject. a.u.=arbitrary units, ch=channel, sec=seconds.
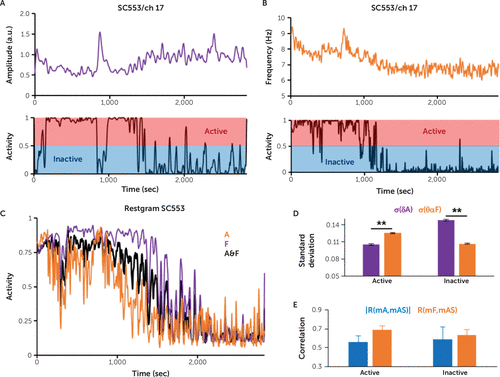
FIGURE 2. Comparison of feature efficiency in the computation of the activity score for study subject SC553a
a The charts show the activity score for channel (ch) 17 of the study subject, obtained after the fuzzy c-means clustering based only on the delta amplitude (δA) (panel A) or only on the theta-alpha frequency (θαF) (panel B). Panel C shows the average over all the channels for the activity score (mAS) when only the amplitude was used for clustering (A) (purple), when only the frequency was used for clustering (F) (orange), and when both the amplitude and frequency (A&F) were used for clustering (black). Panel D shows the grand average of the standard deviation for the average over all channels of the δA and average over all channels of the θαF computed for the global active (mAS >0.5) and inactive (mAS <0.5) periods (**p<0.001, rank sum test). Panel E shows the following: R(mA,mAS): modulus of mean correlation between mA (the average of δA over channels) and mAS (blue); R(mF,mAS): mean correlation between mF (the average θαF over channels) and mAS (orange). For both active and inactive cases, R(mF,mAS) was not significantly different than the modulus of R(mA,mAS) (t-paired test, p >0.05), suggesting that the θαF and the δA were equally important features for the prediction of the activity score. Error bars represent standard error of the mean. sec=seconds.
Probability of Correct Classification
We computed the probability of correct classification (pcc) of two distributions, X1 and X2, in two crisp (regular) sets as follows:

 was the average operator, Q was the pooled covariance of matrixes X1 and X2, and T was the transpose matrix operator (12). When we used only one feature for classification (e.g., amplitude or frequency), the discriminability dp was as follows:
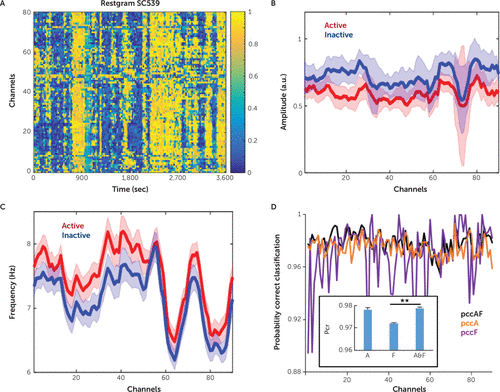
FIGURE 3. Separation of amplitude and frequency distributions for crisp active and inactive channel classes in study subject SC539a
a Panel A shows the restgram results for the study subject. Panels B and C show the mean values (continuous lines) and standard deviations (shadowed areas) of the amplitude and frequency distribution of each channel, computed for active (red) and inactive (blue) crisp sets. The active crisp set is formed by those (amplitude, frequency) pairs with a corresponding activity score >0.5. For the inactive crisp set, the activity score was <0.5. Panel D shows the probability of the correct classification (pcc) corresponding to the amplitude and frequency distributions on each channel when both amplitude and frequency (pccAF) (black) were used for clustering and when only the amplitude (pccA) (purple) and only the frequency (pccF) (orange) were used. For all study subjects, amplitude and frequency ensured better pcc (**p< 0.01, multi-comparison after analysis of variance with Bonferroni correction). a.u.=arbitrary units, sec=seconds.
Prediction of the Mean Activity Score
For each study subject, we computed the Pearson correlations between mAS (the average over all channels of the activity score), mA (the average over all channels of δA), and mF (the average over all channels of θαF) (Figure 4A). The existence of strong correlations between mAS, mA, and mF allowed us to predict successfully mAS as a function of mA and mF by using a linear regression model as follows:
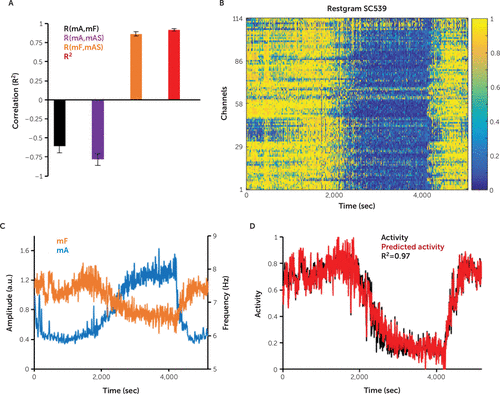
FIGURE 4. Prediction of the mean activity score by linear regression for study subject SC539a
a As shown in Panel A, strong correlations between the average over channels of the activity score (mAS) and the average over channels of the theta-alpha frequency (θαF), R(mF,mAS), as well as correlations between mAS and the average over channels of the delta amplitude (δA), mA and R(mA,mAS), allow the use of linear regression, on the basis of mF and mA, to predict the mean activity, mAS, with high R2 (red bar). Error bars represent standard error of the mean. Panel B shows the restgram results of the channels’ activity score for the study subject. Panel C shows the average over channels of the θαF, mF (orange), and the δA, mA (blue). Panel D shows the predicted activity (red) obtained after linear regression, on the basis of mF and mA, which approximates (R2=0.97) the average over channels of the activity score, mAS (black), obtained after fuzzy c-means clustering. Panels C and D both show the prediction of the mean activity score, mAS, for the study subject. a.u.=arbitrary units, sec=seconds.
Results
Computing the Channel Activity Score
Recently, our group (7) determined the active (wake) and inactive (sleep) states of channels by using the k-means clustering algorithm (14). For each channel, the k-means algorithm partitioned the amplitude-frequency pairs, δA(n), θαF(n), into two clusters (active and inactive) such that each data pair belonged to the cluster with the nearest mean. This binary classification did not provide insightful information about how much either active or inactive was the channel at a certain time point. However, this information could be essential, especially when the study subject is awake and performs a certain cognitive task. We addressed this limitation by using FCM clustering instead of k-means clustering. After applying FCM, for each channel data point, δA(n), θαF(n), the degree of belonging of the data point to the active and inactive class is computed. This degree of belonging, called membership function in the fuzzy sets theory (8), is a number between 0 and 1 and could serve as a measure of how close the data point is to the perfect active and inactive states. We used the MFA class as the activity score of a channel (Figure 1A). The MFI class was equal to 1–MFA (Figure 1A). All data points with an MFA >0.5 were included in the crisp (regular) active set (Figure 1A and 1B), while all data points with an MFI >0.5 were included in the crisp inactive set (Figure 1A and 1B). The active and inactive crisp sets were used to quantify the salience of the amplitude and frequency features for active and inactive state discrimination.
In conclusion, for each channel, after applying FCM, we obtained an activity score sequence, MFA(n), which measured in the continuous interval ([0, 1]) the degree of activity of each amplitude-frequency data pair (Figure 1C). By putting together the activity of all the channels, we obtained the study subjects’ restgram results, a matrix of numbers in the interval. The restgrams were used in this study to illustrate the degree of local sleep in the study subjects.
Comparing Frequency and Amplitude for Activity Classification
We computed the channel activity score by clustering only the channel amplitude (Figure 2A), or only the channel frequency (Figure 2B), and compared the obtained average activity scores (mAS) with the average score for clustering with both amplitude and frequency (Figure 2C). During the wake state, we observed that the amplitude and frequency clustering resulted in a lower activity score than amplitude clustering (Figure 2C) but a higher activity score than frequency clustering (Figure 2C). For a conservative estimate of the activity score during the wake state, the frequency would be the best feature. The amplitude would be a better feature for a conservative estimate of the channel activity during the inactive state.
By clustering both the amplitude and frequency, we computed their statistics for the active (mAS >0.5) and inactive (mAS <0.5) periods. During the active periods, the standard deviation of θαF was significantly higher than the standard deviation of δA. However, the opposite was true for the inactive periods (p<0.001, rank-sum test) (Figure 2D), suggesting that the frequency was the most salient feature for classification during active periods, while the amplitude was the most salient feature during inactive periods. We did not find a significant difference between the modulus of correlation between mA and mAS, R(mA,mAS), and the correlation between mF and mAS, R(mA,mAS), for either the active or inactive period (t-paired test, p>0.05) (Figure 2E), indicating that for the prediction of mean activity, mAS, the mA and mF were equally important predictors.
After FCM clustering, for every channel, a distribution corresponding to the features included in the crisp active set (MFA >0.5) and another distribution corresponding to the crisp inactive set (MFA <0.5) can be derived (Figure 1A and 1B). The mean and the standard deviation of the amplitudes and frequencies included in the active and inactive crisp sets, made for all of the channels of subject SC539, are shown in Figure 3. The separation of features in two crisp sets allowed us to compute the pcc in these sets. Importantly, the pcc offered a quantitative way of estimating the importance of amplitude and frequency in the computation of the activity score. For example, Figure 3 also shows the pcc computed from active and inactive distributions when we used both the amplitude and frequency for clustering as well as only the amplitude and only the frequency. For subject SC539, the pcc computed after frequency classification (pccF) was significantly better than the pcc computed after amplitude classification (pccA). However, this result did not hold for all study subjects, and in general we did not observe that the θαF (the feature introduced by our group previously [7]) was significantly a more salient feature than the δA. Yet interestingly enough, we did find that for all study subjects, the pcc computed from both the amplitude and the frequency (pccAF) (Figure 4), was always better or significantly better than the pccA or pccF (Figure 3).
Linear Regression Successfully Predicts the Mean Activity Score From the Mean Amplitude and Frequency
Similar to our previous analysis completed with a binary classification scheme (7), the present continuous classification scheme showed strong correlations between the mean instantaneous frequency mF and mean instantaneous amplitude mA, both with each other (Figure 4) and between each separately and the mean activity score (Figure 4A). Considering these results, we predicted the mean activity score mAS with a linear regression scheme using as predictors the mA and mF (Figure 4). For all records, we obtained a good prediction performance of the mean activity score mAS (average coefficient of determination, R2=0.91) (Figure 4A). This demonstrates that after the regression coefficients for a study subject were determined, the iterative FCM classification process could be successfully replaced by the much-simple computations of linear regression, without affecting the accuracy of the mean activity score.
Performing the fuzzy clustering of the amplitude and frequency for 24-hour records, we observed that the mean frequency mF had large variations during the wake periods, while the mean amplitude mA had large variations during the sleep period (Figure 5A and 5B). This finding underscores again that the frequency carries more information than the amplitude during the wake periods, while the amplitude is more indicative during the sleep periods (Figure 2D). In addition, we observed strong correlations between mAS and mF, between mAS and mA, and between mF and mA (e.g., –0.89 in Figure 5B). These strong correlations allowed us to predict successfully (R2=0.94) (Figure 5C) the mean activity mAS (Figure 5C) from mA and mF, extending to 24-hour records the prediction results for short records of 1–2 hours.
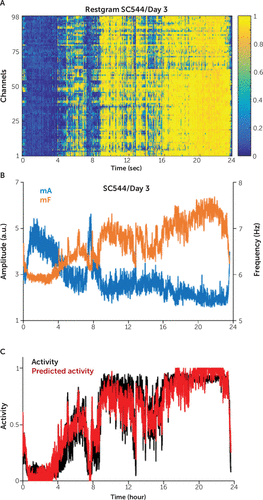
FIGURE 5. Computation of the activity score for 24-hour records for study subject SC544a
a Panel A shows the restgram results for the study subject for the day 3 recording. Panel B shows the average over the channels of the delta amplitude (δA), denoted as mA (blue), and the average over the channels of the theta-alpha frequency (θαF), denoted as mF (orange). Panels B and C both show the prediction of the mean activity score (mAS) for the study subject during the day 3 recording. The frequency mF had large variations during the wake periods, while the amplitude mA had large variations during the sleep periods. As shown in Panel C, strong correlations between mAS and mF, between mAS and mA, as well as between mF and mA (e.g., –0.89) allowed the use of linear regression prediction (red) on the basis of mF and mA, in order to successively predict (R2=0.94) the mean activity mAS (black) obtained after the fuzzy clustering of the 24-hour record. a.u.=arbitrary units.
Discussion
By substituting a continuous FCM clustering for the binary k-means classifier, we addressed the potential bias of binary classification, and the findings of our previous study still hold (7). Utilizing a continuous score for estimating the active state of a channel has the important advantage of increasing the accuracy in determining the drowsiness of the study subject. In our previous work, the drowsiness was measured as the fraction of inactive channels during the wake state. This drowsiness measure is acceptable when the number of channels is large (as in ECoG recordings) but less acceptable when the number of channels is reduced (as in the EEG recordings). Thus, for a small number of electrodes, a continuous score for the electrodes’ state is preferable to a binary score.
As an extension of our previous work, we proposed in the present study a method to quantify the importance of features (amplitude and frequency) for classification in two crisp sets (the active and inactive sets obtained after the FCM clustering). This method, based on computing pcc in the two sets, proved numerically that using together the amplitude and frequency for FCM clustering allowed us to obtain a higher pcc than by using only amplitude or only frequency. In addition, using only amplitude or frequency did not ensure significantly different pccs, indicating that amplitude and frequency were equally salient for FCM clustering. Importantly, the pccs computed for single features had high values, suggesting that even when using only one feature for classification it is possible to achieve an acceptable separability of the active and inactive sets. The fact that the instantaneous frequency and amplitude contribute equally to the classification value suggests that hypotheses attempting to explain the changes occurring in brain electrical activity with increasing time during the wake state must take both into account. The conclusion from our previous work—that the study “provides additional support for the concept of local sleep while awake, the first based on intracranial subdural grid recordings in humans”—remains intact (7).
Another essential, practical advantage offered by using the continuous activity scores is the direct connection that can be made between the mF or mA and the mAS. As a result of the high correlations between mF and mAS, as well as between mA and mAS, one could predict mAS by using only one predictor (mF or mA), and, consequently, the direct computations of mF or mA during the wake state could provide an estimate of the drowsiness of the study subject. This possibility raises the very important question, What feature (amplitude or frequency) is the best to estimate the drowsiness? We found that the frequency shows more variability than the amplitude during the active periods (mAS >0.5) and, consequently, could offer a more sensitive measure of drowsiness. Our previous work demonstrated a link between specific frequency in the alpha band and the variability of reaction time during an attention task, a study that was inspired by the clinical observation of slowing of the background alpha frequency accompanying drowsiness in routine EEGs (15). The present study is consistent with, and further expands upon, this finding. Given this perspective, future experimental studies relating the instantaneous θα frequency to the study subject’s performance on cognitive tasks will be instrumental in finding a suitable measure of drowsiness.
Conclusions
The detection of local sleep, based on fuzzy clustering, offers not only a continuous estimate of the sleep-like states during whole wake or wake-like states during whole sleep, but it also allows for direct connection between drowsiness and measurable characteristics of the ECoG signal, such as instantaneous frequency or amplitude, in certain EEG bands. This continuous approach could be instrumental in computing the drowsiness score for records with a small number of electrodes, such as those from the scalp.
1 : Local functional state differences between rat cortical columns. Brain Res 2005; 1047:45–55Crossref, Medline, Google Scholar
2 : Sleep as a fundamental property of neuronal assemblies. Nat Rev Neurosci 2008; 9:910–919Crossref, Medline, Google Scholar
3 : Physiological markers of local sleep. Eur J Neurosci 2009; 29:1771–1778Crossref, Medline, Google Scholar
4 : Evidence for asynchronous development of sleep in cortical areas. Neuroreport 1997; 8:2557–2560Crossref, Medline, Google Scholar
5 : Spatiotemporal analysis of local field potentials and unit discharges in cat cerebral cortex during natural wake and sleep states. J Neurosci 1999; 19:4595–4608Crossref, Medline, Google Scholar
6 : Local sleep in awake rats. Nature 2011; 472:443–447Crossref, Medline, Google Scholar
7 : Focal changes to human electrocorticography with drowsiness: a novel measure of local sleep. J Neuropsychiatry Clin Neurosci 2017; 29:236–247Link, Google Scholar
8 : Pattern Recognition with Fuzzy Objective Function Algorithms. Advanced Applications in Pattern Recognition. Edited by Nadler M. New York, Springer, 1981Crossref, Google Scholar
9 : Discrete-Time Signal Processing, 2nd ed. Upper Saddle River, NJ, Prentice Hall. 1999Google Scholar
10 : Fuzzy sets. Inf Control 1965; 8:338–353Crossref, Google Scholar
11 : Theoretical Neuroscience: Computational and Mathematical Modeling of Neural Systems. Cambridge, Mass, Massachusetts Institute of Technology, 2001Google Scholar
12 : Effects of noise correlations on information encoding and decoding. J Neurophysiol 2006; 95:3633–3644Crossref, Medline, Google Scholar
13 : Principles and procedures of statistics: with special reference to the biological sciences. New York, McGraw-Hill, 1960Google Scholar
14 : Least squares quantization in PCM. IEEE Trans Inf Theory 1982; 28:129–137Crossref, Google Scholar
15 Slater JD, Velur P, Gharbaoui Y, et al: Correlation of waking background alpha frequency with measures of attention, in the Proceedings of the 68th Annual Meeting of the Society of Biological Psychiatry, San Francisco, 2013Google Scholar


