Investigating Emergent Symptomatology as an Outcome Measure in a Behavioral Study of Alzheimer's Disease
Abstract
These retrospective analyses represent a pilot study of a potential new outcome, expected emergence. The Behavior Rating Scale for Dementia (BRSD) was administered at the baseline and 12-month visits of a multicenter study. The authors computed the rates at which each BRSD symptom emerged over 12 months in normal elderly control subjects (n=64). These normal rates were then applied as the expected emergent rate (EER) to a population of individuals with Alzheimer's disease (n=235). The comparison of expected emergence to observed emergence in Alzheimer's disease showed interpretable differences. EER assesses whether treatments limit emergence in the target, relative to the standard, population. The ratio of expected to observed emergence provides an intuitively appealing quantification of treatment efficacy and can be used with any instrument that uses categorical or frequency ratings.
Assessment in both experimental and clinical settings proceeds from the premise that the result of any intervention will be a change, which is measurable in some way, from the patient's initial state.1,2 The net change in a patient's status can be difficult to measure. This is especially true when the assessment instrument generates a total score, even though “net change” implies change in overall status. As Lezak3 points out, because a global or total score is some mathematical function of a set of individual items, it is at least one step removed from what the instrument is meant to assess. It follows that changes in total scores will also be removed from these items. When the items make up an instrument designed to capture multiple dimensions of a disorder, the relationship of the change in total score to the actual changes in status becomes even more abstract.
Lezak3 also notes that neuropsychological assessments are typically “not undertaken for diagnostic purposes but to describe the patient's neuropsychological status” (p.146). This is clearly the case in many clinical trials, where subjects are assessed at the start and end of the study, not for diagnosis but for detection of any changes in status. In both the research and applied domains, the outcome of an intervention can be obscured by the use of total or aggregate scores for assessment. In clinical practice, a patient might be diagnosed with a disorder that a treatment is not intended to “cure”; rather, the intention is to alleviate symptoms of that disorder. Examples include Alzheimer's disease and Parkinson's disease.
It is often important to measure change over time in geriatric patients. In many cases, especially in the neuropsychological context, the assessment of change can be challenging. In fact, changes in any disorder that manifests a variety of symptoms can be hard to quantify, as some symptoms may abate while new ones emerge over the course of the illness.
Our earlier work in identifying change that is “clinically meaningful” discussed emergence, abatement, and various other types of change that could be observed longitudinally at the item level.1 Here we focus on one type of change, emergence. We examined emergence as observed in items contained in the Behavior Rating Scale for Dementia (BRSD).4 This instrument was designed to measure the frequencies of 45 behavioral symptoms in several domains, including psychosis, depression, and agitation/aggression, and it has established validity.4,5 When a symptom is rated by the caregiver or a knowledgeable informant as absent or only minimally frequent at the baseline visit, and is rated at a higher frequency at a later visit, then the symptom is said to have emerged over that period.1 Because the BRSD items are framed only in terms of the preceding month, distinctions between true emergence and reemergence are not made. As Lezak3 suggested, the BRSD is not used as a diagnostic tool, but rather to assess the patient's behavioral status.
The present study explored the concept of the rate of emergent behavior as an outcome measure for use in both the research and clinical settings. The emphasis of this paper is this outcome measure itself, rather than the population and the instrument with which it was tested. We sought to determine whether or not emergence is a more sensitive indicator of change than the simple difference between scores over time. As an example of the utility of the approach, we reexamine published comparisons of changes on the BRSD over a 12-month study in normal elderly control subjects (NEC) and Alzheimer's disease patients (AD).6 In the original analyses of change in Total BRSD score over 12 months in these two groups, Patterson et al.6 reported that “relatively little change was observed…over that time interval.” (p. S43), and that “the actual change was not of great clinical significance” (p. S44). These authors pointed out that analysis of the Total BRSD score (and changes in it over time) can obscure differences in the subdomains of psychopathology described by this instrument.
Emergence, and the method described here, can be applied to different populations and different instruments with categorical ratings. Here we calculated the rates of emergence over 12 months for each of 45 BRSD items for the reference population, NEC. The rate of emergence for an item in these normal elderly control subjects was used as an estimate of the rate of emergence to be expected over 12 months, the expected emergence rate (EER). We then used the EER for each item to calculate, based on the number of persons with AD in whom that item was not already present, the expected number of AD individuals in whom the item would emerge (“expected” if the rate of emergence in NEC was also in effect for the AD group).
Since the average change in Total BRSD scores for these two groups over 12 months was about ±1.5 points,6 we sought to demonstrate the value of EER as an outcome measure by using it to differentiate between the rates of emergence for NEC and AD. Thus, we hypothesized that despite the lack of a significant difference between the changes in Total BRSD scores for these groups (assumed from the report by Patterson et al.6 and confirmed below), EER for each item would allow clinically meaningful interpretation of differences between NEC and AD.
METHODS
In these retrospective analyses, we derived two values from the calculation of emergence and EER. First, we were able to estimate the “true” proportion of each of the populations (AD and NEC) in which BRSD symptoms tended to emerge over the 12-month period. The proportions were then compared by a statistical test (described below) to determine whether or not the rate of emergence per item in NEC was the same as that for AD. The second use of the item-by-item estimates of emergence was to take the sum of all expected values for AD (based on the NEC-based rates of emergence) and compare it with the sum of the observed numbers of emerged values for the AD. This ratio (Expected/Observed) provides a description of the relative rates; that is, one will be some percentage greater than the other.
Subjects
These populations have been described elsewhere.7 Normal subjects (NEC) were 64 community-dwelling individuals with a knowledgeable informant. Their mean age (±SD) was 70.3±8.8 years, educational level was 13.8±2.9 years, Mini-Mental State Examination (MMSE)8 score was 29.3±1.3 at baseline, Total BRSD score at baseline was 4.7±8.3, and 62.5% were women. Patients (AD) were 235 community-dwelling individuals with NINCDS-ADRDA–based diagnosis of probable AD.9 Patient-subjects were required to have a responsible caregiver and to discontinue all psychoactive medication for 4 weeks prior to the baseline visit, except for patients with MMSE <10 (n=11), for whom the protocol specified that continuation on drug was permitted. AD subjects' mean age was 72.3±9.0 years, educational level was 13.2±2.9 years, MMSE score at baseline was 12.8±7.9, Total BRSD score at baseline was 30.0±20.2, and 61.0% were women. These subjects were recruited to participate in a year-long, multicenter study of instruments to be used in clinical studies of persons with AD, which was carried out by the Alzheimer's Disease Cooperative Study.10 Informed consent was obtained for all participants (from caregivers for AD patients).
Materials
The BRSD was administered by a clinician or technician to a caregiver or informant as a 48-item instrument and was recoded according to current scoring rules.11 Caregivers and informants were required either to be living with the subject or to have at least 6 to 8 hours of contact with the subject over more than one day per week.7
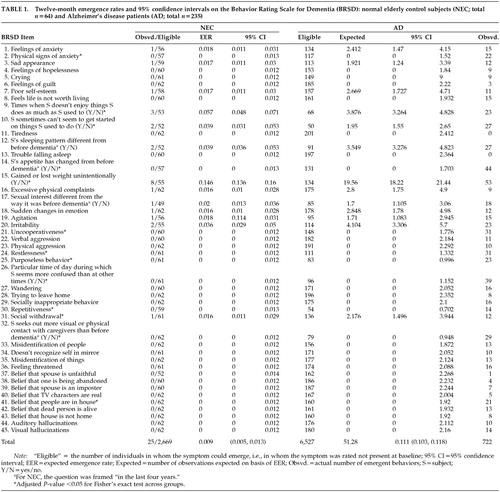
The 1996 scoring algorithm contains 46 items, one of which (item 46) is nonspecific and asks about “other” behaviors. This analysis focused on the specific-symptom items 1–45. Items describing behavioral symptoms that are rated for frequency in the preceding month are classified by the caregiver or informant as having occurred “not in the past month” (rated 0), 1–2 days (rated 1), 3–8 days (rated 2), 9–15 days (rated 3), or 16 or more days (rated 4). A subset of items (9, 10, 12, 14, 15, 17, 26, and 32) do not have frequency ratings but are rated as present or absent with respect to “before dementia” (for normal subjects, this frame is “within the past four years”), or “as much as (subject) used to.” For the purpose of including these nine items in our analysis, change scores of –1 (rated 0 at baseline and rated 1 at 12 months) were classified as “emergent.” Item 46 was excluded from our analyses. The BRSD items are listed in Table 1.
Statistical Methods
Change Scores:
Change scores were computed for each item, as well as for Total BRSD score, over 12 months, as score at baseline visit minus score at later visit: BL−12M. Change scores, per item, were then classified (see also Tractenberg et al.1) as follows:
absent: 0 or 1 at baseline and also at 2nd visit (change score =0).
waned: >1 at baseline and lower, but still >1, at 2nd visit.
abated: >1 at baseline and =1 at 2nd visit.
ceased: >1 at baseline and =0 at 2nd visit.
emergent: 0 or 1 at baseline and >1 at 2nd visit.
persistent: >1 at both baseline and 2nd visit (change score = 0).
intensified: >1 at baseline and higher at 2nd visit.
Although we were interested only in “Emergent” items for the EER, any change score coded as “Absent” or “Emergent” was considered not to have been present at baseline. The numbers of individuals in these categories were summed per item to derive “eligible” groups for the EER calculations.
Descriptive Statistics:
For each item, we tabulated the proportion of the NEC group for which it was emergent, along with 95% confidence intervals for this estimate based on the binomial distribution. This proportion was our estimate of the expected emergence rate. Expected and Observed values for emergence in AD were also tabulated, along with 95% confidence intervals of these estimates. The total number of NEC and AD individuals in whom emergence was possible, the total number of observed emergent items, and overall estimates (and 95% confidence intervals of these estimates) of emergence were calculated for NEC and AD. Means and standard deviations for the change in Total BRSD scores were also calculated for each group.
Emergence Rates:
Change scores in NEC for each item were recoded, and proportions of emergent items (i.e., item was not already present at baseline) over the interval baseline–12 months were tabulated. For example, Item 1 emerged in 1 NEC and was rated absent at baseline in 56 of the 64 NEC; therefore, the EER for this item was 1/56=0.018. (The response for item 1 could have been missing, or could have changed in another way, for the remaining 8/64 NEC.) The 95% confidence intervals for the binomial proportions (emerged, did not emerge) were constructed for the NEC-based EER for each item; for Item 1, the interval was (0.011, 0.031).
Change scores in AD, for each item, were recoded in the same way, and numbers of emergent items (items not already present at baseline) over the interval baseline–12 months were tabulated as “observed.” The EER was applied to the number of AD for whom the item was rated absent at baseline (134 for Item 1). Thus, our estimate of the expected emergence for Item 1 was 0.018×134=2.41, so that we would expect that Item 1 would emerge in 2.4 AD patients if the EER was applicable. The 95% confidence interval for emergence on Item 1 (0.011, 0.031) indicates that the range of “expected” emergence for item 1 was 1.47 to 4.15, so observing emergence in between 2 and 5 out of 134 AD patients over 12 months would not be considered excessive. (This is not a statistical inference, but rather a purely descriptive application of this approach.)
Statistical Analyses
Patterson et al.6 had compared the average change for the full AD sample (n=242) and NEC (n=64) to zero, rather than comparing the calculated change in Total BRSD scores across these two groups. Therefore, independent-sample t-tests, prefaced by Levene's test to determine equality of variances, were carried out. This approach was also used to compare the Total BRSD scores at baseline for the two groups. Significance for these tests was set at P<0.05.
On the basis of observed changes in AD, the number of individuals in whom each behavior was not already present at baseline was computed. The product of the NEC-based EER and the number of eligible AD individuals was computed, representing “expected” values for emergence in AD. The sum of all expected values was compared with the sum of all observed values for AD in the ratio Expected/Observed. This ratio gives the relative percentages of emergence.
Hypotheses about the difference in overall estimated emergence rates across the two groups were tested by using permutation methods.12 We conducted Fisher's exact tests to assess whether emergence rates were significantly different for NEC and AD for each item. The computed (two-tailed) P-values were subjected to Holm adjustment13 to account for the multiple (45) comparisons. For any item with an adjusted P-value <0.05, we concluded that the emergence rates were different for these groups for that item.
RESULTS
The t-test of baseline Total BRSD scores indicated that an assumption of equal variances across the groups was not warranted (F=45.8, P< 0.001) and that the difference between the groups in Total scores at baseline was significant (t=–15.02, df=294.3, P< 0.001). An assumption of equal variances across the groups was also not warranted for 1-year change in Total BRSD scores (F=41.3, P< 0.001), and the difference in change on Total scores between the groups marginally failed to meet our level of significance (t=1.960, df=254.3, P=0.051). The mean change for NEC was –1.52±4.46 and for AD was 1.07±16.73. The total scores changed by less than 2 points on average, but the changes were in opposite directions. This difference might be considered marginally significant, but Patterson et al.6 suggest that such a small degree of change is not clinically meaningful. Also, the difference is due in part to an apparent “improvement” in the NEC over 12 months. For EER to be considered a useful outcome measure, it should identify a clinically meaningful difference in 12-month change, namely emergence, across these groups.
Table 1 contains the summary of the elements used to calculate EER from NEC data, the NEC-based EER confidence interval boundaries, and the information used to calculate expected AD emergence rates (and their confidence intervals) plus the observed values. We estimated an overall emergence rate of 25 emerged per 2,669 opportunities, or 0.009 (0.005, 0.013) for BRSD symptoms over 12 months in NEC, and an overall emergence rate of 722 per 6,527 opportunities, or 0.111 (0.103, 0.118) for AD. The permutation test12 for a difference in estimated rates of emergence was significant at the P<0.001 level. Thus, significantly greater emergence occurred over 12 months in the AD population than in the NEC group. We also calculated a total of 51.3 individual Expected emerged items in 6,527 possibilities (sum of all ratings of Absent over all 45 items for 235 AD), and when these were compared with the Observed emerged items (722), we found that 51.3 Expected / 722 Observed = 0.071. In other words, (1.0–0.071)×100%=92.9% more emergence was observed in AD than would be expected given the NEC-based EERs.
The results of the item-level testing of emergence across the groups are indicated in Table 1 by asterisks. Although the overall rates of emergence were significantly lower for NEC than AD, and overall 93% more emergence was observed in AD than would be expected based on the NEC-derived EERs, Table 1 shows that observed emergence in AD exceeded that for NEC on only 13 of 45 items: physical signs of anxiety, lack of enjoyment, difficulty getting started, appetite change, unintentional weight change, uncooperativeness, restlessness, purposeless behavior, confusion at particular times of day, repetitiveness, social withdrawal, seeking more contact, and belief that people are in the house (items 2, 9, 10, 14, 15, 21, 24, 25, 26, 30, 31, 32, and 41).
DISCUSSION
There are several issues to consider in evaluating EER as a potential outcome measure. These include its validity, general applicability, and limitations.
The elements of validity associated with calculating change scores are also present in EER computation, namely, that caregivers (or informants) are reporting frequencies differently at two timepoints, rather than reporting the change directly. Because EERs are based on the same data that change scores are based on, they will be just as valid—and also may be prey to the same reporting problems. However, the finding that using EER resulted in a clear and interpretable difference between normal control subjects and AD patients, obscured when simple change scores were used, suggests three possible advantages over simple change scores. In addition to providing an intuitively appealing quantification of the differences between the groups, emergence may decrease the “noise” in change scores by eliminating all other types of change from consideration. Each subject might improve or worsen on equal numbers of items, resulting in the appearance of stability;1 emergence as an outcome allows the identification of possibly the most worrisome type of change. Because of the reduction in noise, using emergence rates might increase the sensitivity of an instrument to important types of change and might also increase the power of the analyses relative to those performed using simple change scores.
It is important to note that one source of the difference between these two groups could be that while NEC and AD change scores in Total BRSD were distributed approximately normally about their means of –1 and 1, respectively, the standard deviation is much greater for the AD than for the NEC. This implies it is the nature of the distribution of change scores, and not the change scores themselves, that differentiates the groups. However, it is also important to note that keeping the distribution of change scores close to the mean, that is, limiting the spread, might reflect a stability of symptomatology in one population that is absent in the other. In the context of a clinical trial, such a stabilization of change may be exactly appropriate for assessing efficacy of treatment with respect to placebo.
A higher than expected rate of emergence may represent greater variability in the group's change scores, which implies a greater propensity for subjects in the group to move across symptom-severity levels (e.g., “mildly disturbed” to “very disturbed”). Such dramatic changes may be extremely burdensome for caregivers. Detection of such changes is possible via the method described here, and this information may be useful or informative in clinical trials as well as in the clinical setting.
Limited variability in change scores within a group may represent stability of symptoms in terms of the occurrence of both less decrement and less improvement. Under the analytic approach described here and by Tractenberg et al.,1 all categories of change are identified. Thus, in a clinical trial or in practice, it may be possible to first limit the degree of worsening (i.e., stabilize the symptoms), and then address moving the (mean) change higher, to boost improvement while limiting decrement. This might be accomplished by a two-stage or two-component treatment regimen in the context of a clinical intervention, or in dosage titration within a clinical study.14 Although this study focused on emergence as an outcome, the six other categories of change (listed in the Methods section and described in detail by Tractenberg et al.1) could also be incorporated into trials or therapeutic interventions with equal simplicity.
Potential limitations of using EER as an outcome measure in an intervention trial for behavioral symptomatology include the possibility that emergence of new behaviors would not be possible in individuals with very high baseline levels of symptomatology. However, studies of the BRSD5 and other, similar instruments (e.g., the Cohen-Mansfield Agitation Inventory15 and the Revised Memory and Behavioral Problem Checklist16) have suggested that, on average, the typical AD study population does not have an extremely high baseline level of symptomatology. Baseline levels should be carefully assessed in studies where emergence will be the outcome measure. Additionally, behavioral symptoms may be controlled by psychotropic medications at the time a clinical trial subject is screened, and they may reemerge after a washout period at some point after the baseline visit. Establishing whether a subject has ever exhibited a symptom (rather than just in the past month, as is assessed by the BRSD) might facilitate the distinction between emergent and reemergent symptoms in this context. Emergence relative to a baseline visit cannot capture symptoms that emerge during the study but remit before the last visit. Potential “periodicity” in symptoms should be taken into account when planning assessment visits in studies.
CONCLUSIONS
We found that although the mean changes in Total BRSD scores over 12 months were not significantly different between the NEC and AD groups, comparing 1-year emergence demonstrated that behavioral symptoms were significantly more likely to emerge in AD patients over 12 months than in normal elderly control subjects over the same period. There were 13 symptoms that emerged in significantly more AD than NEC: physical signs of anxiety, lack of enjoyment, difficulty getting started, appetite change, unintentional weight change, uncooperativeness, restlessness, purposeless behavior, confusion at particular times of day, repetitiveness, social withdrawal, seeking more contact, and belief that people are in the house (items 2, 9, 10, 14, 15, 21, 24, 25, 26, 30, 31, 32, and 41). A manuscript describing the behavioral changes observed is currently in press.17
Table 1 showed that the total opportunities for emergence were greater for NEC than for AD. That is, symptomatology in NEC was essentially absent at baseline for the majority of items (greater possibility of emergence), whereas emergence was possible in the majority of items for a smaller proportion of AD. In spite of this, the observed overall emergence was dramatically greater in AD than in NEC. This supports the validity of the parameter.
The analytic approach described here requires frequency or categorical ratings in the instruments to which it may be applied. Therefore, while it might be ideal for behavioral measures, it may not be generalizable to some other instruments useful in clinical trials. We are currently investigating this approach with cognitive measures and hope to report on its utility in other domains. Theoretically, this approach could be adapted to any ordered categorical scale.
Expected emergence rates (EER) provided clear evidence of clinically interpretable changes in the overall behavioral profiles in, and differences between, independent groups. Because the comparison of the changes in total scores did not distinguish the groups, we interpret these findings as evidence in support of the EER as a potential outcome measure. In particular, we believe that EER may offer improved sensitivity over change in total score. With the applicability of this approach to any categorical data, and in any population, calculation of expected emergence rates can be utilized as an outcome measure in many different domains and settings.
ACKNOWLEDGMENTS
This work was supported by Grant AG10483 from the National Institute on Aging.
 |
1 Tractenberg RE, Jin S, Patterson M, et al: Qualifying change: a method for defining “clinically meaningful” outcomes of change score computation. J Am Geriatr Soc 2000; 48:1478-1482Crossref, Medline, Google Scholar
2 Streiner DL, Norman GR: Health Measurement Scales: A Practical Guide to Their Development and Use, 2nd edition. Oxford, UK, Oxford University Press, 1995Google Scholar
3 Lezak MD: Neuropsychological Assessment, 3rd edition. New York, Oxford University Press, 1995Google Scholar
4 Tariot PN, Mack JL, Patterson MB, et al: The Behavior Rating Scale for Dementia of the Consortium to Establish a Registry for Alzheimer's Disease. The Behavioral Pathology Committee of the Consortium to Establish a Registry for Alzheimer's Disease. Am J Psychiatry 1995; 152:1349-1357Crossref, Medline, Google Scholar
5 Mack JL, Patterson MB, Tariot PN: The Behavior Rating Scale for Dementia (BRSD): development of test scales and presentation of data for 555 individuals with Alzheimer's disease. J Geriatr Psychiatry Neurol 1999; 12:211-223Crossref, Medline, Google Scholar
6 Patterson MB, Mack JL, Mackell JA, et al: A longitudinal study of behavioral pathology across five levels of dementia severity in Alzheimer's Disease: the CERAD Behavior Rating Scale for Dementia. Alz Dis Assoc Disord 1997; 11(suppl 2):S45-S55Google Scholar
7 Ferris SH, Mackell JA, Mohs R, et al: A multicenter evaluation of new treatment efficacy instruments for Alzheimer's disease clinical trials: overview and general results. Alz Dis Assoc Disord 1997; 11(suppl 2):S1-S12Google Scholar
8 Folstein MF, Folstein SE, McHugh PR: “Mini-Mental State”: a practical method for grading the cognitive state of patients for the clinician. J Psychiatr Res 1975; 12:189-198Crossref, Medline, Google Scholar
9 McKhann G, Drachman D, Folstein M, et al: Clinical diagnosis of Alzheimer's disease: report of the NINCDS-ADRDA work group under the auspices of the Department of Health and Human Services Task Force on Alzheimer's Disease. Neurology 1984; 34:939-944Crossref, Medline, Google Scholar
10 Thal LJ: Development of the Alzheimer's Disease Cooperative Study. Int J Geriatr Psychopharmacol 1997; 1:6-9Google Scholar
11 Mack JL, Patterson MB: Manual: CERAD Behavior Rating Scale for Dementia, 2nd edition. Durham, NC, Consortium to Establish a Registry for Alzheimer's Disease, 1996Google Scholar
12 Troendle JF: A stepwise resampling method of multiple hypothesis testing. Journal of the American Statistical Association 1995; 90:370-378Crossref, Google Scholar
13 Holm S: A simple sequentially rejective multiple test procedure. Scandinavian Journal of Statistics 1979; 6:65-70Google Scholar
14 Forette F, Bert P, Breuil V, et al: Therapeutic drug trials and heterogeneity of Alzheimer's disease, in Heterogeneity of Alzheimer's Disease, edited by Boller F. Berlin, Springer-Verlag, 1992, pp 67-73Google Scholar
15 Cohen-Mansfield J: Instruction Manual for the Cohen-Mansfield Agitation Inventory (CMAI). Rockville, MD, The Research Institute of the Hebrew Home of Greater Washington, 1991Google Scholar
16 Teri L, Borson S, Kiyak A, et al: Behavioral disturbance, cognitive function, and functional skill: prevalence and relationship in Alzheimer's disease. J Am Geriatr Soc 1989; 37:109-116Crossref, Medline, Google Scholar
17 Tractenberg RE, Weiner MF, Patterson M, et al: Emergent psychopathology in Alzheimer's disease patients over 12 months associated with functional, not cognitive, changes. J Geriatr Psychiatry Neurol (in press)Google Scholar