Changes in Seizure Threshold Over the Course of Electroconvulsive Therapy Affect Therapeutic Response and Are Detected by Ictal EEG Ratings
Abstract
Therapeutic effectiveness of electroconvulsive therapy is influenced by the degree to which the stimulus intensity exceeds the seizure threshold. However, the threshold rises variably over the treatment course, confounding maintenance of desired relative stimulus intensity. In 47 depressed patients, decreases in relative stimulus intensity between treatments 1 and 6 were associated with diminished therapeutic response at treatment 6 for unilateral (UL) ECT. A multivariate model including manual ratings of ictal EEG data predicted whether seizure threshold rose with 82% accuracy. The same EEG variables were also significantly related to therapeutic response. Thus, decreases in relative stimulus intensity over the ECT course affect the therapeutic potency of UL ECT. Further, ictal EEG indices have considerable potential for predicting such stimulus intensity changes and their effect on therapeutic outcome.
The therapeutic effectiveness of electroconvulsive therapy, at least for unilateral nondominant electrode placement (UL), depends in part on the degree to which the stimulus intensity exceeds the seizure threshold—that is, on the relative stimulus intensity.1–3 Evidence suggests that for bilateral (BL) ECT, higher relative stimulus intensity is associated with a more rapid therapeutic response,1,2 whereas barely suprathreshold UL ECT has a significantly reduced antidepressant potency compared with moderately suprathreshold UL ECT (150% above threshold).1–3 This information might be applied clinically by determining the seizure threshold at the first treatment4,5 and subsequently administering treatments at a desired intensity above that threshold. Maintaining such a desired relative stimulus intensity during the course of treatments is confounded, however, by a variable increase in seizure threshold that occurs over the treatment course.1,6–8 Such a rise in the seizure threshold will lessen the degree to which a fixed stimulus dosage exceeds the seizure threshold and thus will possibly result in diminished treatment therapeutic potency, particularly for UL ECT.
Whether increases in the seizure threshold that decrease relative stimulus intensity during ECT treatment course affect therapeutic potency has not been adequately studied. The small number of studies that have examined relations between the anticonvulsant effects of ECT and its therapeutic efficacy have produced inconsistent findings.1,2,4,7–9 Of these studies, only one examined the therapeutic effect of decreases in relative stimulus intensity with UL ECT.9 The results of that study are difficult to interpret, however, because there were only 9 subjects, and they were treated for mania with a mixture of dominant and nondominant UL ECT.
If decreases in relative stimulus intensity over the treatment course diminish the efficacy of ECT, it would be clinically useful to have a means to detect the rise in seizure threshold and thereby be able to increase stimulus intensity to maintain an adequate relative stimulus dosage.6 In the absence of such information, the practitioner must either perform multiple seizure threshold titrations over the treatment course, which is impractical, or use BL or high-intensity UL ECT in all cases. Unfortunately, the latter two alternatives would result in greater adverse cognitive effects.1,2,6,10–12
Recent research by our group3,13,14 and others15 suggests that ictal EEG measures of the ECT seizure may, in fact, be used to provide a means of estimating relative stimulus intensity. In fact, ictal EEG measures of the ECT seizure—including immediate poststimulus amplitude, midictal amplitude, immediate postictal amplitude, ictal slow-wave duration, immediate poststimulus coherence (interhemispheric correlation of low frequency activity), and time to the onset of high-amplitude ictal slowing—have been shown to be sensitive to relatively large differences (125%–150%) in relative stimulus intensity.3,13–15 Further, ictal EEG evidence of diminished ECT seizure intensity has been found to be associated with ECT nonresponse.3,14,15 However, no study has directly examined whether such ictal EEG indices are sensitive to the somewhat smaller decreases in relative stimulus intensity that occur as seizure threshold rises over the clinical ECT course (47%–50% by treatments 5–74,7 and 42%–99% by the end of the treatment course4,8,9) and whether such indices might signal changes in the therapeutic potency of the ECT seizure.
This report examines the relationship between this anticonvulsant effect of ECT, ictal EEG measures of seizure intensity, and treatment therapeutic potency.
METHODS
Subjects
Of the 62 inpatients at Duke University Medical included in our earlier examination of the anticonvulsant effects of ECT,5,7 47 satisfied the exclusionary criteria described below and were the subjects of the present investigation. Subjects were excluded if they did not meet DSM-III-R criteria for major depression (n=2), did not have a baseline Montgomery-Åsberg Depression Rating Scale (MADRS)16 rating of 20 or greater (n=2), did not have complete outcome data (see below; n=3), deviated from the clinical stimulus dosing protocol (see below; n=3), or had any clinical or laboratory evidence of cerebral disease that might affect the ictal EEG (evidence of focal brain disease or slowing on the pre-ECT EEG; n=5). None of the subjects had received ECT in the preceding 6 months, and none were taking anticonvulsants, benzodiazepines, theophylline, or methylphenidate during the ECT course. All patients were free of psychotropic medications at the time of the first ECT treatment except for the use of antipsychotic medication (n=6). The mean drug-free interval for antidepressants was 9.8 days (n=39; range 3–30 days); for lithium, it was 8.7 days (n=9; range 3–23 days); and for benzodiazepines, it was 6.0 days (n=26; range 1–11 days). The mean age of the patients was 57.3 years (SD=16.2); 18 were men and 29 were women.
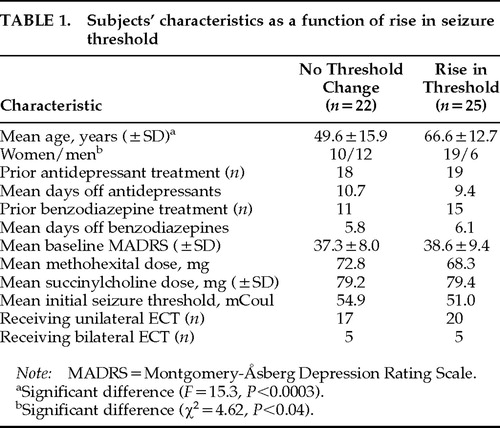
The characteristics of subjects who had a rise in threshold between treatments 1 and 6 versus those who did not are listed in Table 1.
ECT Administration
All patients received bidirectional pulse ECT (Mecta SR1 ECT device, Mecta Corp., Portland, OR). UL ECT electrode placement was implemented as described by d'Elia.17 Electrode placement (UL=37, BL=10) was decided by the patient's clinical treatment team with consultation from the ECT service. Routine anesthetic agents included methohexital 1 mg/kg and succinylcholine 1 mg/kg, along with 100% oxygen per mask. All subjects received ECT at a fixed intensity above the seizure threshold according to our standard clinical protocol. (Three subjects were excluded because their stimulus intensity was increased between treatments 2 and 6.) The protocol included seizure threshold determination at treatment 1, followed by subsequent treatments administered at 125% above the seizure threshold for UL ECT and 50% above the seizure threshold for BL ECT. In addition, these subjects underwent retitration of seizure threshold at treatment 6 with the same titration procedure that was used at treatment 1.5,7 This procedure involved the selection of a starting stimulus dosage based on stimulus electrode placement and gender (since seizure threshold is lower for women and for UL ECT).1 If a seizure of greater than 25 seconds' duration on EEG was not elicited, the stimulus intensity was increased by 50% and the patient was restimulated. A seizure of greater than 25 seconds was elicited in all cases by the fourth stimulation. Treatments following treatment 6 were administered at a stimulus intensity that was 50% (BL) or 125% (UL) above the seizure threshold determined at treatment 6.
EEG Recording and Ratings
For the majority of subjects, one channel of EEG data was recorded onto paper from a left prefrontal to mastoid derivation, using a MECTA SR1 ECT device. In all cases, Ag/AgCl electrodes were employed. The electrode sites were cleaned with alcohol and an abrasive cleanser (Omniprep, D.O. Weaver and Co., Aurora, CO) and conductive gel was applied to ensure a low EEG electrode–scalp impedance.
EEG data were manually rated by A. K., who was blind to all treatment and outcome data, after he demonstrated good interrater reliability with T. H. on all measures (intraclass correlation coefficient>0.7, P<0.0001, for all measures). Manual ratings included immediate poststimulus, midictal, and postictal amplitude, midictal regularity, and time to onset of slowing. Ratings were carried out with attention to the need to avoid rating data contaminated by artifacts. Artifacting focused on myogenic and motion artifacts, which are the most common. The immediate poststimulus (Early) amplitude was defined as the largest mean peak-to-peak amplitude measured for 3 successive peaks in the first 10 seconds following the stimulus artifact. Midictal amplitude was defined as the maximum mean peak-to-peak amplitude for 3 contiguous slow waves that are representative of the midictal pattern of the seizure.13,18 Postictal amplitude was measured as the average peak-to-peak excursion of the EEG in the first 6 artifact-free seconds after seizure termination.13,18 Regularity was rated for the predominant morphologic pattern characterizing the midictal portion of the seizure according to a 7-point ordinal scale from 0 to 6 (with 6 being the most regular pattern) according to the scale published by Krystal, Weiner, and co-workers.13,18,19 The time to the onset of slowing (TSLOW) was defined as the time until the dominant frequency of the seizure EEG activity first became less than 5 Hz. These particular EEG measures were used because they have been shown to be valid and reliable for identifying differences in relative stimulus intensity among ECT seizures in prior research.13
Therapeutic Outcome Measurement
We assessed therapeutic outcome 1 to 2 days after the 6th ECT treatment, rather than at the end of the treatment course as in previous studies.5,7 This difference was instituted because stimulus intensity was increased for the subsequent treatments when rises in seizure threshold were detected at treatment 6. As described above, this outcome assessment strategy allowed us to study the effect of rises in the seizure threshold on both relative stimulus intensity and therapeutic potency. MADRS and Clinical Global Impressions Scale (CGI) ratings were carried out at baseline and after treatment 6 by the clinical treatment team.16,20 Dichotomous outcome ratings were based on the CGI ratings, so that response was defined as achieving at least moderate improvement (CGI improvement score <4) and being no more than mildly ill (CGI severity score <4).3 A dichotomous therapeutic outcome measure was also derived from the MADRS ratings: responders were defined as those experiencing at least a 50% decrease in MADRS score by treatment 6 and having a treatment 6 rating of no more than 15.
Statistical Analysis
All EEG variables were checked for distribution normality by using the Shapiro-Wilk test and were transformed as indicated by this analysis to an approximate normal distribution.21 All amplitude measures and TSLOW were normalized by a logarithmic transform, and Regularity was normalized by a cubic transform. All analyses were carried out by using two-tailed tests of significance and the SAS statistical analysis system (SAS Institute, Inc., Cary, NC).
Analyses regarding the change in threshold from treatment 1 to treatment 6, the effect of changes in threshold on both therapeutic response and the ictal EEG, and the relationship between the ictal EEG and therapeutic response are described below. In the development of ictal EEG models for both seizure threshold rise and therapeutic response, principal components analysis of the EEG variables was employed to avoid the incorporation into the models of intercorrelated measures.3,22,23 The resulting principal components that were entered into the multiple logistic regression and multiple linear regression models, along with age and gender, were orthogonal linear combinations of the z-transformed EEG variables. (Z-transformation involves subtracting the mean from each EEG variable and dividing by the standard deviation.22) These variables were entered into the models, and variables that did not contribute significantly were removed in a stepwise manner. Because of the bias associated with developing and testing a model on the same data set, the models were evaluated by using the “leave-one-out” technique, which gives a more realistic estimate of how a model will perform when tested on new data. With this procedure, data for each subject were sequentially removed, a separate logistic regression model was developed with the remaining data, and the resulting model was tested on the data from the removed subject.3,24
RESULTS
Change in Seizure Threshold From Treatment 1 to Treatment 6
The seizure threshold rose by at least 50% in 25 of 47 subjects. Of those 25 subjects, the seizure threshold increased 50% (one dose level of the seizure threshold titration protocol used)5,7 for 21 subjects, and for 4 subjects there was a 125% increase (2 dose levels of the seizure threshold titration protocol). The mean percentage increase in seizure threshold for the entire group was 40%. Subject characteristics as a function of whether there was a rise in seizure threshold appear in Table 1.
In order to study the relationship between increases in the seizure threshold, electrode placement, and gender, a logistic regression was carried out; the percentage rise in threshold served as the dependent variable, and electrode placement, age, and gender were the independent predictor variables. As previously reported for the original sample,5,7 older subjects were significantly more likely to have a rise in seizure threshold (F=9.5, P<0.002). Electrode placement and gender were not related to the change in the seizure threshold.
Relationship Between a Rise in Seizure Threshold and the Therapeutic Response at Treatment 6
A logistic regression was carried out in which rise in seizure threshold, electrode placement, age, and gender were simultaneously entered into a model of therapeutic response at treatment 6 (dichotomous response criteria based on the CGI described above). A rise in threshold was associated with a significantly lower likelihood of therapeutic response (χ2=4.64, P=0.031), and older subjects were more likely to be nonresponders (χ2=5.32, P=0.021). Older subjects were also more likely to have a rise in seizure threshold. Electrode placement and gender were not found to be related to therapeutic outcome in this model. However, a significant association between these two variables was seen only with UL ECT. For UL ECT, there were significantly greater numbers of therapeutic responders among those who did not have a rise in seizure threshold (lowering of relative stimulus intensity; 63%, 10/16) versus those in whom the seizure threshold did rise (26%, 5/19; χ2=4.64, P=0.031; Table 2). It is of note that none of the 4 individuals receiving UL ECT who had a 125% rise in seizure threshold were therapeutic responders at treatment 6. In terms of therapeutic response determined on the basis of MADRS ratings, there was a trend for individuals who experienced a rise in seizure threshold to be nonresponders (53%, 9/17, vs. 25%, 5/20; χ2=3.05, P=0.08). However, treatment 6 MADRS scores were not significantly different as a function of rises in the seizure threshold.
Relationship Between a Rise in Seizure Threshold and the Ictal EEG
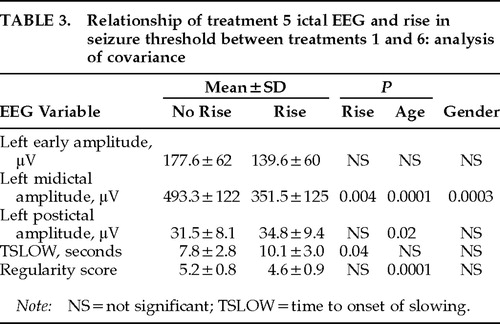
A multivariate analysis of covariance (MANCOVA) was carried out with treatment 5 data for all five ictal EEG variables serving as dependent variables. Rise in threshold (this was a dichotomous variable, rated 0 for no detectable change in threshold [<50% rise] and 1 if the threshold rose at least 50%) was an independent variable, along with electrode placement and the interaction of these two variables. Age and gender served as covariates. The analysis was intended to test the hypothesis that subjects with an increase in seizure threshold from the first to the sixth ECT treatment would also have evidence of decreased seizure intensity in treatment 5 ictal EEG variables. Results appear in Table 3. A significant multivariate main effect of rise in threshold was found (multivariate F=4.9, df=5,25, P=0.003). Ictal EEG evidence of diminished seizure intensity was associated with rises in the seizure threshold only for UL ECT (F=2.88, df=5,32, P=0.029). Gender and age were both significant covariates (gender: F=3.22, df=5,32, P=0.02; age: F=5.26, df=5,32, P=0.0012).
Follow-up univariate analysis showed that patients with a rise in the seizure threshold had evidence of decreased seizure intensity in all ictal EEG variables, although this effect was only significant for midictal magnitude (F=10.1, P=0.004) and TSLOW (F=4.9, P=0.04; Table 3). Age and gender were significant covariates for a number of measures (Table 3).
We also tested whether the difference in treatment 2 and treatment 5 ictal EEG variables was related to increases in seizure threshold occurring between treatments 1 and 6. This approach is advantageous for clinical application because it eliminates the problem of interindividual variation in the ictal EEG.6 Repeated-measures analysis of variance was performed with ictal EEG indices at treatment 2 and treatment 5 serving as the repeated measures and rise in threshold serving as the independent variable. A significant effect of rise in threshold over time was seen only for left midictal amplitude (F=6.4, P=0.02). For subjects who had no change in threshold, the mean midictal amplitude rose from 465 μV (SD=129) at treatment 2 to 479 μV (SD=131) at treatment 5, whereas for those who had a rise in seizure threshold, the mean midictal amplitude decreased from 420 μV (SD=121) at treatment 2 to 363 μV (SD=131) at treatment 5, indicative of a significant decrease in seizure intensity.
An Ictal EEG Model to Predict When a Rise in Seizure Threshold Has Occurred
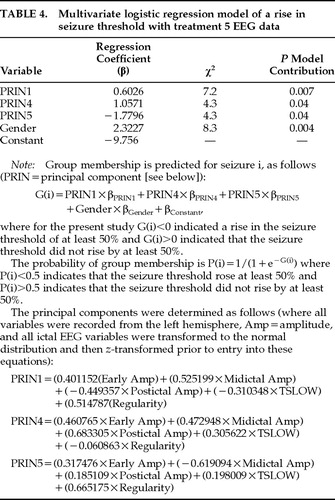
A multivariate logistic regression model of whether a rise in threshold occurred between treatments 1 and 6 was developed with the principal components of treatment 5 left-sided ictal EEG variables and both age and gender for UL ECT data (variables added stepwise). Data from subjects who received BL ECT were not included in this analysis, since a relationship between rise in threshold and both therapeutic outcome and ictal EEG variables was found only for UL ECT. As shown in Table 4, only EEG principal components 1, 4, and 5 and gender contributed significantly (P<0.05) to the prediction of a rise in threshold and were included in the final model. In order to estimate the expected predictive accuracy of this model, the “leave one out” procedure was used, demonstrating an accuracy (percentage of correct classifications) of 82%, with an 88% sensitivity (13/15 accuracy for identifying a rise in threshold) and a specificity of 78% (14/18 accuracy for identifying no change in threshold). Age was not included in the model because it provided no additional information to the EEG data, so that once EEG variables were entered into the model it no longer made a significant contribution to the prediction of a rise in threshold. In a model including only gender and age, both contributed to prediction of rise in threshold, but the expected accuracy of the model was only 66%. This finding suggests that although age is predictive of a rise in threshold, EEG indices account for that predictive capacity and provide significant additional ability to predict changes in the seizure threshold.
The logistic regression model based on the principal components of treatment 5 ictal EEG data is most heavily dependent on midictal amplitude, as would have been expected on the basis of the MANCOVA described above. For all three principal components included in the model, this variable is weighted heavily and in a polarity such that greater midictal amplitude is associated with prediction of no threshold change. Also, for the first principal component, which made the largest contribution to the model, greater seizure intensity was associated with a greater likelihood of no seizure threshold change for all 5 ictal EEG variables (higher ictal amplitude and regularity, lower postictal amplitude, and TSLOW).
In order to develop a model that capitalized on the advantages of an intraindividual comparison of EEG data across the relevant portion of the treatment course, a multivariate logistic regression model of rise in threshold was developed, using the difference between treatment 2 and treatment 5 ictal EEG data, age, and gender. The variables that contributed significantly to this model were principal component 5 (χ2=5.1, P=0.03) , age (χ2=8.3, P=0.004), and gender (χ2=4.4, P=0.04). When tested with the “leave-one-out” procedure, this model had a predictive accuracy of 80% with an expected sensitivity of 76% (13/17 correct prediction rate for a rise in threshold) and an associated specificity of 85% (11/13 correct prediction rate for no change in threshold) for identifying a rise in seizure threshold. Principal component 5 of the differences between treatment 2 and treatment 5 ictal EEG variables is dominated by the difference in midictal magnitude, as would have been expected from the repeated-measures analysis described above. The weighting of this variable in the model was such that a large positive difference between treatment 2 and treatment 5 midictal amplitude (decrease in midictal amplitude from treatment 2 to treatment 5 suggesting a decrease in seizure intensity) was associated with a greater likelihood of a rise in seizure threshold.
Relationship Between Treatment 5 Ictal EEG and Therapeutic Response
A multivariate analysis of covariance was carried out for all subjects with treatment 5 data for all five ictal EEG measures serving as the dependent variables. Therapeutic response (derived from treatment 6 CGI ratings) was the independent variable, along with electrode placement and their interaction, and age and gender were covariates. A significant main effect for therapeutic response was found (F=2.72, P=0.037), as well as a trend for electrode placement (F=1.98, P=0.08). There was no significant electrode placement by therapeutic response interaction found. Age was a significant covariate (F=3.92, P=0.007), but gender was not.
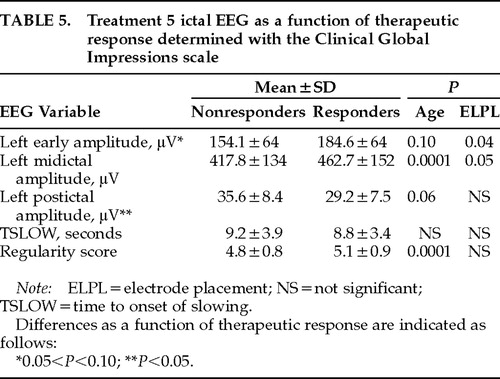
On the basis of these findings, follow-up univariate analyses of covariance were carried out with each EEG variable as the dependent variable, CGI-based dichotomous therapeutic response and electrode placement as the independent variables, and age as a covariate. The results (Table 5) are consistent with greater seizure intensity (greater early and midictal amplitude and regularity and smaller TSLOW and postictal amplitude) in responders as compared with nonresponders. This effect was significant only for postictal amplitude (F=5.12, P=0.02), and there was a trend for greater early amplitude in responders (F=2.69, P=0.10).
An Ictal EEG Model of Therapeutic Response at Treatment 6
First, the ictal EEG variables that best predicted a change in seizure threshold were used to develop models that predicted therapeutic response at treatment 6. For UL ECT, age, gender, and treatment 5 ictal EEG data principal components 1, 4, and 5 (see Table 4) were entered into a logistic regression model of dichotomous response at treatment 6. Only principal component 1 (χ2=5.42, P=0.02) and gender (χ2=5.39, P=0.02) were significantly related to therapeutic response and contributed significantly to the model. When tested with the “leave-one-out” procedure, the model was associated with a 70% accuracy in predicting dichotomous therapeutic response, with an associated sensitivity of 67% (10/15) and specificity of 72% (13/18) for detecting nonresponders.
A multivariate linear regression model of MADRS score at treatment 6 was also developed with these three principal components. Age, gender, and baseline MADRS score were also included in the model. Once again, only the first principal component of the EEG data significantly contributed to this model (see Table 4), along with baseline MADRS (R2=0.10, F=5.0, P=0.033). Principal component 1 accounted for 18.3% of the variance in treatment 6 MADRS (R2=0.183, F=6.9, P=0.013). The weightings of principal component 1 in both of the logistic and linear regression models were such that ictal EEG evidence of greater seizure intensity for all 5 ictal EEG variables was associated with a greater likelihood of predicting therapeutic response.
We also explored whether ictal EEG principal components other than those that were significantly related to rise in threshold (components 1, 4, and 5 out of 5 possible principal components) might explain additional variance in therapeutic response. Principal components 2 and 3 were added stepwise to the logistic regression model of CGI-based dichotomous therapeutic response and to the multiple regression model of MADRS score at treatment 6 described above. Neither of these components significantly contributed to the logistic regression model; however, principal component 3 contributed significantly to the model of MADRS score including principal component 1 and baseline MADRS score. This component accounted for an additional 13% of the variance in MADRS score (R2=0.13, F=5.8, P=0.023); as a result, a model of MADRS score including baseline MADRS (R2=0.10) and principal component 1 (R2=0.183) accounted for a total of 41.5% of the variance (R2=0.415) in MADRS score at treatment 6. This additional contribution of principal component 3 is consistent with the finding of significantly smaller postictal amplitude and a trend for greater early amplitude in therapeutic responders as compared with nonresponders, since principal component 3 weights those two variables highly (weighting for postictal amplitude=0.52401; weighting for early amplitude=–0.514666).
Models of therapeutic response on the basis of the principal components of difference between treatment 2 and treatment 5 ictal EEG data and both gender and age were also developed; however, the principal components of the ictal EEG variables did not contribute significantly to either model.
DISCUSSION
This study is the first to demonstrate that decreases in relative stimulus intensity occurring over the treatment course with UL ECT (as a result of rises in the seizure threshold not accompanied by increases in absolute stimulus intensity) are associated with decreased therapeutic potency. An effect on therapeutic response was seen even though the change in relative stimulus intensity was smaller than those in previous studies reporting that differences in relative stimulus intensity affect therapeutic outcome, particularly for UL ECT.1–3 The magnitude of the differences in seizure threshold seen in the present study (40%) is in agreement with what has been previously reported at this point in the treatment course,4,5,7 as is the finding that older subjects were more likely to have a seizure threshold rise.5,7 (The subjects in the present study are a subset of those in Coffey et al.7)
The present results do not contrast with previous reports suggesting that rises in the seizure threshold are associated with a good therapeutic response4,9 or are unrelated to therapeutic response,7–9 since these other investigations either studied BL ECT9 or were designed to maintain a constant relative stimulus intensity in the face of changes in the seizure threshold. Instead, we hypothesize that rises in threshold may have two distinct and opposite relationships to therapeutic outcome. First, the positive relationship between rises in threshold and therapeutic benefit reported in some studies suggests that such rises may in themselves be a marker of a physiologic change taking place in the brain that is necessary for therapeutic benefit with ECT, such as the activation of endogenous anticonvulsant processes.4 On the other hand, rises in seizure threshold with UL ECT that are not accompanied by increased absolute stimulus intensity also act to decrease the relative stimulus intensity of UL ECT and thereby diminish treatment therapeutic effectiveness2.
The evidence that these rises in the seizure threshold may be associated with diminished therapeutic potency of UL ECT suggests that it will be important to detect and adjust for such changes in the clinical setting. As mentioned previously, since it is impractical to perform repeated seizure threshold titrations and since the exclusive use of BL ECT or maximal intensity UL ECT is associated with increased cognitive side effects,1,2,6,10–12 it is particularly important to develop a method for estimation of the seizure threshold throughout the course. In this regard, the present study provides evidence that a rise in the seizure threshold is associated with ictal EEG evidence of decreased seizure “intensity” (lower ictal amplitude and regularity, and greater postictal amplitude and time to onset of slowing).
These findings are in agreement with previous ictal EEG studies of UL ECT demonstrating that barely suprathreshold ECT was associated with evidence of decreased seizure intensity in these same variables compared with moderately suprathreshold ECT (125% and 150% of seizure threshold).3,13,15 This study further suggests that such ictal EEG changes are detectable when the differences in seizure threshold are smaller (generally 50% changes were seen in this clinical study, compared with differences with UL ECT of 125% to 150% studied earlier in research populations). Further, because decreases in relative stimulus intensity at the end of the treatment course are likely to be even larger than those seen here, the magnitude of such ictal EEG effects may even be greater at that point.
The fact that increases in the seizure threshold occurring over the UL ECT course are accompanied by ictal EEG evidence of decreased seizure intensity is further evidence of an anticonvulsant effect of ECT, possibly mediated by increases in GABA activity, as has been proposed.25 Although these changes have been hypothesized to be involved in the mechanism of action of ECT, the present study suggests that when they diminish the intensity of UL ECT seizures, they may result in a decrease in treatment therapeutic potency. We have also previously found evidence of a decrease in seizure intensity in the ictal EEG over the treatment course for UL ECT when there is no change in relative stimulus intensity, but the relationship of this finding to therapeutic outcome could not be determined.26 Further work is needed to determine whether ictal EEG evidence of an anticonvulsant effect that does not diminish UL ECT relative stimulus intensity is associated with the therapeutic response to ECT.
In contrast to these UL ECT findings, ictal EEG evidence of decreased seizure intensity did not accompany rises in the seizure threshold for BL ECT. Still, the present findings must be viewed as preliminary because of the small number of subjects studied who received BL ECT.
The UL ECT findings must also be considered in the context of the limitations of the procedure used to determine the seizure threshold.5 The accuracy of seizure threshold determinations is constrained by the 50% increments in charge that were employed. Further, available evidence suggests that this procedure likely overestimated the seizure threshold in approximately half of the subjects.5 Additional studies are needed to confirm these findings using a lower initial stimulus intensity and smaller dosing increments.
In terms of applying this information in the clinical setting, we developed multivariate logistic regression models of when a rise in seizure threshold has taken place, using manually rated ictal EEG variables. A model including three principal components (components 1, 4, and 5) of treatment 5 ictal EEG variables and gender was associated with a predictive accuracy of 82% for identifying when a rise in threshold has taken place at treatment 6 (88% sensitivity, 78% specificity). The ictal EEG variable that contributed most strongly to this model was midictal amplitude, though for all variables ictal EEG evidence of diminished seizure intensity tended to be associated with a higher likelihood of a rise in seizure threshold. A within-subjects model was also developed using the difference in ictal EEG indices at treatments 2 and 5, as well as age and gender. This model also weighted midictal amplitude most heavily, so that decreases in EEG amplitude at treatment 5 compared with treatment 2 were associated with a greater likelihood of a rise in seizure threshold. This model was associated with an 80% predictive accuracy.
Used in a clinical setting, such EEG models could allow practitioners to maintain a desired relative stimulus intensity by determining when changes in threshold have taken place, allowing the stimulus intensity to be adjusted accordingly. The model based on the differences between treatments 2 and 5 is the first such model based on a within-subjects approach, which has the advantage of diminishing intersubject variability in the ictal EEG.6
The variables that best predicted a rise in threshold were also used to develop models of therapeutic response. Significant relationships between treatment 5 ictal EEG variables and therapeutic response were found, but there did not appear to be a relationship between therapeutic response and the difference between treatment 2 and 5 EEG data. Ictal EEG evidence of greater seizure intensity for all treatment 5 ictal EEG variables studied tended to be associated with a greater likelihood of a good therapeutic response on both a dichotomous CGI-based outcome rating scale and a continuous MADRS rating at treatment 6. A multivariate logistic regression model including principal component 1 for treatment 5 ictal EEG data and gender was associated with an expected correct therapeutic response prediction rate of 70% at treatment 6. The same variable was significantly related to treatment 6 MADRS score, and the addition of principal component 3 resulted in a multivariate linear regression model that accounted for 41.5% of the variance in MADRS score. These analyses indicated that greater early and midictal amplitude and postictal suppression were associated with a better therapeutic response, and thus they are in agreement with a previous report of a significant relationship between these same ictal EEG variables and therapeutic response at treatment 6 in one study employing computer EEG analysis3 and two reports of manual ratings of greater ictal EEG postictal suppression in ECT responders.16,27
The same combination of ictal EEG variables (principal component 1) was a significant predictor of both a rise in seizure threshold and therapeutic response. This finding supports the potential utility of those ictal EEG indices in the clinical setting. This evidence suggests that such indices would be able to detect changes in the seizure threshold that occurred over the treatment course and allow stimulus intensity adjustments to be made accordingly. It also suggests that adjustments made on that basis may improve the therapeutic effectiveness of ECT.
In summary, these findings indicate that increases in seizure threshold occurring clinically over the treatment course are associated with ictal EEG evidence of diminished seizure intensity and that they affect the therapeutic response to ECT. Ictal EEG models are able to detect such changes as well as reflect therapeutic potency. Thus, ictal EEG indices have considerable potential as a means to maintain seizure adequacy in the clinical setting.
ACKNOWLEDGMENTS
This work was supported in part by Grant K20 MH01151 from the National Institute of Mental Health and a Young Investigator Award from the National Alliance for Research in Schizophrenia and Depression. The data described herein were presented in part at the May 1995 meetings of the American Psychiatric Association and the Association for Convulsive Therapy, Miami Beach, FL.
 |
 |
 |
 |
 |
1. Sackeim HA, Devanand DP, Prudic J: Stimulus intensity, seizure threshold, and seizure duration: impact on the efficacy and safety of electroconvulsive therapy. Psychiatr Clin North Am 1991; 14:803–843Crossref, Medline, Google Scholar
2. Sackeim HA, Prudic J, Devanand DP, et al: Effects of stimulus intensity and electrode placement on the efficacy and cognitive effects of electroconvulsive therapy. N Engl J Med 1993; 328:839–846Crossref, Medline, Google Scholar
3. Krystal AD, Weiner RD, Coffey CE: The ictal EEG as a marker of adequate stimulus intensity with unilateral ECT. J Neuropsychiatry Clin Neurosci 1995; 7:295–303Link, Google Scholar
4. Sackeim HA, Decina P, Prohovnik I, et al: Seizure threshold in electroconvulsive therapy: effects of sex, age, electrode placement, and number of treatments. Arch Gen Psychiatry 1987; 44:355–360Crossref, Medline, Google Scholar
5. Coffey CE, Lucke J, Weiner RD, et al: Seizure threshold in electroconvulsive therapy (ECT), I: initial seizure threshold. Biol Psychiatry 1995; 37:713–720Crossref, Medline, Google Scholar
6. Krystal AD, Weiner RD: ECT seizure therapeutic adequacy. Convulsive Therapy 1994; 10:153–164Medline, Google Scholar
7. Coffey CE, Lucke J, Weiner RD, et al: Seizure threshold in electroconvulsive therapy (ECT), II: the anticonvulsant effect of ECT. Biol Psychiatry 1995; 37:777–788Crossref, Medline, Google Scholar
8. Shapira B, Lidsky D, Gorfine M, et al: Electroconvulsive therapy and resistant depression: clinical implications of seizure threshold. J Clin Psychiatry 1996; 57:32–38Crossref, Medline, Google Scholar
9. Mukherjee S: Mechanisms of the antimanic effect of electroconvulsive therapy. Convulsive Therapy 1989; 5:227–243Medline, Google Scholar
10. Weiner RD, Rogers HJ, Davidson JRT, et al: Effects of electroconvulsive therapy upon brain electrical activity. Ann NY Acad Sci 1986; 462:270–281Crossref, Medline, Google Scholar
11. American Psychiatric Association: The Practice of ECT: Recommendations for Treatment, Training, and Privileging: A Task Force Report of the American Psychiatric Association. Washington, DC, American Psychiatric Press, 1990Google Scholar
12. Abrams R: Electroconvulsive Therapy, 2nd edition. New York, Oxford University Press, 1992Google Scholar
13. Krystal AD, Weiner RD, McCall WV, et al: The effects of ECT stimulus dose and electrode placement on the ictal electroencephalogram: an intra-individual cross-over study. Biol Psychiatry 1993; 34:759–767Crossref, Medline, Google Scholar
14. Krystal AD, Weiner RD, Gassert D, et al: The relative ability of three ictal EEG frequency bands to differentiate ECT seizures on the basis of electrode placement, stimulus intensity, and therapeutic response. Convulsive Therapy 1996; 12:13–24Medline, Google Scholar
15. Nobler MS, Sackeim HA, Solomou M, et al: EEG manifestations during ECT: effects of electrode placement and stimulus intensity. Biol Psychiatry 1993; 34:321–330Crossref, Medline, Google Scholar
16. Montgomery SA, Åsberg M: A new depression scale designed to be sensitive to change. Br J Psychiatry 1979; 134:382–389Crossref, Medline, Google Scholar
17. d'Elia G: Unilateral electroconvulsive therapy. Acta Psychiatr Scand Suppl 1970; 46:30–97Crossref, Google Scholar
18. Krystal AD, Weiner RD, Coffey CE, et al: EEG evidence of more “intense” seizure activity with bilateral ECT. Biol Psychiatry 1992; 31:617–621Crossref, Medline, Google Scholar
19. Weiner RD, Krystal AD: EEG monitoring of ECT seizures, in The Clinical Science of Electroconvulsive Therapy, edited by Coffey CE. Washington, DC, American Psychiatric Press, 1993, pp 93–109Google Scholar
20. Guy W: ECDEU Assessment Manual for Psychopharmacology, revised (DHEW publ no ADM-76-338). Rockville, MD, National Institute of Mental Health, 1976Google Scholar
21. Shapiro SS, Wilk MB: An analysis of variance test for normality. Biometrika 1965; 52:591–611Crossref, Google Scholar
22. Bock D: Multivariate Statistical Methods in Behavioral Research. New York, McGraw-Hill, 1973Google Scholar
23. Cohen J, Cohen P: Applied Multiple Regression/Correlation Analysis for the Behavioral Sciences, 2nd edition. Hillside, NJ, Lawrence Erlbaum, 1983Google Scholar
24. Snapinn SM, Knoke JD: Estimation of error rates in discriminant analysis with selection of variables. Biometrics 1989; 45:289–299Crossref, Medline, Google Scholar
25. Sackeim HA, Decina P, Prohovnik I, et al: Anticonvulsant and antidepressant properties of electroconvulsive therapy: a proposed mechanism of action. Biol Psychiatry 1983; 18:1301–1310Medline, Google Scholar
26. Krystal AD, Weiner RD, Coffey CE, et al: Effect of ECT treatment number on the ictal EEG. Psychiatry Res 1996; 62:179–189Crossref, Medline, Google Scholar
27. Suppes T, Webb A, Carmody T, et al: Is postictal electrical silence a predictor of response to electroconvulsive therapy? J Affect Disord 1996; 41:55–58Google Scholar