Patterns of Relative Cerebral Blood Flow in Minor Cognitive Motor Disorder in Human Immunodeficiency Virus Infection
Abstract
Individuals infected with HIV are at risk to develop cognitive impairment during the course of their disease. Although many patients develop an HIV-associated dementia, others may develop the less severe minor cognitive motor disorder (MCMD). In this study, relative cerebral blood flow was measured with PET imaging in HIV+ MCMD patients, HIV+ control subjects, and HIV– control subjects; analyses were performed by using statistical parametric mapping. Comparing a short-term memory task versus a rest state yielded activation in superior temporal cortex, postcentral gyrus, and cerebellum in all three subject groups. Comparing long- and short-term memory tasks yielded activation throughout the frontal cortex, including BA46. Activation in this area was reduced in the HIV+ control subjects and further reduced in the MCMD+ patients. Thus, brain activation associated with lower-level, automatic processing appears normal in HIV+ MCMD+ subjects, but activation associated with effortful retrieval and organizational processes is abnormal.
Individuals infected with the human immunodeficiency virus (HIV) are at risk to develop significant cognitive impairment during the natural history of their infection (see review1); the functional basis of this disorder is still actively under investigation. At autopsy, the brains of patients with HIV-associated dementia (HAD) are characterized by astrocytosis, myelin pallor, infiltration by macrophages, and the presence of multinucleated giant cells.2–4 However, it is a high level of viral or proviral HIV DNA within the central nervous system that is most correlated with HAD;5–7 indeed, levels of HIV RNA recovered from cerebrospinal fluid are found to rise during the 6 to 12 months prior to death, in concert with the evolving clinical syndrome (Wiley, personal communication).
Although a variety of neuropsychological and neurobehavioral data point toward subcortical dysfunction as an important factor in HIV-related cognitive impairment,8–11 direct structure–function correlations are not common. Several studies report that HAD patients have significant MR-identified atrophy, with the basal ganglia prominently affected.12–14 Patients with HAD with increased bicaudate ratios (indicating atrophy of the caudate nuclei) perform more poorly on neuropsychological tests (generally those involving time-dependent functions), and the correlations between performance and atrophy are significant.15
Other studies have examined functional changes in the CNS of HIV-infected individuals rather than focusing on brain morphology. For example, SPECT scanning has revealed significant perfusion defects in HIV-seropositive (HIV+) subjects with cognitive impairment relative to HIV-seronegative (HIV–) control subjects,4 and HIV+ individuals with impaired motor speed also have abnormal uptake of cerebral tracers (i.e., HMPAO).16 However, the failure to find differences between HIV-infected individuals with and without cognitive impairment presents something of an interpretive difficulty16 and may reflect limitations in sensitivity or spatial resolution of SPECT relative to other functional imaging modalities.
PET imaging has also been used to measure regional cerebral glucose metabolism in HIV+ subjects. Hypermetabolism of the basal ganglia and thalamus was observed in patients with mild cognitive impairment; more severe cognitive impairment was associated with both cortical and subcortical hypometabolism.17,18 This work has been replicated and extended, and the initial observation that “early” HIV disease was marked by striatal hypermetabolism was confirmed.19 This later fluorodeoxyglucose-PET study is particularly important because it identified two distinct metabolic components. One was a nonspecific indicator of cerebral dysfunction and correlated with cerebral atrophy. The second was striatum-specific and appeared related to early CNS manifestation of infection. This finding suggests the possibility of two distinct pathways by which cognitive dysfunction may be manifested.
These studies focused on patients while at rest; that is, the subjects are lying still, sometimes with eyes closed,17 and their cognitive states are generally unknown. This is important because among patients with Alzheimer's disease, for example, the pattern of cerebral blood flow at rest did not predict the relative cerebral blood flow (relCBF) changes observed during performance of a memory task.20,21 Therefore, additional information may be derived from studying HIV-infected patients, with and without cognitive impairment, while they are performing a demanding cognitive task. The present report describes the results of a study of the relCBF of HIV+ patients while they were performing auditory-verbal short-term memory tasks.22 By comparing and contrasting the changes in relCBF between conditions, it is possible to infer which brain regions might be functionally impaired in these patients.
METHODS
Subjects
The cases for this study were gay or bisexual males enrolled in the Allegheny County Neuropsychiatric Survey, a study of the nature and extent of neuropsychological abnormalities among HIV+ individuals seeking primary medical care.23 All study participants signed informed consent forms before enrolling in this PET study. Nine subjects were recruited based on their having met the criteria for minor cognitive motor disorder (MCMD). Specifically, all of the subjects had deficits in two or more areas of cognitive function sufficiently severe to interfere “at least mildly” in day-to-day functioning.1,24 This criterion required measured impairments on neuropsychological tests in two cognitive domains (greater than two standard deviation units below the expected score based on education-corrected cutoffs), as well as reports of altered activities of daily living from our modification of the Patients' Assessment of Functioning questionnaire.25 None of these subjects had a history of stroke, head injury, or CNS infection or neoplasm, as determined by a careful clinical history, and they did not have focal findings on neurological exams. All of the subjects had AIDS by the 1993 Centers for Disease Control and Prevention (CDC) criteria.26 At the time that these scans were undertaken (ca. 1994–1995), protease inhibitors were not available; all MCMD subjects were medicated with combinations of zidovudine, ddC, and/or ddI.
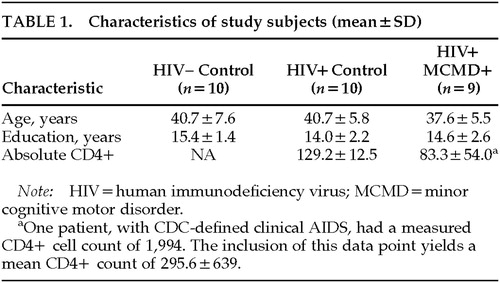
Two groups of gay/bisexual male control subjects were recruited. The first included 10 HIV+ subjects of equivalent age, education, and stage of infection (determined by level of AIDS symptoms and CD4+ cell count) to the MCMD cases. The second control group included 10 HIV– subjects who were also equivalent to the HIV+ MCMD subjects in age and education. None of the subjects (cases or control subjects) had histories of significant psychiatric disorders, including substance abuse. Demographic characteristics of the participants are shown in Table 1. Follow-up of the cases and control subjects revealed that 3 of the 10 HIV+ control subjects have died; of the 9 MCMD patients, 2 have died and 2 went on to develop HIV-associated dementia.
PET Procedures
Studies of relative cerebral blood flow were performed at the University of Pittsburgh Medical Center PET Facility, using a Siemens 951R/31 scanner. Each subject was scanned eight times, measuring relCBF by using oxygen-15 water with standard laboratory procedures.20,22 The subjects were placed in the supine position on the Siemens scanning table and an antecubital intravenous catheter was placed in the left arm for radiopharmaceutical injection. The head was positioned within the head holder and a softened thermoplastic mask was fitted over the face, molded to the patient's facial contours, and fastened to the head holder. The PET gantry was rotated and tilted such that the lowest imaging plane was parallel to, and approximately 1.5 cm to 2 cm above, the canthomeatal line. Transmission scanning was done in all PET studies prior to radiopharmaceutical injection, using three rotating rod sources of 68Ge/68Ga.
For all of the studies, data were acquired with the scanner septa in place, i.e., in 2-D mode. Measurements of relCBF were made after an intravenous bolus injection of 35–40 mCi of oxygen-15 water in approximately 5 to 7 ml of saline.27,28 Beginning approximately 20 seconds after the point when activity began to enter the brain (to allow for partial clearance of the oxygen-15 water from vascular structures), we began a 60-second sampling frame, which was used as the qualitative map of cerebral blood flow.29
The PET data were aligned and further spatially transformed, within group, to a standard template. Each PET image from each subject was aligned within-subject30 and oriented to a single vertical, midsagittal plane.31 These images were then converted into a standard reference space based on the Talairach and Tournoux stereotactic atlas (STA).32 The resulting image data were convolved with a three-dimensional Gaussian filter (16×16×12 mm, full-width at half-maximum) to suppress noise (matched-filter theorem). Differences in global activity within and between subjects were removed by analysis of covariance (ANCOVA) on a pixel-by-pixel basis with global counts as the covariate and the regional activity across subjects for each task as treatment. For each pixel in STA space, the ANCOVA generated a condition-specific relCBF (normalized to 50 ml–1·100 ml–1·min) and an associated variance. The comparison across the selected conditions was done by using the t statistic, with the resulting values constituting the statistical parametric map (SPM).33 The critical level of alpha was set at 0.001 for all within-group comparisons and 0.01 for all between-group comparisons.
Memory Task Procedures
During the first and last scans, the subjects were instructed to lie still and fix their gaze on a cross-hair target on a video screen suspended over their head and perpendicular to their line of vision (“Fixation” condition). During the remaining six scans, the subjects were tested on single-word repetition (1WR), three-word repetition (3WR), and twelve-word free recall (12WR). The scan order was counterbalanced and fixed for all subjects: Fixation, 1WR, 3WR, 12WR, 12WR, 3WR, 1WR, and Fixation.
At the PET facility the subjects were given a training session for all of the memory tasks. A tape-recorded presentation of the instruction sets as well as practice memory lists were presented until the subjects felt comfortable with all of the procedures. Of particular importance was the fact that we instructed the subjects that the tasks did not require serial recall; that is, the words could be recalled in any order. For all activation conditions, the auditory-verbal memory tasks were started 20 seconds prior to the injection of the oxygen-15 water, so that at the beginning of the 60-second scanning frame all subjects had completed at least one complete presentation-recall condition (including the 12WR task).
The words were presented via a tape recorder and read at a rate of one word per second. For the 1WR and 3WR tasks, 1 and 3 seconds were allowed for recall, respectively. For the 12WR task, 12 seconds were permitted. The words were all high-frequency English nouns 2 to 3 syllables in length. No words or word lists were repeated within or between scans. A total of 72 words were presented in each 1WR condition, 75 in each 3WR (25 lists), and 72 in each 12WR (6 lists). The subjects' responses were recorded on audiotape for later scoring.
Statistical Analyses
All data were processed by using SPM95, implementing the multisubject and multistudy (with differences in contrasts across studies) designs (α=0.001). One limitation of SPM95 is that the multistudy design does not permit between-group comparison of individual states (e.g., comparing resting blood flow between patients and control subjects). In order to make a comparison between subject groups in the same state, it was necessary to sum the relevant images to create one scan per subject per condition. These data were then analyzed by using the single-subject design of SPM95, with the individual scans weighted appropriately to permit direct between-group comparisons. However, this method results in a significant reduction in power, and thus the threshold for determining statistical significance was set at α=0.01.
Finally, in order to understand the relationships among the brain regions activated during the performance of these tasks, and whether there were differences in these relationships between groups, we examined the functional connectivity among brain regions.21,34–36 Whereas t-tests (and associated methods) are useful for determining regional activity that occurs above a given threshold (functional specialization), a network of functionally associated regions may exist within the dataset and can be revealed by analyses that emphasize functional integration.34 An analysis that focuses on the pattern of regional covariation of relCBF, a procedure similar to principal components analysis, was used here. We extended this analysis to find the pattern of distributed activity that was most prevalent in one subject group (e.g., HIV– control subjects) and least prevalent in another (e.g., HIV+ MCMD patients).35,36
RESULTS
Task Performance
The performance of the subjects on the 1WR and 3WR tasks did not differ between any pairs of groups (all P>0.10). However, there were significant differences between groups in terms of their performance on the 12WR tasks while in the scanner. The number of total words recalled differed between groups (F=7.60, df=2,28, P=0.0025), with the MCMD patients recalling significantly fewer words than either the HIV– or HIV+ control subjects (Tukey's least significant difference [LSD] test, P<0.05). Regarding long-term memory capacity, which was estimated from the middle four positions of the serial position curve, there was also a significant effect of subject group (F=8.677, df=2,28, P=0.0013). However, in this case, the performance of the HIV– subjects differed from that of the HIV+ control subjects, and both groups also differed from the MCMD patients (LSD, P<0.05).
Within-Group PET Comparisons
Comparing the 3WR conditions with Fixation is expected to show the demands on working memory, as well as the sensory, motor, and linguistic components of the tasks. Comparing the 12WR (supraspan) task with 3WR and 1WR (subspan) tasks should identify those brain regions associated with the increasing memory demands of the 12WR tasks; motor, sensory, and basic linguistic demands of the two sets of tasks are equivalent. The results of these sets of contrasts will be described in turn for the HIV– and HIV+ control subjects and the HIV+ MCMD subjects.
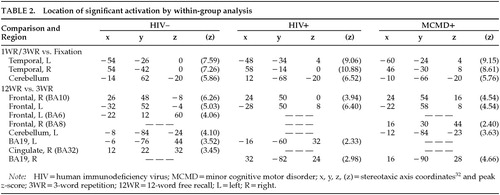
Subspan Tasks vs. Fixation: Relative to visual fixation, performing the 3WR and 1WR tasks resulted in strikingly similar activation in all three groups. Increases in relCBF were found bilaterally over the superior temporal cortex, the postcentral gyrus, and the cerebellar hemispheres (Figure 1 and Table 2).
Supraspan vs. Subspan Tasks: Among the HIV– control subjects, performance on the 12WR task relative to the 3WR and 1WR tasks (combined) activated the middle frontal gyrus (BA10) bilaterally and symmetrically, extending on the left into the superior frontal gyrus (BA9). (See Figure 1, lower left, and Table 2.) There was a smaller area of activation in the precuneus (BA19), primarily on the left. Among the HIV+ control subjects, there was a similar pattern of activity surrounding BA10 on the left and extending up to include the cingulate. The middle frontal gyrus was activated bilaterally, but BA9 was activated only on the left. There was also significant activation of the precuneus.
By contrast, among the HIV+ MCMD subjects a rather different pattern emerged (Figure 1, lower right). Although there was activation in the prefrontal cortex, it was primarily on the right and involved patchy areas of BA8 and BA10. There was activation of BA8 on the left as well as bilateral activation of visual area BA19.
Between-Group Comparisons
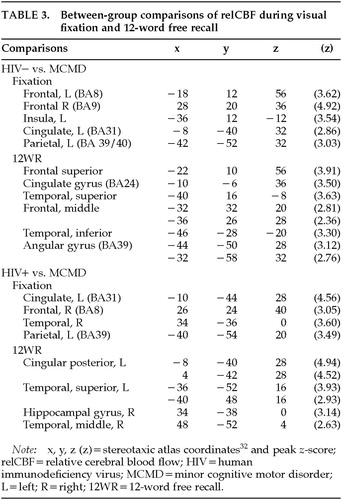
Baseline: Differences between groups were observed during the resting fixation state (Figure 2, top row, and Table 3). The relCBF of the MCMD patients differed significantly from that of both the HIV– and HIV+ control subjects. Although the relCBF of the MCMD patients was not reliably greater than that of either control group (areas were small, <20 voxels, with small differences, z<3.00), the relCBF of the control subjects was greater than that of the patients in several brain regions. The MCMD patients had significantly lower blood flow at rest in the region of the posterior cingulate, right dorsolateral prefrontal cortex, and left parietal lobe (BA39/40) relative to both control groups.
Supraspan Recall: We completed a similar between-group contrast using data from the 12WR condition (see Figure 2, bottom row, and Table 3). The HIV– control subjects had significantly greater relCBF than the MCMD patients in the left dorsal and inferior frontal cortices. There was also a significant difference in the inferior temporal lobe (BA20) on the left, as well as the left angular gyrus. The MCMD patients had lower relCBF than the HIV+ control subjects in the middle and posterior cingulate cortex while performing the 12WR task. There was also a significant difference found in the left parietal and temporal cortices.
Comparisons of Responses to Task Demands: Qualitative analysis revealed differences in the regional activation attributed to the 12WR task (relative to the combined 3WR/1WR tasks) between the HIV+ MCMD patients and the control subjects (see above), as well as differences between the combined 3WR/1WR tasks relative to Fixation (Table 4). In order to directly test these differences, we used the multistudy, multisubject design of SPM95. By properly weighting the individual scans for the groups of subjects being compared (only two groups can be tested at one time), it was possible to test the hypothesis that there was a significant difference in the change in relCBF between pairs of conditions (e.g., 12WR and 3WR/1WR) in one group relative to another (P<0.01).
Relative to the MCMD patients, the HIV– control subjects showed significantly larger increases in relCBF around the central sulcus on the right and the left posterior cingulate in the Subspan vs. Fixation contrasts (see Figure 3, top left panel). Further, the HIV– control subjects had greater changes in relCBF relative to the MCMD patients in the inferior frontal cortex (BA9/40/45) on the left during the 12WR task relative to the 3WR/1WR conditions (see Figure 3, bottom left).
A similar pattern was seen when we compared the Subspan and Fixation conditions between the HIV+ control subjects and MCMD patients. That is, there was a consistently greater change in the HIV+ control subjects in the region of the right central sulcus (predominantly precentral gyrus). There was also a region of activity in the most dorsal extent of the hippocampal formation on the right. When we compared the 12WR and 3WR/1WR conditions in the HIV+ and MCMD subjects, we again saw the relative difference in the left inferior frontal cortex, BA44/45. There was also a significant difference between groups in the anterior cingulate, bilaterally.
Functional Connectivity
We next considered the functional connectivity among systems. We wanted to find a pattern of activation that captured the largest amount of functional connectivity of the HIV– control subjects that was relatively minimal in the HIV+ MCMD patients. That is, we were interested in the pattern of connectivity that was maximally expressed in the HIV– control subjects and minimally expressed in the HIV+ control subjects and (separately) the MCMD patients. In order to do this, we needed to identify an eigenimage that reflected the most functional connectivity in the HIV– control subjects relative to each of the other two groups of subjects, in separate data analyses. The generalized eigenimage is essentially a single pattern that maximizes the ratio of the 2-norm when applied to the data from the pairs of groups of subjects. (For a detailed discussion, see Friston.36)
We completed a principal components analysis on the data from the 9 HIV– control subjects and the HIV+ (not MCMD) subjects and identified the eigenimage that reflected the most functional connectivity in the HIV– subjects relative to the HIV+ control group. This eigenimage is obtained by using a generalized eigenvector solution consisting of two functional connectivity matrices.
As we might have predicted from the results of the contrasts between the HIV– and HIV+ groups, the maximal differences between groups were obtained with a pattern of functionally connected regions that was similar to that seen in other normal control groups (Figure 4, left panels). (See also Herbster et al.21) The positive loadings included the superior temporal cortex and the parietal cortex bilaterally—a functional unit associated with subspan recall (i.e., 1WR or 3WR). The negative loadings were highest on the convexity of the frontal cortex, as well as the posterior parietal cortex and the posterior cingulate. This functional unit appears most related to recall of longer word lists (i.e., 12 words). This eigenimage is less expressed in the HIV+ control subjects relative to the HIV– control subjects, and this is shown in the bar graph at the bottom of the figure. The amount of individual functional connectivity attributable to the eigenimage for both groups is expressed by using the appropriate 2-norm.
For the generalized eigenimage analysis involving the HIV– control subjects and MCMD patients, the pattern appears different (see Figure 4, right panels). The functional units that maximize the difference between the subjects are different from those seen in the previous analysis. The positive loadings include a distributed system of cortical regions; the negative loadings include the anterior and posterior cingulate cortex and the medial temporal lobe, bilaterally.
DISCUSSION
These data make several points relevant to our understanding of the nature and extent of the cognitive dysfunction associated with HIV infection and AIDS. We did not observe differences in relCBF between any pairs of groups in regions of the basal ganglia; rather, we saw consistent alterations in cortical function between groups. Compared with appropriate control subjects, the relCBF of HIV+ MCMD subjects was relatively normal when they performed subspan auditory-verbal STM tasks. This finding is consistent with neuropsychological data that demonstrate that in nondemented cognitively impaired HIV+ subjects, attentional and lower-level working memory functions are normal. By contrast, performance of a 12-word verbal free recall task produced markedly abnormal relCBF among the HIV+ MCMD subjects. Specifically, there was significantly less activity across the prefrontal cortex relative to the control subjects and an increase in relCBF posteriorly.
An analysis of the differences between the activations (i.e., subspan vs. fixation; supraspan vs. subspan) further reveals the differences between groups. Perhaps most prominent was the consistent failure of the MCMD subjects to activate the cingulate cortex to the same extent as the HIV– control subjects. Further, unlike the findings from our study of Alzheimer's disease patients, we did not observe a normal pattern of activation in the MCMD patients; they did not show the “typical” increase in frontal cortical activity with the longer lists.22,37
The generalized eigenimage analysis bears directly on these points. The idea underlying this analysis is that the symptoms of memory loss in MCMD are best understood in terms of the breakdown of a functionally integrated system. Thus, there are both regionally specific pathologies and pathology of interactions (see Friston36). There is a first-order effect of impaired activation of the frontal cortex that can be seen in Figures 1, 2, and 3. The second-order effect, shown in Figure 4, exists in the relationship between the activity in the full extent of the cingulate cortex and a distributed cortical system including the frontal lobes.
Abnormal functional activation of the cingulate cortex in the MCMD patients involves the entire anterior-to-posterior extent. Consistently lower relCBF in the posterior cingulate cortex, most notably the retrosplenial cortex, is most likely related to the poor performance by the MCMD patients on the memory tasks. (See Mesulam,38 pp. 177ff, for discussion.) However, the anterior and middle portions of the gyrus, the paralimbic cortex, were also abnormally affected in the MCMD patients relative to the control subjects. The functions of these regions are frequently associated with drive and directed attention, and lesions to the anterior cingulate can result in apathy syndromes.38 Given that one of the features of the neurobehavioral syndromes in HIV-infected individuals is reduced drive and flattened affect,39 the functional abnormality in the cingulate cortex may be a core component of the syndrome.
These data are provocative when seen in the light of previous PET studies of metabolic abnormalities observed while subjects are at rest. In those studies,17–19 significant increases in glucose metabolism were measured in the basal ganglia of HIV+ subjects who were mildly affected, with a decrease in metabolism in more advanced cases. Detailed analysis of these data19 further revealed that two factors (extracted using a subprofile scaling model) accounted for the patterns of glucose metabolism in their demented patients; one was related to basal ganglia function, and the other to cortical function. The eigenimage solution presented here between the control subjects and MCMD patients also reflects alterations in general function, providing independent confirmation of Rottenberg's results using different imaging techniques and different statistical analyses.
There are several limitations to this study that must be kept in mind. First, although the MCMD patients underwent extensive neurobehavioral evaluation, this did not include MR studies to rule out occult or subclinical infections or neoplasms. However, none of these patients had developed such CNS syndromes one year after scanning. Second, the absence of structural MR studies meant that we relied on fitting the PET images to a standard reference, and we could not correct for atrophy.40,41 We have successfully fit other brains, as we did here, to the standard STA,20 and all of the images did, in fact, align. However, our inability to perform atrophy correction might have had an impact on the analysis involving the HIV– control subjects. That is, the presence and degree of atrophy (expected to be relatively mild in these patients) appear more closely related to clinical stage than to the presence of cognitive dysfunction.42 Given that the two groups of HIV-infected subjects (patients and control subjects) were matched for clinical stage, comparisons between these groups should be relatively less affected. Nevertheless, it remains the case that atrophy correction is important in studies of progressive, generalized dementia syndromes and should be considered in further research. Third, the generalized eigenimage analysis, while important as used here, does not provide the opportunity to use inferential statistics. Other multivariate procedures do permit statistical inference and may be useful for further exploration of these types of functional imaging data.36,43
Finally, because we did not sample arterial blood or arterialized venous blood to measure oxygen-15 (and thus calculate absolute relCBF), we used the standard procedure of normalizing all blood flows to 50 ml–1·100 ml–1·min. There is a potential confound of cross-group comparisons using these techniques, stemming from the inability to directly measure whether the groups have similar whole brain activity (e.g., one group may not be globally depressed compared with another). Thus, it may be the case that regions of what appear to be locally decreased CBF compared with global CBF in the MCMD patients could actually represent areas of less increase if the MCMD patients had increased brain CBF and activity in all other regions (almost the entire brain) compared with the control groups. However, there is no reason to believe that the MCMD patients would have such increased global activity.4,16–19 Furthermore, even if a global change existed, the observation that certain regions in the MCMD group were not increased to the same degree as the global change remains relevant, since those regions can still be identified as having less activity than expected and may thus represent similar physiology as areas of functional decreases.
The subjects in the present study, although clearly cognitively impaired, did not meet criteria for HIV-associated dementia (HAD). The fact that we failed to find subcortical hyperperfusion using the oxygen-15 water technique may be due to a variety of factors related to technology and data analysis. This is the first such functional PET study with cognitive activation that we are aware of (see review44), and thus we have few data with which to compare and contrast. Our findings that cortical function is affected even in these nondemented subjects, however, is most likely a result of the fact that this study examined blood flow while the subjects were performing a challenging memory task. Thus, although HIV+ patients may show cortical dysfunction at rest only in more advanced stages, when they are tested in an activated state (as here), the distributed abnormality can be identified even before the subjects meet criteria for HAD.
At present there is no clear consensus as to the underlying pathophysiology of HAD, and the causes of MCMD are even less clear. Some of the subjects in the present study (3/10) went on to diagnosed HAD; the remainder did not. Thus, even within this group of patients who met specific diagnostic criteria for MCMD, there is most likely heterogeneity with regard to the causes of the cognitive dysfunction. Unfortunately, limitations in the statistical power of our study preclude an examination of differences within the MCMD group; however, multivariate analysis of cognitively impaired HIV+ subjects is most likely to help differentiate among the factors that contribute to the neuropsychological impairment. Indeed, we would speculate that the combined information from structural, functional, and spectroscopic in vivo procedures may be most helpful in the attempts to disentangle the various factors that are related to neuropsychological impairment. Further, these tools may also be useful as adjuncts to clinical trials when compounds that can cross the blood–brain barrier are developed.
ACKNOWLEDGMENTS
This research was supported in part by funds from the National Institute of Mental Health (MH45311) and the NIMH-funded Center for Functional Brain Imaging (MH49815). J.T. Becker was supported by a Research Scientist Development Award–Level II (KO2-MH01077), and C. Buechel by the Wellcome Trust. Portions of these data were presented at the annual meeting of the International Neuropsychological Society (Chicago, February 1996). M.A. Mintun is now at the Mallinkrodt Institute of Radiology, Washington University, St. Louis, MO.
 |
 |
 |
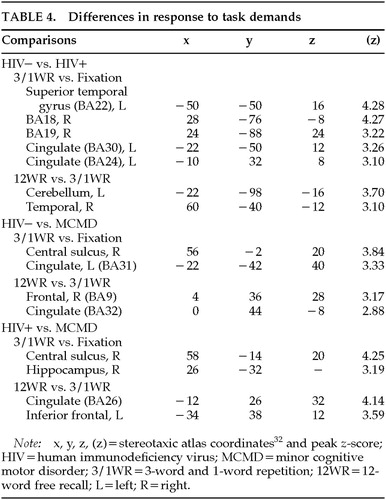 |

FIGURE 1. Results of SPM95 analysis of Subspan-Fixation contrast and Supraspan-Subspan contrast for all three study groupsEach image contains three views of all significant voxels seen as “look-through” images in three anatomical planes: coronal, sagittal, and axial. HIV=human immunodeficiency virus; MCMD=minor cognitive motor disorder; Subspan=3-word and 1-word repetition; Fixation=baseline resting visual fixation; Supraspan=12-word free recall.
FIGURE 2. Results of comparisons between groups during Fixation and 12WR conditionsHIV=human immunodeficiency virus; MCMD=minor cognitive motor disorder; Fixation=baseline resting visual fixation; 12WR=12-word free recall.
FIGURE 3. Differences between contrasted statesHIV=human immunodeficiency virus; MCMD=minor cognitive motor disorder; Subspan=3-word and 1-word repetition; Fixation=baseline resting visual fixation; Supraspan=12-word free recall.
FIGURE 4. Results of generalized eigenimage analysisSee text for details. HIV=human immunodeficiency virus; MCMD=minor cognitive motor disorder; subjects 10–19=HIV+; subjects 20–29=MCMD.
1 McArthur JC, Grant I: HIV neurocognitive disorders, in Neurology of AIDS, edited by Gendelman HE, Lipton SA, Epstein L, et al. New York, Chapman and Hall, 1997, pp 499–523Google Scholar
2 Budka A: Neuropathology of human immunodeficiency virus infection. Brain Pathol 1991; 1:163–175Crossref, Medline, Google Scholar
3 Budka H, Wiley CA, Kleihues P: HIV-associated disease of the nervous system: review of nomenclature and proposal for neuropathology-based terminology. Brain Pathol 1991; 1:143–152Crossref, Medline, Google Scholar
4 Sacktor N, Prohovnik I, Van Heertum RL, et al: Cerebral single-photon emission computed tomography abnormalities in human immunodeficiency virus type 1–infected gay men without cognitive impairment. Arch Neurol 1995; 52:607–611Crossref, Medline, Google Scholar
5 Achim CL, Wang R, Miners DK, et al: Brain viral burden in HIV infection. J Neuropathol Exp Neurol 1994; 53:284–294Crossref, Medline, Google Scholar
6 Masliah E, Achim CL, Ge N, et al: Spectrum of human immunodeficiency virus–associated neocortical damage. Ann Neurol 1992; 32:321–329Crossref, Medline, Google Scholar
7 Wiley CA, Achim C: Human immunodeficiency virus encephalitis is the pathological correlate of dementia in acquired immunodeficiency syndrome. Ann Neurol 1994; 36:673–676Crossref, Medline, Google Scholar
8 Martin A: HIV, cognition, and the basal ganglia, in Neuropsychology of HIV Infection, edited by Grant I, Martin A. New York, Oxford University Press, 1994, pp 234–259Google Scholar
9 Becker JT, Caldararo R, Lopez OL, et al: Qualitative features of the memory deficit associated with HIV infection and AIDS: cross-validation of a discriminant function classification scheme. J Clin Exp Neuropsychol 1995; 17:134–142Crossref, Medline, Google Scholar
10 Peavy G, Jacobs D, Salmon DP, et al: Verbal memory performance of patients with human immunodeficiency virus infection: evidence of subcortical dysfunction. J Clin Exp Neuropsychol 1994; 16:508–523Crossref, Medline, Google Scholar
11 Martin EM, Sorensen DJ, Edelstein HE, et al: Decision-making speed in HIV-1 infection: a preliminary report. AIDS 1992; 6:109–113Crossref, Medline, Google Scholar
12 Aylward EH, Henderer JD, McArthur JC, et al: Reduced basal ganglia volume in HIV-1–associated dementia: results from quantitative neuroimaging. Neurology 1993; 43:2099–2104Google Scholar
13 Dal Pan JG, McArthur J, Aylward E, et al: Patterns of cerebral atrophy in HIV-1–infected individuals: results of a quantitative MRI analysis. Neurology 1992; 42:2125–2130Google Scholar
14 Aylward EH, Brettschneider PD, McArthur JC, et al: Magnetic resonance imaging measurement of gray matter volume reductions in HIV dementia. Am J Psychiatry 1995; 152:987–994Crossref, Medline, Google Scholar
15 Hestad K, McArthur JH, Dal Pan GJ, et al: Regional brain atrophy in HIV-1 infection: association with specific neuropsychological test performance. Acta Neurol Scand 1993; 88:112–118Crossref, Medline, Google Scholar
16 Sacktor N, Van Heertum RL, Dooneief G, et al: A comparison of cerebral SPECT abnormalities in HIV-positive homosexual men with and without cognitive impairment. Arch Neurol 1995; 52:1170–1173Google Scholar
17 Rottenberg D, Moeller J, Strother S: The metabolic pathology of the AIDS dementia complex. Ann Neurol 1987; 22:700–706Crossref, Medline, Google Scholar
18 Van Gorp WG, Mandelkern M, Gee M, et al: Cerebral metabolic dysfunction in AIDS: findings in a sample with and without dementia. J Neuropsychiatry Clin Neurosci 1992; 4:280–287Link, Google Scholar
19 Rottenberg DA, Sidtis JJ, Strother SC, et al: Abnormal cerebral glucose metabolism in HIV-1 seropositive subjects with and without dementia. J Nucl Med 1996; 37:1133–1141Google Scholar
20 Becker JT, Mintun MA, Aleva K, et al: Compensatory reallocation of brain resources supporting verbal episodic memory in Alzheimer's disease. Neurology 1996; 46:692–700Crossref, Medline, Google Scholar
21 Herbster AN, Nichols T, Wiseman MB, et al: Functional connectivity in auditory verbal short-term memory in Alzheimer's disease. Neuroimage 1996; 4:67–77Crossref, Medline, Google Scholar
22 Becker JT, Mintun MA, Diehl DJ, et al: Functional neuroanatomy of verbal free recall: a replication study. Human Brain Mapping 1994; 1:284–292Crossref, Medline, Google Scholar
23 Becker JT, Sanchez J, Dew MA, et al: Neuropsychological abnormalities among HIV-infected individuals in a community-based sample. Neuropsychology 1997; 11:592–601Crossref, Medline, Google Scholar
24 American Academy of Neurology: Nomenclature and research case definitions for the neurological manifestations of human immunodeficiency virus type-1 infection. Neurology 1991; 41:778–785Crossref, Medline, Google Scholar
25 Heaton RK, Pendelton MG: Use of neuropsychological tests to predict adult patients' everyday functioning. J Consult Clin Psychol 1981; 49:307–321Crossref, Google Scholar
26 Centers for Disease Control and Prevention:1993 Revised classification system for HIV infection and expanded surveillance case definition for AIDS among adolescents and adults. MMWR 1992; 41:1–19Google Scholar
27 Herscovitch P, Markham J, Raichle ME: Brain blood flow measured with intravenous H215O, I: theory and error analysis. J Nucl Med 1983; 24:782–789Medline, Google Scholar
28 Raichle ME, Martin WRW, Herscovitch P: Brain blood flow measured with intravenous H215O, II: implementation and validation. J Nucl Med 1983; 24:790–798Medline, Google Scholar
29 Fox PT, Mintun MA: Noninvasive functional brain mapping by change-distribution analysis of averaged PET images of H215O tissue activity. J Nucl Med 1989; 30:141–149Medline, Google Scholar
30 Woods RP, Cherry SR, Mazziotta JC: Rapid automated algorithm for aligning and reslicing PET images. J Comput Assist Tomogr 1992; 16:620–633Crossref, Medline, Google Scholar
31 Miroshima S, Berger KL, Lee KS, et al: An automated method for rotational correction and centering of three-dimensional functional brain images. J Nucl Med 1992; 33:1579–1585Google Scholar
32 Talairach J, Tournoux P: Co-planar Stereotactic Atlas of the Human Brain:3-Dimensional Proportional System: An Approach to Cerebral Imaging. New York, Thieme Medical, 1988Google Scholar
33 Friston KJ: Statistical parametric mapping: ontology and current issues. J Cereb Blood Flow Metab 1995; 15:361–370Crossref, Medline, Google Scholar
34 Friston KJ, Frith CD, Liddle PF, et al: Functional connectivity: the principal-component analysis of large (PET) data sets. J Cereb Blood Flow Metab 1993; 13:5–14Crossref, Medline, Google Scholar
35 Friston KJ, Frith CD: Schizophrenia: a disconnection syndrome? Clin Neurosci 1995; 3:89–97Google Scholar
36 Friston KJ: Characterizing distributed functional systems, in Human Brain Function, edited by Frackowiak RSJ, Friston KJ, Frith CD, et al. San Diego, CA, Academic Press, 1997, pp 107–126Google Scholar
37 Nichols TE, Palmer A, Becker JT, et al: Meta-analysis of auditory verbal short-term memory using positron emission tomography (abstract). Neurology 1996; 46:A430Google Scholar
38 Mesulam M-M: Principles of Behavioral Neurology. Philadelphia, FA Davis, 1985Google Scholar
39 Navia BA, Jordan BD, Price RW: The AIDS dementia complex, I: clinical features. Ann Neurol 1986; 19:517–524Crossref, Medline, Google Scholar
40 Meltzer CC, Bryan RN, Holcomb HH, et al: A method of anatomical localization for positron emission tomography using magnetic resonance imaging. J Comput Assist Tomogr 1990; 14:418–426Crossref, Medline, Google Scholar
41 Meltzer CC, Leal JP, Mayberg HS, et al: Correction of PET data for partial volume effects in human cerebral cortex by magnetic resonance imaging. J Comput Assist Tomogr 1990; 14:561–570Crossref, Medline, Google Scholar
42 Di Sclafani V, Mackay RDS, Meyerhoff DJ, et al: Brain atrophy in HIV infection is more strongly associated with CDC clinical stage than with cognitive impairment. J Int Neuropsychol Soc 1997; 3:276–287Crossref, Medline, Google Scholar
43 Buechel C, Friston KJ: Characterizing functional integration, in Human Brain Function, edited by Frackowiak RSJ, Friston KJ, Frith CD, et al. San Diego, CA, Academic Press, 1997, pp 127–140.Google Scholar
44 Navia BA, Gonzalez RG: Neuroimaging of AIDS, II: functional imaging of the AIDS dementia complex and the metabolic pathology of the HIV-1–infected brain. Neuroimaging Clin N Am 1997; 7:431–445Medline, Google Scholar