Prefrontal Cortex Modulation of Mood and Emotionally Induced Facial Expressions
Abstract
Repetitive transcranial magnetic stimulation (rTMS) can serve as a tool to experimentally test hypotheses of prefrontal cortex (PFC) modulation of emotions. The present study used rTMS to test whether self-rated mood and emotionally induced facial expressions are hemispherically lateralized depending on their valence, as indicated by previous studies. Healthy volunteers underwent mood self-rating and computerized analysis of emotionally induced facial expressions before and after rTMS of left or right PFC. Facial expression analysis revealed lateralized changes of facial expressions after rTMS, whereas changes of subjective mood ratings did not show a hemispheric lateralization. On the basis of this study, the authors propose to combine rTMS and facial expression analysis for further studies of the cortical modulation of emotions in humans.
The prefrontal cortex (PFC) is known to be involved in basal ganglia–thalamocortical circuits mediating mood and emotions in humans.1–3 A large body of evidence derived from neuroimaging and neuropsychological studies suggests that abnormalities of PFC function play a role in the pathophysiology of affective disorders, such as major depression.4–6 Therefore, it might be clinically relevant to understand how the PFC modulates emotions in healthy volunteers and patients with affective disorders. Several models have been proposed to explain how the brain mediates emotions. One model (the “valence model”) states that emotions are mediated differently depending on their valence, with positive emotions being mediated by the left and negative emotions by the right hemisphere.1 Although originally based on lesion studies, this notion was recently supported by studies applying repetitive transcranial magnetic stimulation (rTMS) as a noninvasive tool to focally stimulate cortical areas.7
In depressed patients, fast rTMS of the left dorsolateral prefrontal cortex (DLPFC), which is thought to augment cortical activity, or slow rTMS of the right DLPFC, which is thought to inhibit cortical activity, have been successfully applied as antidepressant treatment.8–10 In mania, fast rTMS of the right PFC appears to exert therapeutic effects.8
In healthy volunteers, fast rTMS of the DLPFC has also been demonstrated to modulate mood differently depending on which side was stimulated.11–13 Stimulation of the left DLPFC produced a mild increase in self-rated sadness11–13 and rTMS of the right DLPFC produced a mild increase in self-rated happiness.12,13 Therefore, the mood effects of rTMS in healthy volunteers showed the opposite laterality to those seen in patients with major depression. Although previous studies reported mood effects, they did not address the question of whether the expression of emotions, which is altered in affective disorders,14 is modulated differently by the left and right PFC. To clarify the contrasting results in healthy subjects and depressed patients, it seems worthwhile to study rTMS effects on emotions of healthy volunteers at both sides by subjective mood rating as well as an objective behavior measure.
The aim of the present study was to explore rTMS-induced changes of both self-rated mood and facial expressions, which—in contrast to self-rated mood changes—can be objectively measured by applying a computerized three-dimensional movement analysis system with high spatial and temporal resolution. The measurement of facial expressions is based on the idea that emotional states are expressed by motor activity such as locomotor activity, gestures, or facial expressions in humans.15 Facial expressions can finely and specifically indicate inner emotional states under normal conditions and in psychiatric disorders.16,14 Using facial expression analysis in conjunction with subjective mood rating, we assessed laughing reactions in healthy volunteers during an emotion-induction paradigm, to investigate 1) whether previous findings of TMS-induced mood changes can be replicated and 2) whether emotionally induced facial expressions indicate such lateralized changes of emotional valence.
METHODS
Subjects
We included 9 right-handed healthy volunteers (5 men and 4 women) between 24 and 38 years of age (mean=29.8 yr, SEM=1.3). Informed consent was obtained after the procedures had been fully explained. The study was approved by the local ethics committee. All subjects met the current international safety criteria for rTMS.17 They were not paid and were screened by an extensive interview to exclude any psychiatric or somatic disorder as well as medication and drug use. Subjects were naive to rTMS. They were not aware of the hypotheses on regional brain function of mood regulation, and the investigators did not mention their hypothesis so as to avoid prejudicing the volunteers.
Experimental Design
In a randomized, crossover design, subjects were treated consecutively with two different rTMS conditions (rTMS of left or right DLPFC), which were separated by approximately 30 minutes. Prior to the session, rTMS parameters were determined and subjects had to fill in the Edinburgh Handedness Questionnaire. Mood and facial expressions were monitored by using visual analogue scales (VAS) for self-rating as well as a computerized three-dimensional movement analysis system. VAS were selected to detect mood changes reported in previous studies11–13 and were performed at five time points (before the first rTMS and immediately after and 15 minutes after each rTMS condition). The VAS before rTMS served as common baseline. Facial expressions were movement-analyzed at baseline and after the first and the second rTMS. Furthermore, the investigators documented their observations of the subjects' behavior during each session. No general time effect was detectable over the afternoon. For both VAS rating and facial expression analysis, the factor “time” was additionally controlled by the randomized and counterbalanced study design.
Transcranial Magnetic Stimulation
A Magstim rapid magnetic stimulator (Magstim Company Ltd, Whitland, UK) with a figure-8-shaped 70-mm coil was used for rTMS. Resting motor threshold (RMT) and stimulation sites were determined on a separate day prior to the experimental session. RMT was defined as previously described.11 The assumed positions of the left and right DLPFC were located in the parasagittal plane 5 cm anterior to the optimum scalp position for motor evoked potentials (MEP) of the contralateral abductor pollicis brevis muscle, as in previous studies.11–13 Stimulation was applied at 110% of the individual RMT as in one prior study.11 Each condition consisted of 10 trains at 10 Hz over 5 seconds, and lasted for approximately 5 minutes with an intertrain interval of at least 30 seconds. A total of 500 stimuli per condition was applied as in two prior studies.11,12 Immediately before rTMS, all subjects performed a mental arithmetic task to standardize the experimental situation.
Subjective Mood Rating
Eight VAS were presented as 9-cm lines with an arrow on each end. Each scale measured a different modality given as contrasting terms: mood (good vs. bad, happy vs. sad), emotion (laughing vs. crying), anxiety (calm, secure vs. agitated, anxious), activity (active vs. sluggish), physical condition (well vs. perceiving physical discomfort), self-perception (familiar vs. alien) and general state (good vs. bad). The subjects were asked to transect each line to indicate the subjective rating in each of the categories by following their first inclination. No further instructions were given. Six of the scales were based on previously validated VAS.18
Facial Expression Analysis
Facial expression analysis was performed as previously described.19 Volunteers sat in a comfortable chair and watched short humorous movies (“Mr. Bean”), presented on a television screen. Different movies were shown at baseline and after each rTMS condition. The sequence of movies was random and counterbalanced between subjects. Special microphones of an active measurement device (CMS 70, ZEBRIS Ltd., Tübingen, Germany) recorded high-frequency (35 kHz) ultrasonic signals emitted by markers placed at the right and left angle of the mouth (zygomaticus major et minor, risorius, depressor anguli oris muscles), as well as just below the center of the right and left eye (orbicularis oculi muscle). An additional marker placed on a tape at the forehead served as a reference to differentiate facial from head movements. Spatial resolution was 0.1 mm, temporal resolution was a few milliseconds. Thus, this device allowed even very small and brief movements of the markers in all three dimensions to be recorded exactly and synchronously. The digitalized signals of each ultrasonic marker were graphically represented as a function of space and time, filtered, and corrected for artifacts. Movements of the markers, corresponding to the facial expression “laughing” (controlled by a synchronous video recording of the face) were further analyzed by the software program 3DA. Three main variables were determined: 1) frequency of laughing reactions: number of laughing reactions to the movie, related to the length of the movie (n/min movie); 2) emotional reaction time: time(s) between a funny stimulus in the movie (as defined in a group of healthy volunteers prior to this study) and the reaction in terms of onset of a laughing movement of the left and right angle of the mouth (mean of five funny stimuli per movie); 3) initial velocity of the laughing movement: velocity (cm/s) of each marker at the beginning of a laughing reaction, calculated as slope through the start and maximum (space and time) point of the movement (mean of three). Furthermore, after each recording the volunteers were asked to assess their emotional impression of the movie, using a 9-cm visual analog scale (very funny vs. not funny). To differentiate changes of facial expressions due to the subjects' emotional state from primary motor phenomena, subjects were asked to produce voluntary facial expressions (showing the teeth, closing the eyes), which were separately recorded and analyzed.
Statistics
Mean scores over eight VAS, scores of single VAS, and parameters of facial expression analysis were analyzed separately. Differences from baseline were calculated for left and right prefrontal rTMS; both were compared by using the two-tailed Wilcoxon signed-rank test. The level of significance was taken at P<0.05.
RESULTS
Mood Changes After Left And Right Prefrontal rTMS Did Not Differ by Means of Their Valence
The mean VAS score was significantly increased immediately after left prefrontal rTMS (P=0.02) and had already declined 15 minutes after stimulation (Figure 1). After right prefrontal rTMS, a trend toward increase was found (P=0.07). Mean values and time course were similar for both rTMS conditions. No significant difference between left and right prefrontal stimulation was observed.
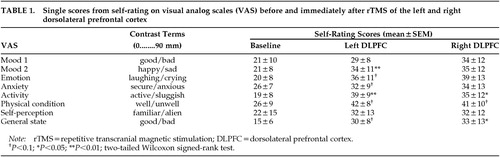
Single VAS scores were significantly altered after rTMS (Table 1). Scores on the Mood 2 and Activity VAS scales showed a statistically significant impairment after rTMS of the left DLPFC (P=0.008 and P=0.004, respectively). Scores of Activity and General State indicated a significant impairment after right prefrontal stimulation (P=0.02 and P=0.01, respectively). Trends toward change were found for several other VAS scales after left or right rTMS (Table 1), without selectivity for stimulation site. Furthermore, investigators' observations of the individual cases were in line with the reported VAS changes.
Facial Expression Analysis Revealed Differential Changes After Left and Right Prefrontal rTMS
Frequency of laughing reactions increased significantly after left prefrontal rTMS (P=0.02) and showed a trend toward a decrease after right prefrontal stimulation (P=0.07). Both rTMS conditions differed significantly in this respect (P=0.008; Figure 2A).
After left prefrontal rTMS, the emotional reaction time was significantly shortened for the left angle of the mouth (P=0.04) and showed a trend toward shortening for the right angle (P=0.06). After right prefrontal rTMS, the emotional reaction time was not significantly prolonged for the left angle of the mouth and showed a trend toward prolongation for the right angle (P=0.07). Again, both rTMS conditions differed significantly regarding these changes (P=0.05; Figure 2B).
Analysis of laughing velocity showed selective rTMS effects for the eye markers, with nonsignificantly decreased velocity after left prefrontal rTMS (mean=–0.8 mm/s, SEM=0.4) and nonsignificantly increased velocity after right prefrontal rTMS (mean=+1 mm/s, SEM=0.6). The comparison of both sides tended toward significance (P=0.08).
The analysis of voluntary facial expressions did not show any significant change after left or right prefrontal rTMS compared with baseline.
DISCUSSION
Left and right prefrontal rTMS altered facial expression parameters in a selective manner. Significant differences between rTMS of the left and the right DLPFC were found for frequency of laughing reactions (increased after left rTMS) and emotional reaction time (shortened after left rTMS). In contrast, VAS scores worsened for both sites, and no statistically significant differences were detected between left and right prefrontal rTMS.
Lateralized changes of mood with a mild increase in self-rated sadness after rTMS of the left DLPFC and a mild increase in self-rated happiness after rTMS of right DLPFC have been reported previously.11–13 Pascual-Leone et al.11 studied 10 healthy volunteers and found a significant increase in self-ratings of sadness and a significant decrease in self-ratings of happiness immediately after rTMS of the left DLPFC, as compared with right prefrontal and midfrontal stimulation. In another study on 10 healthy subjects, five stimulation sites were compared: left DLPFC, right DLPFC, midfrontal cortex, occipital cortex and cerebellum.12 The comparison of left and right DLPFC revealed significant differences between the hemispheres, with decreased happiness after left and decreased sadness after right prefrontal rTMS. In a third study, a significant decrease in happiness and a nonsignificant increase in sadness were found after left compared with right prefrontal stimulation in 9 healthy subjects.13
In the present study, we only partially replicated prior findings and did not observe a clear lateralization of rTMS-induced mood changes. Consistent with previous studies, we found subjective impairment in mood and activity after left prefrontal rTMS. However, we did not detect any statistically significant differences between rTMS of the left DLPFC and that of the right DLPFC. Likewise, two more recent studies, one investigating changes of rapid eye movement sleep after rTMS20 and the other comparing mood changes after verum and sham rTMS,21 did not demonstrate a significant difference between active and sham rTMS regarding effects on self-rated mood.
Methodological differences may account for the discrepancy between our findings and previous reports. First, VAS with two contrasting polarities were used in our study, in contrast to scales with one polarity used in previous studies11–13 or explicit questions about sadness and happiness.12 Second, we did not follow the subjects over several hours as George et al.12 did; they observed maximal effects on self-rated mood 3 to 8 hours after rTMS. However, Pascual-Leone et al.11 reported changes in mood immediately after rTMS. Third, rTMS conditions were investigated consecutively in a single session, as in one previous study,11 but not on separate days.12,13 Therefore we cannot exclude the possibility of carryover effects, although the sequence of rTMS conditions was randomized and counterbalanced between subjects. Fourth, our stimulation parameters were selected according to one prior study,11 but differed from parameters used by other investigators.12,13,20,21 Variation in these parameters, i.e., frequency and intensity, may well contribute to discrepancies between studies.
Physical discomfort caused by rTMS may have additionally influenced self-ratings of mood. Subjects spontaneously reported discomfort or pain during rTMS. This was also observed in VAS scores, with parallel increases in both physical discomfort and sad mood. Similarly, Pascual-Leone et al.11 found the largest increase in sadness and decrease in happiness after rTMS of the left DLPFC, which subjects spontaneously reported to be most distressing. As overall differences were only minimally significant by rTMS position, however, Pascual-Leone et al.11 concluded that discomfort did not account for observed mood changes. In contrast, our impression was that rTMS-induced physical discomfort has to be further considered as a biasing factor in studies using rTMS to probe the functional anatomy of mood.
Studies using rTMS to investigate the role of the PFC in emotions have so far not addressed the question of PFC modulation of emotion perception or expression11–13,20,21 Because facial expressions can finely and specifically indicate inner emotional states,16,14 we investigated whether fine analysis of facial expressions shows lateralized effects of prefrontal rTMS, as suggested by rTMS-induced changes in self-rated mood.11,12,13 We found significant differences between left and right prefrontal rTMS: after rTMS of the left DLPFC, the frequency of laughing reactions was increased and the emotional reaction time decreased as compared with rTMS of the right DLPFC. Higher frequency of laughing reactions and shorter reaction time to funny stimuli could be related to an increase in positive emotions. As reported, however, there was no obvious correspondence between facial expression parameter changes and changes of self-rated mood. This incongruity may be explained by the fact that facial expressions and self-rated mood are influenced by several internal and external covariables, such as pain or self-beliefs, which are difficult to control experimentally.18 Another possibility is that TMS-induced effects on emotionally induced facial expressions are purely motor in nature. However, no changes were observed for voluntary facial expressions after prefrontal rTMS, as one would expect in case of primary motor effects. It is more likely that both the analysis of facial expressions and self-rating of mood evaluate two different aspects of emotions. Facial expressions may be more related to short-term kinetics of emotions, while subjective mood rating reflects a lasting emotional state of an individual. The two do not necessarily correspond; discrepancies between mood and facial expressions have been observed in healthy subjects22 as well as in neurological or psychiatric patients.23 The present study is hypothesis-generating in this respect, and future studies will have to investigate the relation between the two phenomena.
It is intriguing that the finding of more and faster laughing reactions after left than right prefrontal rTMS fits with the major body of literature on hemispheric lateralization of emotional behavior in humans.1,3 Mirth and laughter can be evoked by electrical stimulation of the left frontal cortex and other left hemispheric sites.24,25 Furthermore, epileptic foci localized in the left hemisphere were found in patients suffering from gelastic seizures, whereas dacrystic seizures were associated with right hemispheric foci.1,26,27 Pathological laughing and euphoria were associated with right hemispheric lesions; pathological crying and depressed mood with left hemispheric lesions, particularly those affecting the left PFC.1,28,29 In depressive disorders, both decreased rates of glucose metabolism and reduced cerebral blood flow were found in the left PFC.4,5 Finally, antidepressant effects have been reported after fast rTMS of the left PFC and antimanic effects after fast rTMS of the right PFC.8 However, the putative laterality of rTMS-induced effects in affective disorders is not sufficiently established, since left prefrontal rTMS can also exert antidepressant effects at a low, possibly “inhibitory” frequency.9,10 The effects of rTMS in affective disorders appear to be opposite to the changes of self-rated mood previously reported in healthy volunteers.11–13 In the present study, however, changes of emotional facial expression parameters point in a similar direction to the effects of rTMS in depression and mania.
We are aware that the interpretation of lateralized changes of emotions found in rTMS studies is limited, since one cannot know whether pathways that regulate mood, emotions, and emotional facial expressions have been activated or inhibited by rTMS. Moreover, rTMS appears also to exert effects on the contralateral hemisphere, as has been demonstrated by functional neuroimaging studies. Neurophysiological investigations and imaging studies have not so far reached conclusive results as to whether rTMS has positive or negative net effects on neural activity.10,30 The presented findings, however, support the idea that combining rTMS and facial expression analysis may provide a promising tool to further investigate which regions of the brain are involved in the expression of emotions. Most of this system is usually thought to be located in subcortical structures such as the hippocampus, amygdala, or nucleus accumbens.31 It will be worthwhile to focus on the role of the PFC, or specific parts of it such as the DLPFC, in the generation and processing of emotions and their facial expressions.
ACKNOWLEDGMENTS
The authors thank Daniel Hermelink for helpful discussions. This project was supported by the German Federal Research Ministry within the promotional emphasis “Competence Nets in Medicine” (Subproject 6.5, F.P.). Thanks are owed also to the Magstim Company Ltd. and ZEBRI Ltd. for providing equipment. Part of this work was presented in poster form at the 29th Annual Meeting of the Society for Neuroscience, October 23–28, 1999, Miami Beach, FL, USA.

FIGURE 1. Mean scores (±SEM [mm]) of eight visual analog scales (VAS) before rTMS (common baseline), immediately (t1) and 15 minutes (t2) after rTMS of the left and right dorsolateral prefrontal cortex (DLPFC)aSignificant difference between baseline and t1 (P<0.05, two-tailed Wilcoxon signed-rank test).

FIGURE 2. Changes (mean±SEM) in (A) frequency of laughing reactions and (B) emotional reaction time after rTMS of the left and right dorsolateral prefrontal cortex (DLPFC), relative to the respective baseline valuesTwo-tailed Wilcoxon signed-rank tests revealed the following significant differences: aLeft vs. right DLPFC (P<0.01). bLeft angle of mouth: left vs. right DLPFC (P<0.05). cRight angle of mouth: left vs. right DLPFC (P<0.05).
 |
1 Sackeim HA, Greenberg MS, Weiman AL, et al: Hemispheric asymmetry in the expression of positive and negative emotions: neurologic evidence. Arch Neurol 1982; 39:210-218Crossref, Medline, Google Scholar
2 Alexander GE, Crutcher MD, DeLong MR: Basal ganglia-thalamocortical circuits: parallel substrates for motor, oculomotor, “prefrontal” and “limbic” functions. Prog Brain Res 1990; 85:119-146Crossref, Medline, Google Scholar
3 George MS, Speer AM, Wassermann EM, et al: Repetitive TMS as a probe of mood in health and disease. CNS Spectrums 1997; 2:39-44Google Scholar
4 Baxter LRJ, Schwartz JM, Phelps ME, et al: Reduction of prefrontal cortex glucose metabolism common to three types of depression. Arch Gen Psychiatry 1989; 46:243-250Crossref, Medline, Google Scholar
5 Soares JC, Mann JJ: The functional neuroanatomy of mood disorders. J Psychiatr Res 1997; 31:393-432Crossref, Medline, Google Scholar
6 Goodwin GM: Neuropsychological and neuroimaging evidence for the involvement of the frontal lobes in depression. J Psychopharmacol 1997; 11:115-122Crossref, Medline, Google Scholar
7 Hallett M: Transcranial magnetic stimulation and the human brain. Nature 2000; 406:147-150Crossref, Medline, Google Scholar
8 George MS, Lisanby SH, Sackeim HA: Transcranial magnetic stimulation. Arch Gen Psychiatry 1999; 56:300-311Crossref, Medline, Google Scholar
9 Klein E, Kreinin I, Chistyakov A, et al: Therapeutic efficacy of right prefrontal slow repetitive transcranial magnetic stimulation in major depression. Arch Gen Psychiatry 1999; 56:315-320Crossref, Medline, Google Scholar
10 Post RM, Kimbrell TA, McCann UD, et al: Repetitive transcranial magnetic stimulation as a neuropsychiatric tool: present status and future potential. J ECT 1999; 15:39-59Crossref, Medline, Google Scholar
11 Pascual-Leone A, Catalá MD, Pascual-Leone Pascual A: Lateralized effect of rapid-rate transcranial magnetic stimulation of the prefrontal cortex on mood. Neurology 1996; 46:499-502Crossref, Medline, Google Scholar
12 George MS, Wassermann EM, Williams WA, et al: Changes in mood and hormone levels after rapid-rate transcranial magnetic stimulation (rTMS) of the prefrontal cortex. J Neuropsychiatry Clin Neurosci 1996; 8:172-180Link, Google Scholar
13 Dearing Martin J: Mood effects of prefrontal repetitive high-frequency TMS in healthy volunteers. CNS Spectrums 1997; 2:53,68Google Scholar
14 Rinn WE: The neuropsychology of facial expression: a review of the neurological and psychological mechanisms for producing facial expressions. Psychol Bull 1984; 93:52-77Crossref, Google Scholar
15 Darwin CR: The Expression of Emotions in Man and Animals. London, John Murray, 1872Google Scholar
16 Sackeim HA, Gur RC, Saucy MC: Emotions are expressed more intensely on the left side of the face. Science 1978; 202:434-436Crossref, Medline, Google Scholar
17 Wassermann EM: Risk and safety of repetitive transcranial magnetic stimulation: report and suggested guidelines from the International Workshop on the Safety of Repetitive Transcranial Magnetic Stimulation, June 5-7, 1996. Electroencephalogr Clin Neurophysiol 1998; 1998:1-16Crossref, Google Scholar
18 Aitken RCB: Measurement of feeling using visual analogue scales. Proc R Soc Med 1969; 62:989-993Medline, Google Scholar
19 Juckel G, Polzer U: Fine analysis of abnormal facial expressions in chronic schizophrenic patients: a pilot study. German Journal of Psychiatry 1998; 1:6-9Google Scholar
20 Cohrs S, Tergau F, Riech S, et al: High-frequency repetitive transcranial magnetic stimulation delays rapid eye movement sleep. Neuroreport 1998; 9:3439-3443Google Scholar
21 Mosimann UP, Rihs TA, Engeler J, et al: Mood effects of repetitive transcranial magnetic stimulation of the left prefrontal cortex in healthy volunteers. Psychiatry Res 2000; 94:251-256Crossref, Medline, Google Scholar
22 Fridlund AJ: Evolution and facial action in reflex, social motive, and paralanguage. Biol Psychol 1991; 32:3-100Crossref, Medline, Google Scholar
23 Rogers D: Motor disorder in psychiatry: towards a neurological psychiatry. Chichester, UK, Wiley, 1992Google Scholar
24 Arroyo S, Lesser RP, Gordon B, et al: Mirth, laughter and gelastic seizures. Brain 1993; 116:757-780Crossref, Medline, Google Scholar
25 Fried I, Wilson CL, MacDonald KA, et al: Electric current stimulates laughter (letter). Nature 1998; 391:650Crossref, Medline, Google Scholar
26 Iannetti P, Spalice A, Raucci U, et al: Gelastic epilepsy: video-EEG, MRI and SPECT characteristics. Brain Dev 1997; 19:418-421Crossref, Medline, Google Scholar
27 Kuzniecky R, Guthrie B, Mountz J, et al: Intrinsic epileptogenesis of hypothalamic hamartomas in gelastic epilepsy. Ann Neurol 1997; 42:60-67Crossref, Medline, Google Scholar
28 Robinson RG, Kubos KL, Starr LB, et al: Mood disorder in stroke patients: importance of location of lesion. Brain 1984; 107:81-93Crossref, Medline, Google Scholar
29 Morris PLP, Robinson RG, Raphael B, et al: Lesion location and poststroke depression. J Neuropsychiatry Clin Neurosci 1996; 8:399-403Link, Google Scholar
30 Paus T: Imaging the brain before, during and after transcranial magnetic stimulation. Neuropsychologia 1999; 37:219-224Crossref, Medline, Google Scholar
31 Holstege G, Bandler R, Saper CB: The emotional motor system. Prog Brain Res 1996; 107:3-6Crossref, Medline, Google Scholar