“Frontal” Behaviors Before the Diagnosis of Huntington’s Disease and Their Relationship to Markers of Disease Progression: Evidence of Early Lack of Awareness
In the limited empirical studies of manifest Huntington’s disease, apathy, which includes problems with initiation, spontaneity, loss of interest, and decreased concern about self-care, appears to be a prevalent symptom. 7 – 10 For example, Paulsen et al. 11 reported that 56% of Huntington’s disease patients presented with this symptom. Apathy has also been correlated with other symptoms of Huntington’s disease (e.g., motor, cognition), 7 , 8 suggesting that apathy might be another hallmark symptom of the disease. Executive dysfunction, including problems with working memory, planning, and problem solving, appears to be another relatively prominent symptom in Huntington’s disease, although its impairments have largely been defined with neuropsychological measures 2 , 5 as opposed to self-reported behaviors. Fewer studies have examined disinhibition in Huntington’s disease, which includes impulsivity, hyperactivity, emotional lability, and “acting out,” and they have not found this symptom to be particularly prominent in these patients. 9 , 12 One final example of frontal behaviors that might be relevant in Huntington’s disease is decreased awareness or loss of insight. Although anecdotal evidence of decreased awareness of symptoms has been reported in Huntington’s disease, few studies have investigated this clinical lore. In one, Snowden et al. 13 found that patients with diagnosed Huntington’s disease poorly identified their chorea compared to objective neurological examinations. Similarly, Hoth et al. 14 found that patients with manifest Huntington’s disease had impaired awareness across a range of abilities (e.g., motor, cognition, emotional control) when compared to companion ratings and objective testing. Two other studies 15 , 16 found significant discrepancies between patient and companion reports on rating scales, which could be interpreted as decreased insight. Taken together, there is a growing body of literature that documents behavioral manifestations of frontal dysfunction in patients diagnosed with Huntington’s disease.
It is unclear from the existing literature, however, just how early these behavioral manifestations of frontal dysfunction occur in Huntington’s disease. With the availability of a genetic test, it is possible to identify individuals who have trinucleitide repeat expansion for Huntington’s disease but are not yet showing sufficient motor signs for diagnosis (i.e., pre-Huntington’s disease). Several studies have found subtle motor, cognitive, psychiatric, and neuroimaging abnormalities occuring in Huntington’s disease years before diagnosis. 17 – 26 For example, using a pre-Huntington’s disease cohort, we have previously reported on subtly elevated psychiatric symptoms in individuals prior to diagnosis. 27 Some of these symptoms may reflect frontal disturbances (e.g., obsessive-compulsiveness, interpersonal sensitivity, hostility) in pre-Huntington’s disease. Two limitations of those results should be noted. First, the measure used in our earlier work was not designed to assess frontal behaviors, so the current study allows us to more closely examine possible frontal dysfunction in the prodromal phases of Huntington’s disease (i.e., pre-Huntington’s disease). Second, our earlier work only reported differences between gene-expanded and non-gene-expanded individuals, whereas the current paper will also examine relationships to other markers of Huntington’s disease (e.g., motor, cognitive, striatal volume, estimated years to onset). If apathy, disinhibition, executive dysfunction, and decreased awareness are present before diagnosis, then these frontal behaviors might have clinical and research implications. For example, frontal behaviors in pre-Huntington’s disease might become a useful marker of early degeneration and diagnosis (although it would need to demonstrate its unique contribution, above and beyond existing markers). Additionally, as with manifest Huntington’s disease, frontal behaviors could adversely affect performance at work, social relationships, and activities of daily living, which might make them a target for clinical intervention (Paulsen, personal communication, 2006). Lastly, if behavioral manifestations of frontal dysfunction affect other symptoms of Huntington’s disease (e.g., motor, cognition), then their assessment and control would be necessary to accurately interpret clinical trials.
Therefore, the present study sought to extend our knowledge of these frontal behaviors in pre-Huntington’s disease by examining baseline data from a large cohort from the Neurobiological Predictors of Huntington’s Disease Onset study (Predict-HD). It was hypothesized that pre-Huntington’s disease expansion-positive individuals would report higher levels of frontal behaviors compared to expansion-negative individuals. Using cross-sectional data, it was hypothesized that other markers of disease progression (e.g., subtle motor signs, cognitive dysfunction, decreasing striatal volumes) would be related to increased ratings of the frequency and severity of apathy, disinhibition, and executive dysfunction. Although exploratory, it was suspected that expansion-positive individuals would demonstrate some loss of awareness of their behaviors as they moved closer to a Huntington’s disease diagnosis. Throughout the manuscript, we use the term “frontal” as shorthand to refer to neuropsychiatric symptoms that are possibly linked to dysfunction of the frontal-subcortical circuitry, even though we realize that such terms likely oversimplify the actual brain-behavior relationships.
METHODS
Participants
Nine hundred eight individuals enrolled in the Predict-HD study served as participants. Additional details about the recruitment and characterization of the sample can be found in Paulsen et al. 26 Briefly, this multicenter, longitudinal project recruited individuals who carried the expanded CAG Huntington’s disease gene but were not yet diagnosed with Huntington’s disease (i.e., not showing significant motor signs to warrant a diagnosis). All individuals in the study knew they were at risk for Huntington’s disease due to a family history, and all had voluntarily undergone genetic testing and received results prior to and independent of participation in Predict-HD. The “expansion-positive” participants (n=745) were predominantly female (64%) and Caucasian (97%). A smaller sample (n=163) of “expansion-negative” individuals (i.e., having a parent with Huntington’s disease but confirmed not to carry the expanded Huntington’s disease gene by voluntary testing) was also examined. To adequately power Predict-HD to examine its primary aims, expansion-positive participants were purposely recruited at a much higher rate than expansion-negative individuals (approximately 5:1).
Procedures
Written informed consent was obtained from all participants prior to study procedures. All participants were evaluated with a standardized clinical rating scale for Huntington’s disease, neuropsychological testing, psychiatric assessments, and MRI. These procedures have all been previously described. 26 Included in the psychiatric assessments was a modified version of the Frontal System Behavior Scale 28 (FrSBe), which was completed by participants and their companions. Each companion was instructed to complete the FrSBe based on his or her view of the participant’s functioning at that time.
Measures
The FrSBe is a 46-item self-report symptom inventory designed to measure behaviors associated with damage to the frontal lobes or frontal systems of the brain. Previous research suggests that a subset of the FrSBe’s items provide the most clinically useful information. 10 Therefore, a modified version of the FrSBe was used in the current study. This modified version of the FrSBe contains 24 items that assess the frequency of certain behaviors and the level of distress caused by those behaviors. Frequency response choices range from 1 to 5 (“almost never” to “almost always”), and distress response choices range from 1 to 5 (“not at all distressing” to “extremely distressing or very severe”). Consistent with the original version of the FrSBe, the final several items (items 19–24 in our modified version) were reverse coded, as an intended validity check. Also consistent with the original version, a companion-report version was administered that asks companions to rate the patient/participant. For both the participant and companion versions of this modified FrSBe, the total score was the sum of the products of frequency and distress for each item, with higher scores indicating greater frequency of frontal behaviors and more distress caused by them. Three subscales can also be obtained from the FrSBe: apathy, disinhibition, and executive dysfunction, and these subscales have been previously supported in a factor analysis study 10 of neurological patients, including those with Huntington’s disease. According to the test manual, 28 the apathy subscale may indicate problems with initiation, spontaneity, loss of interest, and decreased concern about self-care. The disinhibition subscale assesses impulsivity, hyperactivity, emotional lability, and “acting out.” Finally, the executive dysfunction subscale can evaluate problems with working memory, planning, problem solving, and insight. An initial psychometric analysis of the current data suggested that our reverse-coded items were confusing for many participants and companions (i.e., a substantial but unidentifiable subset failed to reverse code the items). Therefore, these items (19–24 in our version) were eliminated from the following analyses, and total FrSBe scores were only based on items 1–18 (range of possible scores =18–450).
The Unified Huntington’s Disease Rating Scale (UHDRS) 29 is a standardized clinical rating scale that assesses key components of Huntington’s disease, including motor function and cognition. To assess motor function, a neurologist examines 31 individual motor signs (e.g., ocular pursuit, finger taps, bradykinesia, chorea, dysarthria) for each individual and rates each sign as 0 (normal), 1 (minimal or equivocal), 2 (mild but definite), 3 (moderate), or 4 (severe). The sum of these individual signs yields the total motor score, which ranges from 0 to 124, with higher scores indicating more impaired motor functioning. Cognition on the UHDRS was assessed with three tasks (Symbol Digit, Verbal Fluency, Stroop Color and Word), with higher scores indicating more intact cognition.
As part of the Predict-HD study, other markers of disease progression were also assessed. Total volumes of the striatum were taken from MRI data using an automated processing system. 25 , 30 , 31 Probability of diagnosis of Huntington’s disease in the next 5 years was estimated with current age and CAG repeat length using the published method of Langbehn et al. 32 These methods have been more fully described elsewhere. 26 Finally, additional measures of neuropsychological and psychiatric functioning were administered as part of Predict-HD; however, some of those results have already been reported 26 , 27 , 33 – 35 and others are topics of additional papers in progress, so we did not consider these additional variables in our analyses.
Data Analyses
Several sets of analyses were calculated using only baseline data from Predict-HD. First, to compare groups (expansion-positive and expansion-negative) on demographic and Huntington’s disease-related variables, independent t tests were used. Similarly, total score on the modified FrSBe and the three subscales for both participants and companions were compared with independent t tests. For these comparisons, homogeneity of variance was assessed. If this hypothesis was rejected, then a t test assuming unequal variances with the Satterthwaite method to approximate degrees of freedom was used. Effect sizes (i.e., Cohen’s d) were calculated as the mean difference between groups divided by their pooled standard deviations. Second, to examine the relationships between baseline FrSBe scores (total and subscales) and other markers of disease progression (e.g., UHDRS total motor score, UHDRS cognitive tasks, probability of disease diagnosis within the next 5 years) at baseline, a series of linear mixed models were used. In these models, FrSBe participant and companion scores were used to predict the other markers of disease progression, after controlling for relevant demographic variables (e.g., age, gender, education). A restricted cubic spline function 36 was incorporated into the linear regression model to test for potential nonlinearity against the outcome variable. Lastly, for striatal volumes, linear regression analyses proved sufficient to investigate the relationships, while controlling for age, gender, and intracranial volume. Throughout these analyses, the total score on the FrSBe was the primary variable of interest, with secondary analyses focusing on the subscales and individual items of the FrSBe. It should also be noted that these analyses were not part of the primary aims of the Predict-HD study, so all analyses should be viewed cautiously.
RESULTS
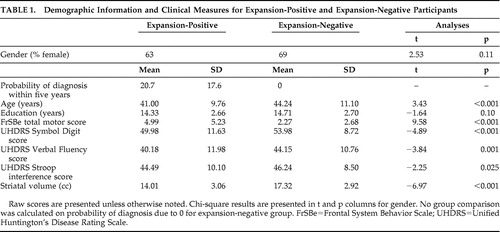
Demographic information for the two groups is presented in Table 1 . The expansion-positive and expansion-negative groups were not significantly different with regard to education or gender (p>0.05), although the expansion-positive group was significantly younger than the expansion-negative group (p<0.001). The two groups differed on several markers consistent with developing signs of Huntington’s disease ( Table 1 ), including higher total motor scores (p<0.001) and poorer performance on Symbol Digit (p<0.001), Verbal Fluency (p=0.001), and Stroop interference (p=0.025) for pre-Huntington’s disease expansion-positive participants relative to the expansion-negative participants. The two groups also differed on striatal volume, with larger volumes in the expansion-negative participants (p<0.001). Probability of diagnosis within 5 years was 20.7% in the expansion-positive group and not applicable in the expansion-negative group (i.e., theoretically 0%).
 |
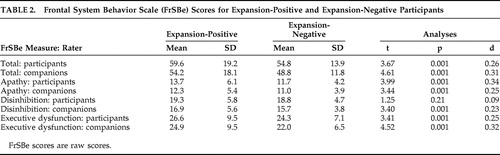
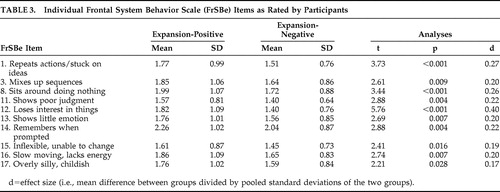
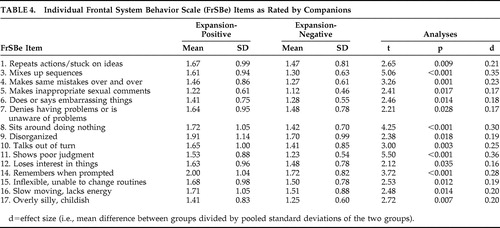
Pre-Huntington’s disease expansion-positive participants had significantly higher total scores on the FrSBe than expansion-negative participants, whether ratings were made by participants or companions (p<0.001 in all cases; see Table 2 ). Similarly, expansion-positive participants rated themselves higher than expansion-negative participants on two of the three subscales of the FrSBe (apathy and executive dysfunction, p<0.001 in all cases), and companions rated expansion-positive participants higher on all three subscales (p<0.001 in all cases; see Table 2 ). Descriptive statistics for these groups on the individual items of the FrSBe are presented in Table 3 and Table 4 . According to the participants’ ratings, 10 of the 18 items of the modified FrSBe were significantly (p<0.05) higher (i.e., more frequent behaviors) in the expansion-positive individuals than the expansion-negative individuals. When the companions rated the participants, 15 of the 18 items were significantly higher for the expanded compared to the nonexpanded individuals. The remainder of the items (i.e., those not reported in Tables 3 and 4 ) were comparable between the two groups.
 |
 |
 |
Results of the linear mixed models indicated that both participant and companion FrSBe total scores were statistically significant (p≤0.05) predictors of motor scores. Subscale models revealed that the disinhibition subscale rated by the companion (t=−2.71, df=1, p<0.01) and the executive dysfunction subscale rated by the companion (t=3.50, df=1, p<0.001) were also predictors of the total motor score for the participants.
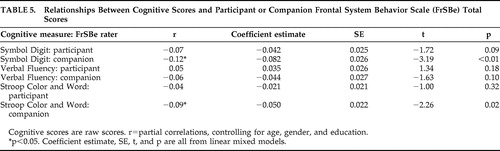
The relationships between participant and companion FrSBe total scores and some cognitive measures that have been linked with Huntington’s disease progression are summarized in Table 5 . Two of the three cognitive measures (Symbol Digit, Stroop) were significantly related to FrSBe ratings by the companion. Participant FrSBe ratings were not significantly related to any of the three cognitive measures we examined. When analyzing data from the subscales of the FrSBe, only the executive dysfunction subscale was related to the Symbol Digit test (participant: t=−2.74, df=1, p<0.01; companion: t=−2.54, df=1, p=0.01). Verbal fluency was related to the participant’s rating on the disinhibition (t=2.63, df=1, p<0.01) and executive dysfunction (t=−2.03, df=1, p<0.05) subscales. Finally, only the companion’s rating on the disinhibition subscale was related to the Stroop interference trial (t=2.15, df=1, p<0.05).
 |
Participant FrSBe total score did not demonstrate a linear relationship with probability of diagnosis of Huntington’s disease (t=−0.36, df=1, p=0.72); however, a significant nonlinear relationship was observed between participant FrSBe total score and probability of diagnosis (F=4.10, df=2, 693, p=0.02). As seen in Figure 1 , expansion-positive individuals who had a low probability of diagnosis in the next 5 years (i.e., left side of x axis) reported fewer frontal behaviors, whereas individuals with a moderate probability of diagnosis (i.e., middle of x axis) reported more frontal behaviors. Expansion-positive individuals with the greatest probability of diagnosis (i.e., right side of x axis) reported fewer frontal behaviors. This contrasts with the linear trend (t=1.88, df=1, p=0.06) observed in companion FrSBe total scores seen in Figure 2 , where increasing probability of diagnosis led to a trend for increasingly more frontal behaviors being reported. Spline analyses did not support a nonlinear relationship between companion FrSBE total ratings and probability of diagnosis (p=0.19). Nonlinear relationships with probability of 5 year diagnosis were also observed with participant ratings on the disinhibition (p<0.01), executive dysfunction (p<0.01), and apathy subscales (p=0.11). Linear trends were observed on two of the three companion-rated subscales (executive dysfunction: p=0.07, apathy: p=0.11).
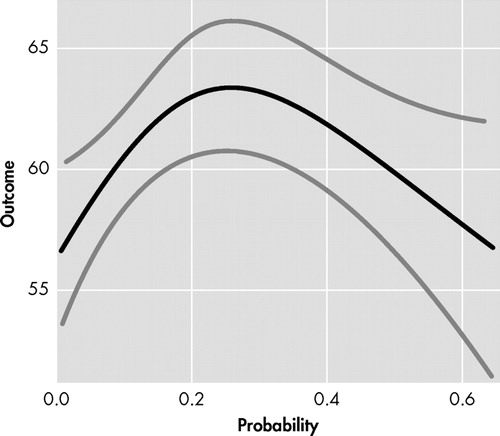
y axis=FrSBe total score rated by participants, with higher score indicating more frontal behaviors. x axis=probability of Huntington's disease diagnosis within next 5 years based on Langbehn et al. 32 Black line represents regression line and gray lines represent 95% confidence intervals.
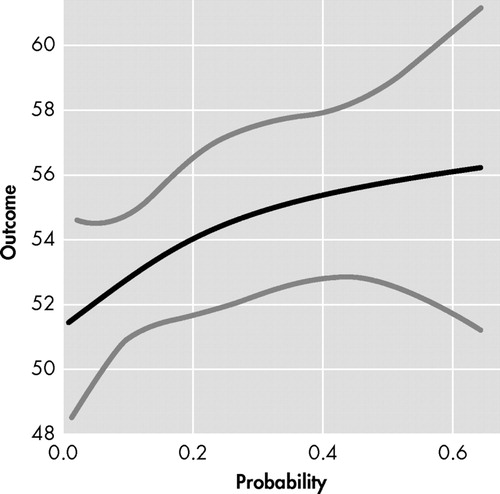
y axis=FrSBe total score as rated by companions, with higher score indicating more frontal behaviors. x axis=probability of Huntington's disease diagnosis within the next 5 years based on Langbehn et al. 32 Black line represents regression line and gray lines represent 95% confidence intervals.
Striatal volume in a subset of gene-expanded participants (n=558) was significantly predicted by companion ratings on the FrSBe total score (p=0.01), apathy subscale (p=0.002), and disinhibition subscale (p=0.003). Although the magnitude of these effects is small (e.g., 1 point change in FrSBe score being associated with <1% change in striatal volume), in each of these instances, smaller striatal volumes were associated with higher scores on the FrSBe. Only the participant rating on the apathy subscale of the FrSBe was related to striatal volumes (p=0.03).
DISCUSSION
Apathy, behavioral disinhibition, and executive dysfunction have been previously reported in patients with diagnosed Huntington’s disease. 8 , 37 , 38 To our knowledge, this is the first study to specifically examine these behavioral manifestations of frontal dysfunction in genetically expanded pre-Huntington’s disease individuals. In this large cohort of “presymptomatic” individuals, both self and companion ratings on a modified version of the FrSBe were significantly higher than “at risk” but genetically nonexpanded peers. These differences occurred on the overall score of the FrSBe, all three subscales, and most of the individual items of this measure. It should be noted, however, that the magnitude of these statistical differences (i.e., effect sizes) were small to medium and their clinical significance is not currently known. Prior studies in manifest Huntington’s disease suggest that increasing behavioral ratings of frontal dysfunction (e.g., apathy, executive dysfunction) is linked with disruption of everyday functioning, 9 , 37 and whether these same relationships bear out in pre-Huntington’s disease remains a future direction of study. Regardless, these findings continue to support other studies 25 – 27 , 33 , 34 , 39 identifying subtle dysfunction in this cohort prior to formal diagnosis.
Not only are these ratings of apathy, disinhibition, and executive dysfunction more prevalent in the gene-expanded group, but these behaviors are associated with other markers of disease progression in Huntington’s disease. For example, Huntington’s disease is typically viewed as a disorder of voluntary and involuntary motor functioning, and both participant and companion ratings of increasing frontal behaviors were related to increasing motor dysfunction, as determined from a detailed motor exam. Similarly, increasing difficulty on cognitive tests commonly affected in Huntington’s disease was associated with increasing behavioral ratings on the FrSBe in this pre-Huntington’s disease sample. Interestingly, it was the companion ratings of the participant’s behaviors that were most strongly related to the cognitive measures. It should be noted that only a limited battery of cognitive tests were examined in the current analyses, and future studies might employ more comprehensive cognitive assessments. The relatively strong association between Huntington’s disease markers (e.g., motor, cognition, FrSBe ratings) could be interpreted two ways. On the one hand, it might not be surprising that motor, cognitive, and frontal behaviors all relate to one another, as these are all parts of the triad of Huntington’s disease. On the other hand, these three “separate” components of Huntington’s disease might reflect a unitary construct of disease severity. Regardless, it is important to recall that the pre-Huntington’s disease participants in the current study are presenting with very subtle (if any) signs of Huntington’s disease (e.g., minimal or equivocal motor signs, cognitive performances around the 50th percentile) and are genetically presumed to be quite far from diagnosis (e.g., only a 20% chance of being diagnosed within next 5 years). Thus, even these relatively small relationships between frontal behaviors and other markers of Huntington’s disease are noteworthy, and continued follow-up with these participants as they get closer to diagnosis could lead to stronger associations.
Another association with the FrSBe ratings occurred with the probability of diagnosis of Huntington’s disease within the next 5 years. As can be seen in Figure 1 , participants’ ratings of frontal behaviors had an inverted U-shaped relationship with the probability of Huntington’s disease diagnosis in the next 5 years. Individuals with low and high probability of being diagnosed rated themselves as having fewer frontal behaviors, and individuals with mid-probability of diagnosis rated themselves with relatively more frontal behaviors. Companion FrSBe ratings of the participants, however, were much more linear ( Figure 2 ), with increasing probability of Huntington’s disease diagnosis being associated with increasing FrSBe scores. Similar patterns emerged on most of the subscales as well.
To further examine this discrepancy between raters, a difference score was calculated for the total FrSBe score (i.e., participant score−companion score, y axis of Figure 3 ). This FrSBe difference score was also plotted against the probability of diagnosis within the next 5 years (x axis of Figure 3 ). The upward deflection of the line before 20% probability of Huntington’s disease diagnosis (i.e., ≤0.2 on x axis) indicates that expansion-positive individuals are rating themselves as having more frontal behaviors than their companions are rating. As the probability of diagnosis increases to 20%–30%, companions begin identifying more frontal behaviors in the participants, as seen by the downward deflection in the line (contrast comparing 0.2 and 0.3 probability of diagnosis: t=2.12, df=515, p=0.03). This discrepancy trend continues downward as the probability of diagnosis increases (e.g., 40%–50%), suggesting that further increase in probability of diagnosis is associated with greater differences between participants’ and companions’ scores. By 60% probability of diagnosis in the next 5 years, participants and companions are rating similar amounts of frontal behaviors (i.e., discrepancy score nears 0). Since we do not have sufficient data on individuals with greater than 60% probability of diagnosis, it remains unclear if this discrepancy trend would continue downward (i.e., <0, companions rating more frontal behaviors than participants) or if it would flatten out or increase again.

y axis=difference score for FrSBe total score (participant score companion score), with higher score indicating participant is rating more frontal behaviors and lower score indicating companion is rating more frontal behaviors. x axis=probability of Huntington's disease diagnosis within the next 5 years based on Langbehn et al. 32 Black line represents regression line and gray lines represent 95% confidence intervals.
In general, this discrepancy score pattern in Figure 3 might not be too surprising, as these frontal behaviors likely fall on a continuum of behaviors. In early and subtle frontal dysfunction, an individual might need to put more effort into initiating an act, inhibiting an unwanted response, or solving problems, and these early examples might be most easily observed from within (i.e., by the participant). In later and more severe frontal dysfunction, an individual might be completely unable to initiate, inhibit, or solve problems, and these later examples might also be easily observed from outside (i.e., by the companion too). If this supposition is correct, then we would expect to see higher levels of participant-reported frontal behaviors in the early phases of pre-Huntington’s disease, as only the participant can really observe these subtle changes. As the disease progresses toward diagnosis and these behaviors worsen, then the companion might also begin to notice some of them, leading to higher companion reports on the FrSBe. However, if this supposition is correct, then we would also expect to see a flattening of the discrepancy line at some point, as both the participant and companion are reporting high levels of frontal behaviors. This is not the case, as reflected in Figures 1 and 2 , where the participants are reporting fewer behaviors and the companions are reporting more behaviors in the higher periods of probability of diagnosis (e.g., 40%–60%).
One possible explanation that might reconcile the figures is that awareness is decreasing in the participants as they get closer to Huntington’s disease diagnosis. Impairments of insight and awareness have been reported in manifest Huntington’s disease. 14 , 15 For example, in patients with diagnosed Huntington’s disease, Hoth et al. found decreased awareness across a range of abilities. Impaired awareness has not been explicitly examined in pre-Huntington’s disease, but decreasing awareness as individuals approach diagnosis is possible in this cohort and further study of this possibility is warranted. A second possible explanation for the discrepancy scores could be that frontal dysfunction fluctuates throughout this prodromal period before Huntington’s disease diagnosis. It is possible that the participants appreciate the increases and decreases of frontal dysfunction more than the companions, and this is reflected in their disparate ratings on the FrSBe. Others have reported cross-sectional increases and decreases in depression 40 and obsessive-compulsive symptoms 41 across the course of manifest Huntington’s disease, and similar trends might occur for frontal dysfunction in pre-Huntington’s disease. Regardless of the interpretation of the figures, it should be noted that the magnitude of the discrepancy effect is relatively small, and the relationship between probability of diagnosis and FrSBe scores seems to share substantial overlap with other clinical elements of developing Huntington’s disease (e.g., motor, cognition). It might be that the FrSBe scores and these other markers of Huntington’s disease concomitantly change in pre-Huntington’s disease, although longitudinal data would be needed to clarify this. Despite little clarity as to what discrepancy scores in pre-Huntington’s disease truly reflect, these discrepancy scores between participants and companions might serve as another useful marker in the progression toward Huntington’s disease, with greater discrepancies indicating closeness to onset. However, as noted earlier, participant/companion discrepancy scores would need to demonstrate some unique contribution to supplant existing (and seemingly more objective) markers (e.g., cognition, motor).
There were few relationships between MRI striatal volumes and participant FrSBe scores, despite theoretical brain-behavior links. There were, however, stronger relationships between companions’ ratings and striatal volumes, occurring on the total score and the apathy and disinhibition subscales. In general, higher companion-rated FrSBe scores were associated with smaller striatal volumes. It is possible that while striatal volumes do relate with motor and cognitive functioning in Huntington’s disease, 26 , 34 they might map less well onto the frontal behaviors in pre-Huntington’s disease. We previously failed to find a relationship between striatal volumes and participant responses on another psychiatric self-report scale in this pre-Huntington’s disease sample. 27 It is also possible that the effect of pre-Huntington’s disease brain neuropathology on frontal behaviors and other psychiatric symptoms might occur extrastriatally. Future analyses might examine the relationship between FrSBe scores and white matter tracts or regional structures in and around the frontal lobes (e.g., orbitofrontal cortex, dorsolateral cortex, anterior cingulate). 42 The absence of a brain-behavior relationship in the current study could also be due to relatively minimal changes in the striatum in these “far-from-diagnosis” pre-Huntington’s disease individuals, and additional analyses on pre-Huntington’s disease individuals who were “nearer to diagnosis” might have yielded different results.
Despite these interesting findings, some limitations should be noted. First, the measure used to assess frontal behaviors in the current study, the FrSBe, has some limitations. For example, it focuses on three types of frontal behaviors (i.e., apathy, disinhibition, and executive dysfunction), when other examples could have been included (e.g., irritability, obsessiveness). Furthermore, in a study examining the FrSBe in three degenerative diseases (including Huntington’s disease), only 41% of the total variance was accounted for by the three subscores. 10 Future studies might consider augmenting the FrSBe with other measures to fully capture this complex neuropsychiatric phenomenon. Another potential limitation of the FrSBe is its reversed items, which are designed to check the responding of participants. Due to apparent confusion on these reversed items in our study, we had to eliminate all of those items because we did not feel they were reliably endorsed by either participants or companions. Future studies might weigh the value of having this validity check versus collecting potentially unreliable data. The FrSBe was also modified to be more applicable for our study, which led to additional limitations. Our use of a modified version of the FrSBe precluded our use of normative data, which might place these scores in a clearer context (e.g., normal, borderline, impaired). It was necessary to modify the FrSBe in this study because the original FrSBe asks participants to rate themselves before and after some illness or injury. Since these individuals are all prediagnosis, there is no “before” or “after” their Huntington’s disease. We did collect data on an appropriate control group (i.e., “at risk” but genetically nonexpanded individuals), but there is no evidence to confirm this group is comparable to a not-at-risk sample. Other limitations of the current study are related to selection biases and lack of information on companions. All participants and companions in the study were aware of the gene status of the participants, and this knowledge could have influenced self and other reports. Furthermore, there is an inherent selection bias in the sample, as relatively few individuals at risk for Huntington’s disease undergo genetic testing. And of those who do find out their genetic risk, it is unlikely that they all volunteer to participate in research projects like Predict-HD, which require yearly visits to track symptoms. It could also be argued that awareness of symptoms (a focus of these analyses) might lead to an additional selection bias. However, it is possible to expect that individuals with either increased or decreased awareness might participate in studies like Predict-HD. For example, individuals with heightened awareness might participate in the study in the hopes of tracking their symptoms more formally, whereas individuals with decreased awareness might participate because they feel they are unaffected by Huntington’s disease. Regardless, any selection bias questions the generalizability of these findings to other individuals at risk for Huntington’s disease. Unfortunately, we did not collect demographic or other information on the companions, and future studies are encouraged to better document the nature and length of relationships between participants and companions. A final limitation is that Predict-HD, from which these participants were drawn, is an ongoing study with much more forthcoming neuropsychological, psychiatric, and imaging data than we could currently present. 26 This limitation, however, also holds promise, as this study will soon yield much more information about the unfolding of this degenerative disease. Related questions that we will soon be able to answer include the assessment of FrSBe change scores across time, examination of neuropsychological and extrastriatal imaging measures and FrSBe scores, and the relationships between frontal behaviors and other types of psychiatric symptoms in this pre-Huntington’s disease sample.
1. Paulsen JS: Understanding Behavior in Huntington’s Disease. New York, Huntington’s Disease Society of America, 1999Google Scholar
2. Aylward EH, Anderson NB, Bylsma FW, et al: Frontal lobe volume in patients with Huntington’s disease. Neurology 1998; 50:252–258Google Scholar
3. Bonelli RM, Cummings JL: Frontal-subcortical dementias. Neurologist 2008; 14:100–107Google Scholar
4. Schmidtke K, Manner H, Kaufmann R, Schmolck H: Cognitive procedural learning in patients with fronto-striatal lesions. Learn Mem 2002; 9:419–429Google Scholar
5. Rosas HD, Salat DH, Lee SY, et al: Cerebral cortex and the clinical expression of Huntington’s disease: complexity and heterogeneity. Brain 2008; 131(part 4):1057–1068Google Scholar
6. Wolf RC, Vasic N, Schonfeldt-Lecuona C, et al: Cortical dysfunction in patients with Huntington’s disease during working memory performance. Hum Brain Mapp 2009; 30:327–339Google Scholar
7. Baudic S, Maison P, Dolbeau G, et al: Cognitive impairment related to apathy in early Huntington’s disease. Dement Geriatr Cogn Disord 2006; 21(5–6):316–321Google Scholar
8. Thompson JC, Snowden JS, Craufurd D, et al: Behavior in Huntington’s disease: dissociating cognition-based and mood-based changes. J Neuropsychiatry Clin Neurosci 2002; 14:37–43Google Scholar
9. Hamilton JM, Salmon DP, Corey-Bloom J, et al: Behavioural abnormalities contribute to functional decline in Huntington’s disease. J Neurol Neurosurg Psychiatry 2003; 74:120–122Google Scholar
10. Stout JC, Ready RE, Grace J, et al: Factor analysis of the Frontal Systems Behavior Scale (FrSBe). Assessment 2003; 10:79–85Google Scholar
11. Paulsen JS, Ready RE, Hamilton JM, et al: Neuropsychiatric aspects of Huntington’s disease. J Neurol Neurosurg Psychiatry 2001; 71:310–314Google Scholar
12. Stout JC, Rodawalt WC, Siemers ER: Risky decision making in Huntington’s disease. J Int Neuropsychol Soc 2001; 7:92–101Google Scholar
13. Snowden JS, Craufurd D, Griffiths HL, et al: Awareness of involuntary movements in Huntington disease. Arch Neurol 1998; 55:801–805Google Scholar
14. Hoth KF, Paulsen JS, Moser DJ, et al: Patients with Huntington’s disease have impaired awareness of cognitive, emotional, and functional abilities. J Clin Exp Neuropsychol 2007; 29:365–376Google Scholar
15. Chatterjee A, Anderson KE, Moskowitz CB, et al: A comparison of self-report and caregiver assessment of depression, apathy, and irritability in Huntington’s disease. J Neuropsychiatry Clin Neurosci 2005; 17:378–383Google Scholar
16. Deckel AW, Morrison D: Evidence of a neurologically based “denial of illness” in patients with Huntington’s disease. Arch Clin Neuropsychol 1996; 11:295–302Google Scholar
17. Aylward EH, Codori AM, Barta PE, et al: Basal ganglia volume and proximity to onset in presymptomatic Huntington disease. Arch Neurol 1996; 53:1293–1296Google Scholar
18. Aylward EH, Sparks BF, Field KM, et al: Onset and rate of striatal atrophy in preclinical Huntington disease. Neurology 2004; 63:66–72Google Scholar
19. Aylward EH, Li Q, Stine OC, et al: Longitudinal change in basal ganglia volume in patients with Huntington’s disease. Neurology 1997; 48:394–399Google Scholar
20. Kirkwood SC, Siemers E, Stout JC, et al: Longitudinal cognitive and motor changes among presymptomatic Huntington disease gene carriers. Arch Neurol 1999; 56:563–568Google Scholar
21. Lawrence AD, Hodges JR, Rosser AE, et al: Evidence for specific cognitive deficits in preclinical Huntington’s disease. Brain 1998; 121(part 7):1329–1341Google Scholar
22. Nehl C, Ready RE, Hamilton J, et al: Effects of depression on working memory in presymptomatic Huntington’s disease. J Neuropsychiatry Clin Neurosci 2001; 13:342–346Google Scholar
23. Paulsen JS, Zimbelman JL, Hinton SC, et al: fMRI biomarker of early neuronal dysfunction in presymptomatic Huntington’s disease. AJNR Am J Neuroradiol 2004; 25:1715–1721Google Scholar
24. Paulsen JS, Zhao H, Stout JC, et al: Clinical markers of early disease in persons near onset of Huntington’s disease. Neurology 2001; 57:658–662Google Scholar
25. Paulsen JS, Magnotta VA, Mikos AE, et al: Brain structure in preclinical Huntington’s disease. Biol Psychiatry 2006; 59:57–63Google Scholar
26. Paulsen JS, Hayden M, Stout JC, et al: Preparing for preventive clinical trials: the Predict-HD study. Arch Neurol 2006; 63:883–890Google Scholar
27. Duff K, Paulsen JS, Beglinger LJ, et al, Predict Investigators of the Huntington Study Group: psychiatric symptoms in Huntington’s disease before diagnosis: the Predict-HD Study. Biol Psychiatry 2007; 62:1341–1346Google Scholar
28. Grace J, Malloy PF: Frontal Systems Behavior Scale (FrSBe): Professional Manual. Lutz, Fla, Psychological Assessment Resources, 2001Google Scholar
29. Huntington Study Group: Unified Huntington’s Disease Rating Scale: reliability and consistency. Huntington Study Group. Mov Disord 1996; 11:136–142Google Scholar
30. Magnotta VA, Harris G, Andreasen NC, et al: Structural MR image processing using the Brains2 Toolbox. Comput Med Imaging Graph 2002; 26:251–264Google Scholar
31. Nopoulos P, Magnotta VA, Mikos A, et al: Morphology of the cerebral cortex in preclinical Huntington’s disease. Am J Psychiatry 2007; 164:1428–1434Google Scholar
32. Langbehn DR, Brinkman RR, Falush D, et al: A new model for prediction of the age of onset and penetrance for Huntington’s disease based on CAG length. Clin Genet 2004; 65:267–277Google Scholar
33. Paulsen JS, Langbehn DR, Stout JC, et al: Detection of Huntington’s disease decades before diagnosis: the Predict HD study. J Neurol Neurosurg Psychiatry 2008; 79:874–880Google Scholar
34. Solomon AC, Stout JC, Johnson SA, et al: Verbal episodic memory declines prior to diagnosis in Huntington’s disease. Neuropsychologia 2007; 45:1767–1776Google Scholar
35. Johnson SA, Stout JC, Solomon AC, et al: Beyond disgust: impaired recognition of negative emotions prior to diagnosis in Huntington’s disease. Brain 2007; 130(part 7):1732–1744Google Scholar
36. Harrell FE: Regression Modeling Strategies. New York, Springer, 2001Google Scholar
37. Paulsen JS, Stout JC, Delapena JH, et al: Frontal behavioral syndromes in cortical and subcortical dementia. Assessment 1996; 3:327–337Google Scholar
38. Craufurd D, Thompson JC, Snowden JS: Behavioral changes in Huntington disease. Neuropsychiatry Neuropsychol Behav Neurol 2001; 14:219–226Google Scholar
39. Beglinger LJ, Paulsen JS, Watson DB, et al: Obsessive and compulsive symptoms in prediagnosed Huntington’s disease. J Clin Psychiatry 2008; 69:1758–1765Google Scholar
40. Paulsen JS, Nehl C, Hoth KF, et al: Depression and stages of Huntington’s disease. J Neuropsychiatry Clin Neurosci 2005; 17:496–502Google Scholar
41. Beglinger LJ, Langbehn DR, Duff K, et al: Probability of obsessive and compulsive symptoms in Huntington’s disease. Biol Psychiatry 2007; 61:415–418Google Scholar
42. Beglinger LJ, Nopoulos PC, Jorge RE, et al: White matter volume and cognitive dysfunction in early Huntington’s disease. Cogn Behav Neurol 2005; 18:102–107Google Scholar