Subcortical Hyperintensities in Alzheimer's Disease
Abstract
The authors measured subcortical hyperintensities (SH) on magnetic resonance images (MRI) in 18 patients with probable Alzheimer's disease and examined the relationships of SH severity with cortical metabolic function and clinical symptoms. Severity of SH was not correlated with absolute metabolic rates in cortical lobes. However, anterior SH severity was inversely correlated with frontal/ parietal metabolic ratios after covarying for cognitive impairment. SH severity in some areas was associated with the severity of global neuropsychiatric symptoms, but marked effects on individual symptoms were not apparent. The small sample size and multiple variables limit conclusions that can be drawn. These preliminary findings indicate that subcortical MRI hyperintensities may play a role in the pathophysiology and clinical expression of Alzheimer's disease.
Alzheimer's disease (AD) is characterized by several neuropathologic findings, including amyloid plaques, neurofibrillary tangles, and neuronal loss in the cortex and hippocampus.1 Neuroimaging studies have demonstrated hypometabolism in the temporal, parietal, and frontal cortical lobes in AD.2,3 Subcortical white matter hyperintensities (SH) seen with magnetic resonance imaging (MRI) have been independently observed to be more extensive in patients with AD than in age-matched healthy control subjects.4–7
There is limited understanding of the significance of SH. In subjects with and without AD, periventricular hyperintensities (PVH) may represent denudation of the ventricular lining, while deep white matter hyperintensities (DWMH) probably represent loss of myelinated axons.4,5 Some investigators have suggested that SH are a feature of aging or an epiphenomenon of brain atrophy in AD.4,8,9 Others have associated vascular risk factors or disease with the presence of SH.10,11 Brain perfusion studies have yielded no consistent finding associated with these lesions in patients with dementia, showing either no association12,13 or hypoperfusion in the frontal and parietal cortices14 or hippocampal regions.6
The relationship between SH in AD and the clinical symptoms of the degenerative disorder is also uncertain. A few studies have explored associations with cognitive deficits or functional disability. No correlation has been found between the extent of SH and global cognitive deficit in some studies,8,15 whereas others have reported correlations with cognitive impairment, reduction in activities of daily living, or frontal release signs.7,14,16 Relationships with other symptoms of AD have not been examined. Among elderly patients without dementia, DWMH were more common in depressed patients than control subjects,17 suggesting that these lesions may have psychiatric sequelae. Neuropsychiatric symptoms have been associated with regional cortical hypometabolism in patients with AD.18
Data from non-AD studies suggest that focal lesions affect metabolism in remote brain regions, a phenomenon known as diaschisis.19–21 In a study of patients with vascular dementia but no cortical lesions, Sultzer et al.22 reported that anterior PVH and lesions in subcortical nuclei were positively correlated with frontal hypometabolism, and that total subcortical white matter changes were correlated with neuropsychiatric symptoms. There are extensive neural connections between subcortical nuclei and the frontal cortex, and disruption of these frontal–subcortical circuits have been associated with neuropsychiatric symptoms.23 Subcortical lesions may therefore affect frontal cortical function and neuropsychiatric symptomatology.
This study measured the extent of SH in patients with AD and examined the relationship of SH to cortical metabolism and clinical symptoms. We hypothesized that the extent of SH would be related to the degree of regional cortical hypometabolism and the severity of neuropsychiatric symptoms.
METHODS
Patients
The 18 male patients included in the study participated in a larger prospective study of cortical metabolism and psychiatric symptoms in AD at a university-affiliated medical center.18 Each patient underwent a thorough clinical evaluation that included complete blood count, chemistry panel, serum thyroid-stimulating hormone and vitamin B12 levels, syphilis serology, and a structural neuroimaging study. Cerebrospinal fluid analysis, electroencephalogram, urine heavy metal screen, and serum human immunodeficiency virus antibody assay were performed when clinically indicated. Final diagnosis was determined by a clinical research investigator.
Patients met the criteria for probable AD established by the National Institute of Neurological and Communicative Disorders and Stroke and the Alzheimer's Disease and Related Disorders Association (NINCDS-ADRDA).24 Patients were excluded from the study if there was a history of a psychotic disorder unrelated to dementia, a history of head trauma resulting in loss of consciousness, a psychoactive substance use disorder, or a systemic illness or other neurological condition that could account for the cognitive impairment. Patients were not included if there was evidence of stroke by history or on the structural neuroimaging study. All patients were free of psychoactive medications for at least 3 weeks prior to the research assessment. No patient had been treated with a cholinesterase inhibitor. Consecutive patients who met inclusion criteria and agreed to participate were included. Written informed consent was obtained after the procedures had been fully explained, according to Institutional Review Board guidelines.
Neuropsychiatric Assessment
The assessment of neuropsychiatric symptoms was performed within 2 weeks of the PET imaging procedure and included the Mini-Mental State Examination (MMSE), a measure of overall cognitive impairment, and the Neurobehavioral Rating Scale (NRS), a 28-item observer-rated assessment of cognitive and noncognitive symptoms.25 Principal-components analysis has revealed six NRS factors in patients with dementia: Agitation/Disinhibition, Anxiety/Depression, Behavioral Retardation, Psychosis, Cognition/Insight, and Verbal Output Disturbance.26 Each NRS item is scored on a scale of 0 (not present) to 6 (extremely severe). The NRS total score is the sum of the scores on all 28 items, and it is used in this study as a measure of overall neuropsychiatric symptomatology.
Magnetic Resonance Imaging
Magnetic resonance imaging was performed with a system operating at 0.35 tesla (MTS.35 MRI System, Diasonics, South San Francisco, CA). Contiguous axial images separated by 10 mm and parallel to the canthomeatal line were acquired by using spin-echo pulse sequences (T1-weighted images: TE [echo time]=30 ms, TR [repetition time]=500 ms; T2-weighted images: TE=60 ms, TR=1,500 ms). The MRIs were examined by two neurologists experienced in reading MRI (J.L.C. and M.E.M.) who were blind to patient identity. Severity of PVH and DWMH on T2-weighted images was measured with a visually graded scale.27 For PVH, 0 indicates absent; 1, “caps” or pencil-thin lining; 2, smooth “halo”; and 3, irregular lesions that extend into the deep white matter. For DWMH, 0 indicates absent; 1, punctate foci; 2, occasional confluence of foci; and 3, large confluent areas. These lesions were measured in each of the four horizontal subcortical quadrants: left anterior (LA), left posterior (LP), right anterior (RA), and right posterior (RP). Photographs of standard lesion severities were used to guide lesion scoring. Interrater reliability of this technique is high,28 and in this study lesion ratings were determined by consensus between the two readers. The sum of PVH and DWMH scores were used as the severity score for hyperintensities in each quadrant.
PET Imaging
Positron emission tomographic imaging of regional cerebral metabolic activity was performed using [18F]fluorodeoxyglucose (FDG) and a tomograph. All but two patients were scanned on an ECAT III Model 911, a single-ring instrument with a spatial resolution of 6 mm in plane and 11 mm in the axial direction at full-width half maximum. The other two patients were scanned on a newer, high-resolution model, the Siemens 953/31. FDG was synthesized at the PET Imaging Facility at Veterans Affairs Greater Los Angeles Healthcare System, using the technique described by Hamacher et al.29 Each patient received an intravenous dose of 5 to 10 mCi of FDG. During the uptake phase, the patient rested quietly in a dimly lighted room with eyes open and ears unplugged. Arterial blood samples were obtained at defined intervals to calculate absolute brain metabolic rates. Scanning began 40 minutes after FDG injection. The ECAT III Model 911 imaged 10 or 11 axial planes, parallel to the canthomeatal line, approximately 11 mm apart. The Siemens 953/31 obtained 31 axial slices, parallel to the canthomeatal line, each approximately 3 mm thick. Images from this tomograph were resliced and formatted to match the output from the ECAT.
PET Image Analysis
Cerebral regions of interest (ROI) were drawn for each PET image by one investigator experienced in reading PET images (D.L.S. or M.E.M.) who was blinded to the patient's identity. The 10 or 11 image slices from each scan were corrected for attenuation30 and displayed on a monitor using an image processor (Gould FD 5000, Gould, San Francisco, CA). Forty-one ROIs were identified in each hemisphere by using ROI templates of normal FDG-PET images, the patient's MRI, and a neuroanatomy atlas.31 Reliability of this technique has been previously demonstrated.32
Cerebral metabolic rate for glucose (CMR) was calculated for each ROI, according to the method of Sokoloff33 as applied to the noninvasive measurement of human cerebral glucose metabolism by several investigators.30,34 The mean absolute CMR in each of the five cortical lobes (frontal, parietal, occipital, temporal, and limbic) in each hemisphere was calculated by summing the absolute CMR of the ROIs, weighted for size, of the regions within the lobe. Finally, the absolute global CMR was calculated as the weighted sum of the CMR from the five cortical lobes.
Statistical Analysis
Relationships between SH and absolute cortical metabolic rates were examined within the hemispheres (n=36) by use of Spearman correlation coefficients (two-tailed test of significance). Cortical metabolism was presumed to be independent of contralateral subcortical effects. Relationships between SH and clinical symptoms were also examined with Spearman correlation coefficients. These analyses were repeated using MMSE rank as a covariate to examine these relationships independently of the effects of global cognitive impairment, which has been associated with both cortical pathology35 and noncognitive symptoms.9,36–40 Multivariate statistical analyses were not performed because of the limited sample size.
RESULTS
Patient Characteristics
Patients ranged in age from 61 to 85 years (mean [±SD] =70±7), and all were male. Age at onset of dementia ranged from 55 to 82 years (mean=65±8). Duration of dementia ranged from 2 to 8 years (mean=4±2). Years of education ranged from 10 to 20 (mean=14±3). MMSE scores ranged from 6 to 28 (mean=17±7). Hamilton Rating Scale for Depression (Ham-D) scores ranged from 1 to 16 (mean=7±4).
Subcortical MRI Hyperintensities
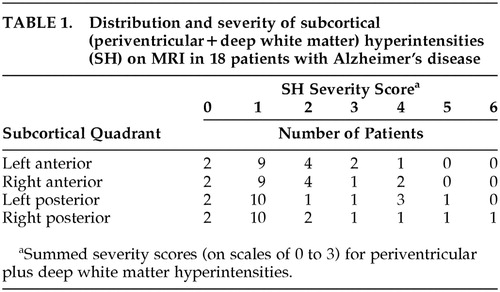
Severity of SH by quadrants for the 18 patients is shown in Table 1. The majority of patients had mild PVH and absent DWMH. The distribution of each lesion type was similar across quadrants for the group.
Regional Subcortical MRI Hyperintensities and Cortical Metabolic Rates
There was no significant correlation (P>0.05) between SH (PVH and DWMH individually and combined) and cerebral metabolic rate for the following: each subcortical quadrant and each ipsilateral cortical lobe; each subcortical and ipsilateral cortical hemisphere; and the whole subcortex and cortex. Covarying for MMSE scores also yielded no significant correlation in the same analyses.
Anterior Subcortical MRI Hyperintensities and Relative Frontal Cortical Hypometabolism
The two most common abnormal metabolic findings associated with AD are relative parietotemporal hypometabolism, found in approximately one-half of patients, and relative frontal hypometabolism, found in approximately one-quarter of patients.2 However, the cause of this difference between metabolic subgroups is uncertain. We hypothesized that the relative metabolic activities of anterior and posterior cortical regions might vary with the severity of SH. We calculated frontal/parietal metabolic ratios (as an estimate of anterior/posterior cortical metabolic ratios) and examined their relationship to ipsilateral anterior SH to test the hypothesis.
A scatterplot of this relationship is shown in Figure 1. A trend toward a negative correlation (r=–0.30, P=0.08) was found; that is, lower frontal/parietal metabolic ratios were correlated with greater severity of anterior SH. With covariance for MMSE scores to account for the effects of dementia severity, the relationship was more robust (r=–0.43, P=0.01).
To determine the specificity of this relationship, Spearman partial correlation coefficients (with MMSE as covariate) were calculated for the relationships between frontal/parietal ratios and hyperintensities in the ipsilateral subcortical hemispheres (r=–0.25, P=0.15), in the ipsilateral posterior subcortical quadrants (r=–0.06, P=0.75), and in the whole subcortex (r=–0.26, P=0.32). None of these relationships was statistically significant, suggesting that the relationship of ipsilateral anterior SH to lower frontal/parietal metabolic ratios has anatomic specificity.
MRI and PET images (Figure 2) from two patients with AD show a greater degree of relative frontal hypometabolism in the patient with greater anterior SH (bottom images) in comparison to the patient with minimal anterior SH.
Subcortical MRI Hyperintensities and Clinical Symptoms
There was no significant correlation between overall SH severity and scores on any measure of clinical symptomatology: MMSE, Ham-D, Neurobehavioral Rating Scale factors, or NRS total. There was, however, a trend toward a positive correlation between overall SH severity and NRS total scores (r=0.44, P=0.07). A scatterplot of this relationship is shown in Figure 3. When these analyses were repeated with MMSE scores as a covariate, results were nonsignificant.
Because of the regional subcortical effects on cortical metabolism found above, regionally specific relationships between severity of SH and neuropsychiatric symptomatology were explored. Trends toward a positive correlation between hyperintensities in the right and the anterior halves of the subcortex and NRS Psychosis factor scores were found (r=0.43, P=0.07, and r=0.41, P=0.09, respectively). These trends were not present after covarying for MMSE (r=0.35, P=0.17, and r=0.32, P=0.22, respectively). Hyperintensities in a number of subcortical regions reached or approached significant positive correlation with NRS total scores: right posterior quadrant (r=0.56, P=0.02); right hemisphere (r=0.51, P=0.03); posterior half (r=0.48, P=0.05); left anterior quadrant (r=0.45, P=0.06); and anterior half (r=0.45, P=0.06). Positive correlations between right posterior quadrant (r=0.53, P=0.03) and posterior half (r=0.48, P=0.05) SH and NRS total scores remained significant after covarying for MMSE.
DISCUSSION
This study combined structural and functional neuroimaging techniques to examine the relationship between subcortical lesions and cortical metabolic function in patients with AD. Results have potential implications for the effects of pathological processes on the function of distant brain regions and on neural tracts that connect brain regions. The network model for the working brain proposes that human mental activities are mediated by networks of interconnected brain regions.2,41 Horwitz and colleagues used FDG-PET and cerebral metabolic rate correlation matrices to elaborate on the network model.42–44 This method assumes that if the CMRs of two brain regions are significantly correlated, those two regions are functionally coupled; that is, the activity of one depends on or is related to the activity of the second. Among healthy older adults, many correlations occurred between frontal and parietal regions and between occipital and temporal regions.42 However, among patients with AD, functional uncoupling between intrahemispheric neocortical regions in the frontal–parietal domains was observed.43 The present study found that anterior subcortical MRI hyperintensities were associated with frontal hypometabolism relative to parietal metabolic function, with control for effects of dementia severity. This finding suggests that anterior subcortical MRI hyperintensities may contribute to the uncoupling of metabolic function, and possibly the disruption of neural connections, between frontal and parietal cortices in AD, independent of the effects of (cognitive) dementia severity.
A relationship between subcortical MRI hyperintensities and absolute metabolic rate in individual cortical lobes was not observed in this study. The lack of individual relationships may also be consistent with the network model. The activity of a brain region in a neural network is linked to the activity of several distributed and partially overlapping networks.2 Accordingly, a single discrete subcortical lesion can affect function in multiple cortical regions, which reduces the specificity of one-to-one subcortical–cortical effects. Attempts to understand the independent effect of each subcortical lesion type within a specific region, which might have better addressed the proposed hypothesis, were limited by the small study group size and the heterogeneity of lesion types and locations among the patients. Moreover, several of the analyses considered hemispheric SH and cortical metabolism to be independent of contralateral effects, an assumption that may not be valid in all circumstances.
This study demonstrated limited relationships between subcortical MRI hyperintensities and neuropsychiatric symptomatology. Significant relationships were observed only with NRS total scores and not with individual symptoms. A relationship with r>0.40 emerged between anterior SH and psychosis but did not reach statistical significance at the P<0.05 level, possibly because of the limited sample size and statistical power. Support for the relationship between frontal pathology and psychotic symptoms is strengthened by our earlier report of an association between hypometabolism in specific frontal brain regions and delusions in AD.45 Depression, which has been associated with subcortical lesions in patients with vascular dementia and nondemented elderly patients,17,46 was not associated with SH in this study. The relatively low level of depression in this study group, as well as the relatively modest severity of SH, may have contributed to this finding. A relationship in AD patients between global cortical hypometabolism and overall neuropsychiatric symptomatology, as well as between regional cortical hypometabolism and noncognitive symptoms, has been reported previously.18 Whether subcortical pathology contributes independently to the clinical expression of neuropsychiatric symptoms or does so through effects on cortical function in AD remains to be determined.
In addition to uncoupling frontal–parietal neural connections, subcortical pathology may directly affect frontal lobe function through disruption of frontal–subcortical circuits. Lesions within these circuits produce cognitive and behavioral alterations such as executive dysfunction, mood symptoms, apathy, and disinhibition.23 These symptoms are common in AD, and executive deficits are associated with other neuropsychiatric difficulties and functional impairment.47 FDG-PET studies of patients with subcortical degenerative diseases, including Parkinson's disease, Huntington's disease, and progressive supranuclear palsy, have demonstrated frontal hypometabolism.48–50 In patients with vascular dementia but no cortical lesions, subcortical hyperintensities were shown to be related to frontal hypometabolism and clinical symptoms.22 These findings, as well as the relationship between SH and relative frontal hypometabolism observed in the current study, suggest that there may be subcortical–frontal relationships that are common across neuropsychiatric disorders.
Limitations of this study deserve comment, and some conclusions are tentative. The small number of patients reduced the power of the correlation analyses, and high coefficient values were needed to attain statistical significance. Although statistically significant relationships are likely to be more robust and meaningful in this circumstance, the possible presence of less robust relationships can be neither confirmed nor excluded. The small sample size and heterogeneity in age, education, and duration of dementia also limit the applicability of our results to another group of patients with AD. The small sample prohibits inclusion in the analytic models of many independent variables to account for the group's heterogeneity.
Patients with extensive subcortical pathology were excluded to satisfy NINCDS-ADRDA criteria for probable AD.24 This criterion may have resulted in type II errors by reducing the variance of subcortical pathology and the likelihood of finding statistically significant results for relationships that truly exist. However, including patients with more extensive subcortical pathology might have reduced the diagnostic specificity of our study group. In measuring the severity of subcortical hyperintensities for each patient, we combined scores measuring periventricular and deep white matter hyperintensities into a single score, thereby making the assumption that the effects of these lesions on the factors of interest are equal for a given score and are additive. Although each lesion type has been shown to be related to the same risk factors for dementia,9 our assumption lacks the support of further evidence. Finally, statistical methodology did not include correction for multiple comparisons because of the exploratory nature of this study and interest in reducing the likelihood of type II as well as type I error.
In summary, this study indicates that anterior subcortical MRI hyperintensities influence relative frontal–parietal metabolic activity in patients with AD, but no direct effect of local SH on absolute regional cortical metabolism is apparent. Subcortical hyperintensities do not appear to have marked effects on individual clinical symptoms, although total neuropsychiatric symptoms may reflect regional subcortical pathology. Complex and overlapping neural networks involved in brain processes and behavior make the role of subcortical MRI hyperintensities in AD challenging to elucidate, but results from this study indicate that these lesions may play a pathophysiologic role in AD.
ACKNOWLEDGMENTS
This project was supported in part by the National Institute of Mental Health (Grants MH56031 and MH00910), National Institute on Aging (Alzheimer's Disease Core Center Grant AG10123), and Department of Veterans Affairs (Merit Review grant, Postdoctoral Fellowship in Psychiatric Research and Neurosciences).

FIGURE 1. Relationship between anterior subcortical MRI hyperintensities and ipsilateral frontal/parietal metabolic ratios in 18 patients with Alzheimer's disease. rPCC=Spearman partial correlation coefficient; PPCC=P-value, Spearman partial correlation (with Mini-Mental State Examination score as covariate).

FIGURE 2. Representative MRI and FDG-PET imaging horizontal slices from two patients (present study) with Alzheimer's disease. Brighter signal on PET indicates higher glucose metabolism. In the first patient, the T2-weighted MRI image (upper left) shows minimal or absent subcortical hyperintensities; the corresponding PET (upper right) shows preserved metabolic function in the frontal cortical regions relative to the parietal cortices. In the second patient, the fluid-attenuated inversion recovery sequence (FLAIR) MRI (lower left) shows more extensive anterior periventricular hyperintensities; the corresponding PET image (lower right) shows relatively low frontal metabolism.

FIGURE 3. Relationship between overall severity of subcortical hyperintensities and Neurobehavioral Rating Scale (NRS) total score in 18 patients with Alzheimer's disease.
 |
1 Terry RD, Katzman R: Senile dementia of the Alzheimer type. Ann Neurol 1983; 14:497-506Crossref, Medline, Google Scholar
2 Rapoport SI: Positron emission tomography in Alzheimer's disease in relation to disease pathogenesis: a critical review. Cerebrovascular Brain Metabolism Review 1991; 3:297-335Medline, Google Scholar
3 Smith GS, de Leon MJ, George AE, et al: Topography of cross-sectional and longitudinal glucose metabolic deficits in Alzheimer's disease: pathophysiologic implications. Arch Neurol 1992; 49:1142-1150Crossref, Medline, Google Scholar
4 Fazekas F, Kapeller P, Schmidt R, et al: The relation of cerebral magnetic resonance signal hyperintensities to Alzheimer's disease. J Neurol Sci 1996; 142:121-125Crossref, Medline, Google Scholar
5 Scheltens P, Barkhof F, Leys D, et al: Histopathologic correlates of white matter changes on MRI in Alzheimer's disease and normal aging. Neurology 1995; 45:883-888Crossref, Medline, Google Scholar
6 Waldemar G, Christiansen P, Larsson HB, et al: White matter magnetic resonance hyperintensities in dementia of the Alzheimer type: morphological and regional cerebral blood flow correlates. J Neurol Neurosurg Psychiatry 1994; 57:1458-1465Crossref, Medline, Google Scholar
7 Hanyu H, Nakano S, Abe S, et al: Use of MRI in the diagnosis of dementia of the Alzheimer type. Nippon Ronen Igakkai Zasshi [Japanese Journal of Geriatrics] 1994; 31:388-395Crossref, Medline, Google Scholar
8 Brilliant M, Hughes L, Anderson D, et al: Rarefied white matter in patients with Alzheimer disease. Alzheimer Dis Assoc Disord 1995; 9:39-46Crossref, Medline, Google Scholar
9 Bowen BC, Barker WW, Loewenstein DA, et al: MR signal abnormalities in memory disorder and dementia. Am J Roentgenol 1990; 154:1285-1292Crossref, Medline, Google Scholar
10 Ylikoski A, Erkinjuntti T, Raininko R, et al: White matter hyperintensities on MRI in the neurologically nondiseased elderly: analysis of cohorts of consecutive subjects aged 55 to 85 years living at home. Stroke 1995; 26:1171-1177Crossref, Medline, Google Scholar
11 Sullivan P, Pary R, Telang F, et al: Risk factors for white matter changes detected by magnetic resonance imaging in the elderly. Stroke 1990; 21:1424-1428Crossref, Medline, Google Scholar
12 Ott BR, Faberman RS, Noto RB, et al: A SPECT imaging study of MRI white matter hyperintensity in patients with degenerative dementia. Dement Geriatr Cogn Disord 1997; 8:348-354Crossref, Medline, Google Scholar
13 Kawamura J, Meyer JS, Ichijo M, et al: Correlations of leuko-araiosis with cerebral atrophy and perfusion in elderly normal subjects and demented patients. J Neurol Neurosurg Psychiatry 1993; 56:182-187Crossref, Medline, Google Scholar
14 Ishijima M, Imazu O, Kitamura S, et al: Clinico-pathological evaluation of leukoaraiosis in Alzheimer's disease. Nippon Ronen Igakkai Zasshi [Japanese Journal of Geriatrics] 1996; 33:744-753Crossref, Medline, Google Scholar
15 Marder K, Richards M, Bello J, et al: Clinical correlates of Alzheimer's disease with and without silent radiographic abnormalities. Arch Neurol 1995; 52:146-151Crossref, Medline, Google Scholar
16 Kaieda M: Clinical significance of periventricular high intensity lesions on magnetic resonance imaging in dementia. Nippon Ika Daigaku Zasshi [Journal of the Nippon Medical School] 1991; 58:209-218Medline, Google Scholar
17 O'Brien J, Desmond P, Ames D, et al: A magnetic resonance imaging study of white matter lesions in depression and Alzheimer's disease. Br J Psychiatry 1996; 168:477-485Crossref, Medline, Google Scholar
18 Sultzer DL, Mahler ME, Mandelkern MA, et al: The relationship between psychiatric symptoms and regional cortical metabolism in Alzheimer's disease. J Neuropsychiatry Clin Neurosci 1995; 7:476-484Link, Google Scholar
19 Feeney DM, Baron JC: Diaschisis. Stroke 1986; 17:817-830Crossref, Medline, Google Scholar
20 Meyer JS, Obara K, Muramatsu K: Diaschisis. Neurol Res 1993; 15:362-366Crossref, Medline, Google Scholar
21 Baron JC, Levasseur M, Mazoyer B, et al: Thalamocortical diaschisis: positron emission tomography in humans. J Neurol Neurosurg Psychiatry 1992; 55:935-942Crossref, Medline, Google Scholar
22 Sultzer DL, Mahler ME, Cummings JL, et al: Cortical abnormalities associated with subcortical lesions in vascular dementia: clinical and position emission tomographic findings. Arch Neurol 1995; 52:773-780Crossref, Medline, Google Scholar
23 Cummings JL: Frontal-subcortical circuits and human behavior. Arch Neurol 1993; 50:873-880Crossref, Medline, Google Scholar
24 McKhann G, Drachman D, Folstein M, et al: Clinical diagnosis of Alzheimer's disease: report of the NINCDS-ADRDA Work Group under the auspices of Department of Health and Human Services Task Force on Alzheimer's Disease. Neurology 1984; 34:939-944Crossref, Medline, Google Scholar
25 Levin HS, High WM, Goethe KE, et al: The Neurobehavioural Rating Scale: assessment of the behavioural sequelae of head injury by the clinician. J Neurol Neurosurg Psychiatry 1987; 50:183-193Crossref, Medline, Google Scholar
26 Sultzer DL, Levin HS, Mahler ME, et al: Assessment of cognitive, psychiatric, and behavioral disturbances in patients with dementia: the Neurobehavioral Rating Scale. J Am Geriatr Soc 1992; 40:549-555Crossref, Medline, Google Scholar
27 Coffey CE, Figiel GS, Djang WT, et al: Subcortical hyperintensity on magnetic resonance imaging: a comparison of normal and depressed elderly subjects. Am J Psychiatry 1990; 147:187-189Crossref, Medline, Google Scholar
28 Coffey CE, Wilkinson WE, Weiner RD, et al: Quantitative cerebral anatomy in depression: a controlled magnetic resonance imaging study. Arch Gen Psychiatry 1993; 50:7-16Crossref, Medline, Google Scholar
29 Hamacher K, Coenen HH, Stocklin G: Efficient stereospecific synthesis of no-carrier-added 2-[18F]-fluoro-2-deoxy-d-glucose using aminopolyether supported nucleophilic substitution. J Nucl Med 1986; 27:235-238Medline, Google Scholar
30 Phelps ME, Huang SC, Hoffman EJ, et al: Tomographic measurement of local cerebral glucose metabolic rate in humans with (F-18)2-fluoro-2-deoxy-d-glucose: validation of method. Ann Neurol 1979; 6:371-388Crossref, Medline, Google Scholar
31 Matsui T, Hirano A, Imai T: An Atlas of the Human Brain for Computerized Tomography. Tokyo and New York, Igaku Shoin, 1978Google Scholar
32 Small GW, Stern CE, Mandelkern MA, et al: Reliability of drawing regions of interest for positron emission tomographic data. Psychiatry Research: Neuroimaging 1992; 45:177-185Crossref, Medline, Google Scholar
33 Sokoloff L: Circulation and energy metabolism in the brain, in Basic Neurochemistry, edited by Siegel GJ, Albers RW, Katzman R, et al. Boston, Little, Brown, 1981, pp 471-495Google Scholar
34 Reivich M, Kuhl D, Wolf A, et al: The [18F] fluorodeoxyglucose method for the measurement of local cerebral glucose utilization in man. Circ Res 1979; 44:127-137Crossref, Medline, Google Scholar
35 Boone KB, Miller BL, Lesser IM, et al: Neuropsychological correlates of white-matter lesions in healthy elderly subjects: a threshold effect. Arch Neurol 1992; 49:549-554Crossref, Medline, Google Scholar
36 Aronson MK, Post DC, Guastadisegni P: Dementia, agitation, and care in the nursing home. J Am Geriatr Soc 1993; 41:507-512Crossref, Medline, Google Scholar
37 Mayberg HS: Clinical correlates of PET- and SPECT-identified defects in dementia. J Clin Psychiatry 1994; 55:12-21Medline, Google Scholar
38 Ryden MB: Aggressive behavior in persons with dementia who live in the community. Alzheimer Dis Assoc Disord 1988; 2:342-355Crossref, Medline, Google Scholar
39 Slansky I, Herholz K, Pietrzyk U, et al: Cognitive impairment in Alzheimer's disease correlates with ventricular width and atrophy-corrected cortical glucose metabolism. Neuroradiology 1995; 37:270-277Crossref, Medline, Google Scholar
40 Swearer JM, Drachman DA, O'Donnell BF, et al: Troublesome and disruptive behaviors in dementia: relationships to diagnosis and disease severity. J Am Geriatr Soc 1988; 36:784-790Crossref, Medline, Google Scholar
41 Luria AR: The working brain: an introduction to neuropsychology. London, Allan Lane, 1978Google Scholar
42 Horwitz B, Duara R, Rapoport SI: Intercorrelations of glucose metabolic rates between brain regions: application to healthy males in a state of reduced sensory input. J Cereb Blood Flow Metab 1984; 4:484-499Crossref, Medline, Google Scholar
43 Horwitz B, Grady CL, Schlageter NL, et al: Intercorrelations of regional cerebral glucose metabolic rates in Alzheimer's disease. Brain Res 1987; 407:294-306Crossref, Medline, Google Scholar
44 Horwitz B, Rapoport SI: Partial correlation coefficients approximate the real intrasubject correlation pattern in the analysis of interregional relations of cerebral metabolic activity. J Nucl Med 1988; 29:392-399Medline, Google Scholar
45 Sultzer DL: Behavioral syndromes in dementia: neuroimaging insights. Semin Clin Neuropsychiatry 1996; 1:261-271Medline, Google Scholar
46 Krishnan KR, Hays JC, Blazer DG: MRI-defined vascular depression. Am J Psychiatry 1997; 154:497-501Crossref, Medline, Google Scholar
47 Chen ST, Sultzer DL, Hinkin CH, et al: Executive dysfunction in Alzheimer's disease: association with neuropsychiatric symptoms and functional impairment. J Neuropsychiatry Clin Neurosci 1998; 10:426-432Link, Google Scholar
48 Karbe H, Grond M, Huber M, et al: Subcortical damage and cortical dysfunction in progressive supranuclear palsy demonstrated by positron emission tomography. J Neurol 1992; 239:98-102Crossref, Medline, Google Scholar
49 Mayberg HS, Starkstein SE, Sadzot B, et al: Selective hypometabolism in the inferior frontal lobe in depressed patients with Parkinson's disease. Ann Neurol 1990; 28:57-64Crossref, Medline, Google Scholar
50 Mayberg H, Starkstein SE, Peyser CE, et al: Paralimbic frontal lobe hypometabolism in depression associated with Huntington's disease. Neurology 1992; 42:1791-1797Crossref, Medline, Google Scholar