Cerebral Blood Flow Changes Associated With Schneiderian First-Rank Symptoms in Schizophrenia
Abstract
The authors examined the severity of Schneiderian first-rank symptoms in relation to regional cerebral blood flow (rCBF) with the use of PET. Eighty-seven schizophrenic patients were imaged during an eyes-closed condition during which they were instructed to relax and not perform any specific task (random episodic silent thought, or REST). Schneiderian symptoms were rated by using structured assessment instruments. The Schneiderian score of the patients was positively correlated with rCBF in right superior parietal cortex and negatively correlated with rCBF in left posterior cingulate gyrus and in left lingual gyrus. The results of this study demonstrate a cerebral pattern of activation related to Schneiderian symptoms and reinforce the hypothesis of an involvement of cortical areas that mediate space and body representation in such phenomena.
First-rank symptoms, described by Kurt Schneider1 as very specific to schizophrenia, are among the more florid manifestations of this disorder. They include the perception of voices speaking about the patients or to them (voices conversing or commenting); the belief that thoughts have been broadcast, stolen, or inserted (thought broadcasting, withdrawal, or insertion); and the belief that actions or thoughts are controlled by outside forces or other people (made actions, made thoughts). There has been much debate about the significance of Schneiderian symptoms in the diagnosis of schizophrenia. The original notion suggested by Schneider that they are pathognomonic for this disorder is inconsistent with the current construct of schizophrenia as defined by the recent editions of DSM. The specificity of Schneiderian symptoms for schizophrenia depends on the narrowness of their definition and is no longer considered to be as pathognomonic as originally proposed by Schneider.2 In this report, we were interested in trying to better understand the neuroanatomic areas that may be involved in their production.
According to Schneider the primary common characteristic of these symptoms is that actions and personal states of the patients are not experienced as their own: patients suffer from a disorder of “selfness.”1 Patients have lost the normal sensation of agency of their own thoughts and actions. In thought insertion, thought broadcasting, or thought withdrawal, personal thoughts and those of others are mixed, and during verbal hallucinations patients may hear speech that they do not recognize as their own and attribute the voices to someone else speaking around them. There is a loss of the intimate boundaries separating the self from others. This loss can express itself not only in patients feeling invaded by other people, but also in the inverse feeling of controlling others (which can express itself in megalomania, often a subjective sensation rather than a pathological intellectual interpretation). It involves problems in the attribution of thoughts and actions between patients and other people.
Schneiderian first-rank symptoms have been related to a defect in monitoring one's own actions and intentions3,4 and to an impairment of a specific system allowing the attribution of the executed and seen actions to their respective authors.5,6 This mechanism allowing the identification of the originator of an action should involve cerebral areas implicated in both execution and observation of actions. PET studies have shown that numerous brain regions are activated during such tasks but also that there is a cerebral pattern of activation common to the execution and the observation of a similar action.7,8 This pattern includes the parietal lobe (Brodmann area [BA] 40), part of the supplementary motor area, the ventral premotor area, and the cerebellum.
We hypothesized that Schneiderian symptoms would be related to excessive activity in these regions linked to vivid mental imagery of action, leading to an impaired representation of the subject's and others' actions. A recent PET study concerning passivity phenomena in schizophrenia,9 which are part of the Schneiderian symptoms, stressed the role of the right parietal cortex. To our knowledge, the present study is the first one to explore cerebral blood flow of schizophrenic patients in relation to the intensity of first-rank symptoms.
METHODS
Subjects
Eighty-seven patients who received diagnoses of schizophrenia according to the DSM-IV (22 women and 65 men) were included in the study. The mean age of patients was 30.8±9.4 years (mean±SD reported throughout), and their mean education level was 13.1±2.3 years; 80.5% of the subjects were right-handed according to the Edinburgh Inventory.10 The mean duration of illness was 123±113 months; mean age at onset was 22.6±6.8 years. All patients were either drug naive or had been withdrawn from medication for 3 weeks prior to participating in neuroimaging studies.
Clinical Assessment
All subjects were assessed with the Comprehensive Assessment of Symptoms and History (CASH) to systematically determine the presence of schizophrenia and to exclude concomitant severe substance abuse, medical or neurologic illness, head trauma, and mental retardation. The Scale for Assessment of Positive Symptoms (SAPS)11 and Scale for Assessment of Negative Symptoms (SANS)12 ratings used in the present study were drawn from the CASH. Mean scores for the last month were SAPS, 44.3±20.9 (range 0–113) and SANS, 53.1±20.7 (range 15–103). A Schneiderian subscore was calculated by adding seven items (item 2: voices commenting; item 3: voices conversing; item 15: delusions of being controlled; item 16: delusions of mind reading; item 17: thought broadcasting; item 18: thought insertion; item 19: thought withdrawal) from the SAPS.11 Seventy subjects had a subscore greater than zero; the mean value, out of a maximum of 35, was 7.3±7.1 (range 0–26). To assess the nature of this subscore, we calculated a Spearman's correlation score between its two parts (influence considered broadly: SAPS items 15–19, and verbal hallucinations: SAPS items 2 and 3). This confirmed the homogeneity of this group of symptoms (r=0.55, P<0.000001). All patients gave written informed consent to protocols that had been approved by the University of Iowa Human Subjects Committee.
Cognitive State
Subjects were studied during a condition referred as REST (random episodic silent thought), which has been included in multiple PET protocols in our center. They were instructed to lie quietly with their eyes closed. We have conducted empirical studies of REST and determined that during this condition subjects think principally about past and future experiences.13
PET and MRI Data Acquisition and Processing
Regional cerebral blood flow (rCBF) was measured with the bolus H2[15O] method,14 using a GE-4096-PLUS Scanner. Fifteen slices (6.5 mm center to center), with an intrinsic in-plane resolution of 6.5 mm full width at half maximum and a 10-cm axial field of view, were acquired. Images were acquired over a 100-s interval following venous injection of 50–75 mCi of H2[15O] and were reconstructed for a 40-s interval following bolus transit, determined by time-activity curves from a region of interest over a cerebral artery. Arterial blood sampling allowed calculation of tissue perfusion in ml/min/100 g tissue by use of the autoradiographic method.15 The Image Processing Laboratory (IPL) of the Mental Health Clinical Research Center processed quantitative flow images.
MR images consisted of contiguous coronal slices 1.5 mm thick, acquired on a 1.5-tesla GE Signa scanner using an SPGR sequence (flip angle=40°, echo time=5 ms, repetition time=24 ms, number of excitations=2). Images were transferred to the IPL for analysis through use of Silicon Graphics workstations and locally developed software (BRAINS).16 The initial step of postacquisition processing involved a combination of automated edge detection techniques and manual tracing to separate brain from CSF. All brains were realigned parallel to the anterior commissure–posterior commissure line and the interhemispheric fissure to ensure comparability of head position across subjects. Finally, images were resliced in three orthogonal planes to produce a three-dimensional data set for visualization and analysis.
An edge detection algorithm automatically identified the outer borders of the PET images. A series of filtering and thresholding steps performed on the PET image allowed edge detection. The image was thresholded to 150% of the mean of all pixels in the image, values below the threshold were set to zero, and values over 150% were not changed. This permitted the distinction of voxels containing tissue from those containing CSF. Then a 3×3 mean filtering kernel was applied to the unfiltered PET image, and the filtering process was repeated 10 times; each time the remaining voxels were used to generate a mean flow value and the 150% threshold was reapplied. The filtering process allowed a very sensitive edge detection such that the edge of the brain was clearly delineated from surrounding CSF. In this manner the total brain blood flow rate was adjusted for any atrophic changes.
Each patient's PET and MR images were co-registered using a least-squares minimization procedure to fit the surface images.17 The surface fit data were then used as input parameters for a variance minimization program.18 Brain landmarks identified on the MR image were then used to place each co-registered image into a standardized coordinate space.19 An 18-mm Hanning filter was applied to the PET images to eliminate residual anatomical variability. Blood flow was computed from PET count measures by using the arterial blood flow curves, which reflect absolute cerebral blood flow.
Regional Blood Flow Analysis
Analysis of rCBF was performed by using locally developed software computing the Pearson correlation between Schneiderian subscores and regional cerebral blood flow (ml/min/100 g) for each voxel in the spatially normalized and smoothed PET images.20 Resolution was reduced from a voxel size of 1.08 mm× 1.35×1.48 to 3.0 mm×2.7 mm×2 mm to decrease the time required to compute the large number of correlations. In assessing the correlation matrix, the probability levels were adjusted to reflect the number of independent resolution elements or “resels.” The number of resels is calculated for each analysis of averaged PET images, and it is the experience of our imaging laboratory that the total PET brain volume typically comprises approximately 300 independent resels. Therefore, for the purpose of conducting the correlation analysis described below, we specified r=0.35 as significant, which corresponds to P=0.001 given 87 subjects (df=85). Resel data were treated as a collection of data vectors; the length was defined by the number of subjects. The blood flow values within each voxel were used to calculate a Pearson correlation with the Schneiderian subscore. A 3-D correlation matrix displaying correlation coefficients for every voxel was displayed, representing the overall pattern of the relationship between blood flow and Schneiderian symptoms across brain regions. Magnitude and volume thresholds were applied, so that only regions larger than 50 contiguous voxels with a Pearson correlation coefficient in each voxel greater than r=0.35 were displayed. Talairach coordinates19 were used to identify the maximum correlation within the region of significance.
RESULTS
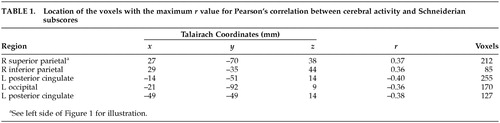
A significant positive correlation between Schneiderian scores and rCBF was observed only in two regions of right parietal cortex (r=0.37 in BA 7/40 and r=0.36 in BA 40). Figure 1 depicts the regional distribution of the increase in rCBF. A negative correlation was also observed in left posterior cingulate gyrus (r= –0.40 and r=0.38; BA 30) and in left lingual gyrus (r= –0.36; BA 18). The Talairach coordinates for the location of these regions are given in Table 1.
DISCUSSION
These results provide further support for a relationship between Schneiderian symptoms and increased blood flow of the right parietal cortex found in a previous study concerning a subset of the Schneiderian symptoms.9 This parietal cortical association area is involved in perception of space and has been shown to be active during both execution and observation of grasping movements.7,8 Our result strengthens the idea that Schneiderian symptoms are associated with an impairment in the mechanisms underlying the recognition of originators of actions. The left posterior cingulate region, in which rCBF had a negative correlation with Schneiderian symptoms, has been the subject of several studies. It projects to and receives afferents from the pulvinar, which is also connected with parietal and prefrontal cortex.21 Its role in mental diseases remains to be clarified; however, an increase in activity in this region has been found in obsessive-compulsive disorder (OCD) just before the ritualizing phase.22 We would suggest that this area may mediate the anxiety related to rituals. Increased activity in this area might also be related to the excessive self-control observed in OCD, whereas the inverse relation between posterior cingular activity and Schneiderian symptoms observed in the present study could be associated with a lack of control of the patients' own thoughts and acts. The negative correlation found between Schneiderian symptoms and the activity of area 18, which is a secondary visual area, is more difficult to explain. Decreased activity in this region could be related to abnormal mental imagery, rather than to overly vivid mental imagery.23 The mental imagery of Schneiderian patients may be more related to physical activity, as indicated by the hyperactivation of area 40, than to visual activity, resulting in a decrease in occipital activity.
Other imaging studies concerning psychotic symptoms have been conducted. Several methodological differences between those and the present study make it difficult to directly compare their results and ours. For example, Liddle et al.24 studied relationships between rCBF and schizophrenic symptoms in 30 patients. Although one of the three symptom factors was reality distortion, corresponding to delusions and hallucinations, they were studying broadly defined psychotic symptoms rather than more narrowly defined Schneiderian ones. Therefore, the pattern of rCBF that they found (positive correlations between reality distortion syndrome and left parahippocampal gyrus and left ventral striatum; negative correlation between that syndrome and right posterior cingulate) was related to psychotic symptoms in general.
Several studies have also examined verbal hallucinations. One of them,25 using single-photon emission computed tomography (SPECT), scanned 12 patients when they were experiencing hallucinations and after that symptom has resolved. That study focused on regions of interest situated in frontal and temporal lobes and did not examine parietal lobes. Another study26 analyzed regional brain metabolism on three slice levels in 12 patients who were hallucinating during the PET session. These two imaging studies were looking for the neural correlates of the hallucinating state and used restricted methods adapted to demonstrate the hypothesis of an abnormal inner language during auditory-verbal hallucinations. Other PET27 or functional MRI28 studies have examined involvement of auditory-language cortices in hallucinatory phenomena. Both of these studies focused on the brain events occurring when the patients experience hallucinations. The PET study27 showed that patients with verbal hallucinations displayed maximal activity in the bilateral thalamus, left hippocampus, left parahippocampal gyrus, and right ventral striatum; these regions probably play a role in generating an internal representation of external world and in putting together mnemonic data, current perceptual data, and affective representations. The fMRI study28 demonstrated the involvement of primary auditory areas in verbal hallucinatory phenomena. So, although structures implied in language production and in mnemonic associative functions are involved in hallucinatory production, Schneiderian symptoms considered as a whole are more related to abnormal body or action representation, as indicated by the involvement of right parietal cortex. This latter anomaly could lead to the loss of boundaries between self-generated and other-generated actions and thoughts underlying Schneiderian symptoms.
The present study treats Schneiderian symptoms as a group, linked by the concept of loss of autonomy or “selfness.” The results suggest that this group of symptoms is correlated with a brain dysfunction in areas implicated in action recognition (in particular, BA 40). Further imaging studies should confirm this correlation by using motor tasks29 that produce a subjective sense of loss of autonomy. Such experiments will be helpful to understand relationships between cerebral functioning and psychotic symptoms.
ACKNOWLEDGMENTS
The authors acknowledge Bill McKirgan for his helpful contribution. N.F. was supported by CSR Le Vinatier and Laboratoire Lundbeck.

FIGURE 1. Three orthogonal views: transaxial (top), sagittal (middle) and coronal. The set of images at left was selected to illustrate the activations in Table 1; these images are a peak map of contiguous voxels with a correlation value of r=0.37. The images at right are a statistical map showing all r-values for Pearson's correlation between cerebral activity and Schneiderian subscores. Reference axes are shown in green for Talairach coordinates x=27, y= –70.
 |
1 Schneider K: Klinische Psychopathologie. Stuttgart, Thieme Verlag, 1955Google Scholar
2 O'Grady JC: The prevalence and diagnostic significance of Schneiderian first-rank symptoms in a random sample of acute psychiatric in-patients. Br J Psychiatry 1990; 156:496-500Crossref, Medline, Google Scholar
3 Frith CD: The Cognitive Neuropsychology of Schizophrenia. Hove, UK, Lawrence Erlbaum, 1992Google Scholar
4 Mlakar J, Jensterle J, Frith CD: Central monitoring deficiency and schizophrenic symptoms. Psychol Med 1994; 24:557-64Crossref, Medline, Google Scholar
5 Daprati E, Franck N, Georgieff N, et al: Looking for the agent: an investigation into consciousness of action and self-consciousness in schizophrenic patients. Cognition 1997; 65:71-96Crossref, Medline, Google Scholar
6 Georgieff N, Jeannerod M: Consciousness of external reality: a “who” system for consciousness of action and self-consciousness. Conscious Cogn 1998; 7:465-477Crossref, Medline, Google Scholar
7 Rizzolatti G, Fadiga L, Matelli M, et al: Localization of grasp representations in human by PET, 1: observation versus execution. Exp Brain Res 1996; 111:246-252Crossref, Medline, Google Scholar
8 Grafton ST, Arbib MA, Fadiga L, et al: Localization of grasp representations in humans by positron emission tomography, 2: observation compared with imagination. Exp Brain Res 1996; 112:103-111Crossref, Medline, Google Scholar
9 Spence SA, Brooks DJ, Hirsch SR, et al: A PET study of voluntary movement in schizophrenic patients experiencing passivity phenomena (delusions of alien control). Brain 1997; 120:1997-2011Crossref, Medline, Google Scholar
10 Oldfield RC: The assessment and analysis of handedness: the Edinburgh Inventory. Neuropsychologia 1971; 9:97-113Crossref, Medline, Google Scholar
11 Andreasen NC: Scale for the Assessment of Positive Symptoms (SAPS). Iowa City, IA, University of Iowa, 1984Google Scholar
12 Andreasen NC: Scale for the Assessment of Negative Symptoms (SANS). Iowa City, IA, University of Iowa, 1983Google Scholar
13 Andreasen NC, O'Leary DS, Cizadlo T, et al: Remembering the past: two facets of episodic memory explored with positron emission tomography. Am J Psychiatry 1995; 152:1576-1585Crossref, Medline, Google Scholar
14 Herscovitch P, Markham J, Raichle ME: Brain blood flow measured with intravenous [15O], I: theory and error analysis. J Nucl Med 1983; 24:782-789Medline, Google Scholar
15 Hichwa RD, Ponto LLB, Watkins GL: Clinical blood flow measurements with [15O] water and positron emission tomography, in Chemists' Views of Imaging Centers, edited by Emran AM. New York, Plenum, 1995, pp 401-417Google Scholar
16 Andreasen NC, Cohen G, Harris G, et al: Image processing for the study of brain structure and function: problems and programs. J Neuropsychiatry Clin Neurosci 1992; 4:125-133Link, Google Scholar
17 Andreasen NC, Cizadlo T, Harris G, et al: Voxel processing techniques for the antemortem study of neuroanatomy and neuropathology using magnetic resonance imaging. J Neuropsychiatry Clin Neurosci 1993; 5:121-130Link, Google Scholar
18 Woods RP, Cherry SR, Mazziotta JC: Rapid automated algorithm for aligning and reslicing PET images. J Comp Assist Tomogr 1992; 16:620-633Crossref, Medline, Google Scholar
19 Talairach J, Tournoux P (eds): Coplanar Stereotaxic Atlas of the Human Brain: Three-Dimensional Proportional System. Stuttgart, Thieme, 1988Google Scholar
20 Schultz SK, O'Leary DS, Boles Ponto LL, et al: Age-related changes in regional cerebral blood flow among young to mid-life adults. Neuroreport 1999; 10:2493-2496Crossref, Medline, Google Scholar
21 Baleydier C, Mauguiere F: Anatomical evidence for medial pulvinar connections with the posterior cingulate cortex, the retrosplenial area, and the posterior parahippocampal gyrus in monkeys. J Comp Neurol 1985; 232:219-28Medline, Google Scholar
22 McGuire PK, Bench CJ, Frith CD, et al: Functional anatomy of obsessive-compulsive phenomena. Br J Psychiatry 1994; 164:459-68Crossref, Medline, Google Scholar
23 Horowitz MJ: A cognitive model of hallucinations. Am J Psychiatry 1975; 132:789-795Crossref, Medline, Google Scholar
24 Liddle PF, Friston KJ, Frith CD, et al: Patterns of cerebral blood flow in schizophrenia. Br J Psychiatry 1992; 160:179-186Crossref, Medline, Google Scholar
25 McGuire PK, Shah GMS, Murray RM: Increased blood flow in Broca's area during auditory hallucinations in schizophrenia. Lancet 1993; 342:703-706Crossref, Medline, Google Scholar
26 Cleghorn JM, Franco S, Szechtman B, et al: Toward a brain map of auditory hallucinations. Am J Psychiatry 1992; 149:1062-1069Crossref, Medline, Google Scholar
27 Silbersweig DA, Stern E, Frith C: A functional neuroanatomy of hallucinations in schizophrenia. Nature 1995; 378:176-179Crossref, Medline, Google Scholar
28 Dierks T, Linden DEJ, Jandl M: Activation of Heschl's gyrus during auditory hallucinations. Neuron 1999; 22:615-621Crossref, Medline, Google Scholar
29 Franck N, Farrer C, Georgieff N, et al: Defective recognition of one's own actions in patients with schizophrenia. Am J Psychiatry 2001; 158:454-459Crossref, Medline, Google Scholar