The Clock Drawing Test: Diagnostic, Functional, and Neuroimaging Correlates in Older Medically Ill Adults
Abstract
This study evaluated the clock drawing test (CDT), a screening test sensitive to executive function, in 70 elderly psychiatric consultation patients. The CDT was compared to the Mini-Mental Status Examination (MMSE) on associations with psychiatric diagnoses, disposition status and radiographic findings. CDT and MMSE were correlated, and scores differed across psychiatric subgroups. In multivariate analysis, only age and CDT predicted disposition status. A lower CDT score correlated with a higher intercaudate ratio, indicating greater caudate atrophy. These findings suggest that the CDT indicates underlying subcortical pathology and deficiencies in executive function important for self-care.
The purpose of this study was to assess psychiatric diagnostic, functional, and neuroimaging correlates of the Clock Drawing Test (CDT) in an elderly consultation-liaison population. The CDT may be a useful test for psychiatric consultations because it is brief, easy to administer, and draws on several skills, including auditory comprehension, visuospatial ability, and constructional praxis. Additionally, the CDT may detect deficits in executive functioning that are overlooked by other routine cognitive tests, such as the Mini Mental Status Examination (MMSE).1–3 Since executive function relates to a person’s ability to plan, initiate, sequence, monitor and stop complex behavior, it may be particularly useful when assessing patients’ functional status.1,4
The MMSE is the most widely used bedside cognitive screening test and has therefore been compared to the CDT in several cognitively impaired populations. The scores are correlated in patients with varying degrees of dementia (absolute range r=0.50–0.69).5–9 While these correlations are moderately significant, they do not represent unity. This implies that the two tests measure different aspects of cognitive impairment. In fact, the MMSE is known to be a nonspecific measure of global cognitive function, while previous research suggests that the CDT may be a specific indicator of executive function.1–3 Two studies, one of an elderly community sample and another of an elderly clinic sample, found that performance on clock drawing tasks was strongly correlated with an executive function test (EXIT 25).2,3 Since executive dysfunction likely predicts poor everyday function, and more specifically inability to attend to one’s health care needs, CDT score may have particular usefulness in assessing one’s ability to live independently or functional status.1
Research regarding the CDT in the context of neuropsychiatric disorders suggests its utility in assessing functional status. For example, a low CDT score in a preoperative sample of geriatric patients predicted postoperative delirium.10 Poor CDT performance in longitudinal community based studies of elderly adults predicted short term cognitive decline11 and institutionalization.12 An additional study of elderly patients, with various levels of cognitive impairment, who were undergoing rehabilitation following hip fracture, found that CDT performance predicted functional status and correlated with the Functional Independence Measure (FIM).13
Since the CDT may be a measure of executive function, scores may correlate with radiographic findings of cerebral structures identified as having a role in executive function. Previous research has identified a discrete dorsolateral prefrontal subcortical circuit in which the caudate nucleus plays an integral role in mediating executive function.14–16 Few studies have attempted to identify the neural substrates involved in CDT performance. One study found that CDT performance correlated with gray matter volumes in the bilateral superior temporal regions.17 A second series found that decreased left posterior temporal regional cerebral blood flow was associated with low CDT score in patients with Alzheimer’s disease (AD).18 Finally, a study of elderly adults found that caudate atrophy, as measured by the cerebroventricular index 2 (CVI-2; bicaudate index) correlated with impairment in the CDT.19 This latter finding is particularly salient because the caudate is a potential relay in the frontal subcortical pathways linked to executive function.14–16
Given the relative lack of research examining the CDT in psychiatric consult populations, this study attempted to compare the CDT to the MMSE across psychiatric diagnostic subgroups. Previous research has identified the CDT and not the MMSE, as a measurement of executive function. Since executive function encompasses many of the skills required to live independently, the CDT and MMSE were examined for their usefulness in predicting functional outcome as determined by discharge status. Finally, given that the CDT and the MMSE may measure different categories of cognitive impairment, we used radiographic measurements of periventricular white matter disease (PVWMD) and intercaudate ratio (ICR) to elucidate the neuroanatomical correlates of these two tests.
METHOD
Subjects
A retrospective review of records was performed on 70 patients >55 years old who were seen in psychiatric consultation between September 2002 and March 2003. Patients were included in this analysis if they were older than 55 years and had information available on variables of interest, including DSM–IV psychiatric diagnosis, CDT score, MMSE score, recent head computed tomography (CT), and discharge disposition. During this time period, a total of 315 patients >55 years old were seen by the service. Of these patients, a CT was performed on 129. Concurrent CDTs were performed on 145 and MMSEs were performed on 173 patients. The primary limiting factor in developing a study sample of 70 patients was, therefore, the availability of recent CT scan. In order to determine if our study sample was representative, we compared variables of interest in patients with and without a CT scan. Those who had a recent CT scan were slightly older than those without (75 [SD=11] versus 73 [SD=11] years, p<0.05), were more cognitively impaired (CDT: 1.7 [SD=1.4] versus 2.5 [SD=1.6], p<0.001; MMSE: 20.2 [SD=7] versus 23.2 [SD=6.4], p<0.01) and were more likely to have a dementia or delirium diagnosis. They did not differ on other demographic or medical variables.
Functional Status
Discharge disposition was classified in descending order of function as follows: 1) home, 2) acute or subacute rehabilitation (rehab) or psychiatric hospitalization (psych), 3) home with services (svs), 4) nursing home, and 5) death. Analyses were conducted in two ways. First, each of the 5 variables was evaluated. Second, the five groups were collapsed into two general categories based on overall level of function. In the dichotomous categorization, patients were considered higher functioning if they were discharged to go home to an acute or subacute rehabilitation facility or to a psychiatric unit where, generally, patients are expected to be actively involved in self-care activities. Patients with presumed lower function were sent home with nursing services, to a nursing home or were deceased at discharge, indicating an acute or chronic need for assistance with multiple levels of function.
Psychiatric Diagnosis
Psychiatric diagnosis was given to all patients after being evaluated by the service attending staff (SJF, JWB). Based on the primary working diagnosis, patients were placed in one of four diagnostic categories: delirium, dementia, depression and other (i.e., substance abuse, primary psychotic disorders, anxiety disorders). If patients had both delirium and dementia, they were placed in the delirium category, as this would require the most immediate clinical attention.
MMSE
The MMSE was administered and scored according to standard instructions.20 The total number was calculated on the standard 0–30 scale.
CDT
The CDT was administered by asking patients to first draw the face of the clock and then to place the hands to indicate 10 minutes past 10 o’clock. The clock was scored from 0–4. The scoring system awards one point for drawing a closed circle, one point for placing numbers in the correct position, one point for including all 12 correct numbers, and one point for placing hands in the correct positions.21 While there are more elaborate scoring systems for the CDT,22 this scoring system was chosen for its simplicity and time efficiency in the clinical consultation context.
Radiographic Analysis
A retrospective review of all 70 CT scans of the brain was performed. Examinations were performed on a GE Lightspeed or Hispeed scanner (General Electric, Milwaukee) without the intravenous administration of contrast. Two neuroradiologists, blinded to all clinical data, reviewed and evaluated the CT data independently. The interobserver reliability (kappa) for these neuroradiologists exceeded 0.93 (p<0.001) for all observations. Patients were excluded if they had a major structural abnormality such as an intracranial mass or bleeding.
The degree of subcortical atrophy was estimated by calculating the intercaudate ratio (ICR). The ICR consists of measuring the distance from the medial borders of the heads of the caudate nuclei (which are the lateral borders of the frontal horns just in front of the foramen of Monro) divided by the distance measured along this line from the right to the left inner skull borders.23 Since the caudate nucleus may behave as a relay station with other brain structures to coordinate executive function and the CDT seems to be an important predictor of executive function, this measurement seemed especially relevant.14–16
Periventricular white matter disease (PVWMD) was assessed according to the following grading system: the bilateral frontal and parietal white matter regions were graded and awarded two points if the area of low attenuation reached from the lateral ventricle to the cortex, and one point if it was restricted to the periventricular region only. If no periventricular low attenuation was present, then a score of 0 was assigned for that region. The scores from the most severely affected left or right frontal region are added to the most severely affected parietal region to give the total white matter score, ranging from 0–4 points.24 PVWMD mainly represents subcortical arteriosclerotic disease and seems to be related to global cognitive function, which is probably due to involvement of the long associating tracts connecting the cortical areas in the periventricular white matter.25 This represents a more diffuse measure of cerebral damage in contrast to ICR.
Medical Comorbidity
In order to control for the potential confounding influence of medical comorbidity on cognitive and functional outcomes, a medical comorbidity score was calculated for each patient by applying criteria established by Charlson et al.27 The Charlson Comorbidity Index provides a means for deriving a weighted medical comorbidity score that has been found to predict morbidity and mortality among hospitalized medically ill patients. Diagnoses are weighted for severity on a scale of 1 (e.g., uncomplicated diabetes) to 6 (e.g., metastatic cancer) and summed to obtain a total score. We modified the scale to exclude dementia, as this would confound our results.
Data Analysis
Pearson correlation coefficients were calculated to determine bivariate relationships among continuous variables, including CDT and MMSE scores, neuroimaging measurements, and demographic and medical variables. Chi-square was used to test for associations among categorical variables. Analysis of variance (ANOVA) was used to assess differences in mean CDT and MMSE scores by psychiatric diagnostic group and dispositional outcome category. Finally, logistic regression was used to determine significant predictors of disposition status. An alpha level of 0.05 was used to determine statistical significance.
RESULTS
Characteristics of Subjects
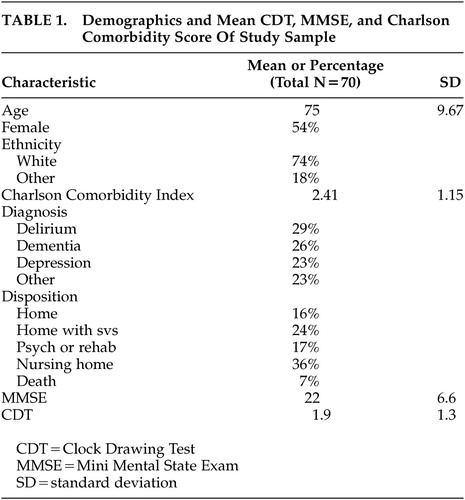
Table 1 shows the demographic and diagnostic composition of the study participants. The average age was 74.7 years (SD 9.67). The majority of the subjects were Caucasian, and there were roughly equal proportions of men and women. The CDT and MMSE score were significantly correlated (r=0.59, p<0.0001). Neither the CDT nor the MMSE were significantly associated with sociodemographic variables, including age. The mean Charlson Comorbidity Index score placed patients in the moderately medically ill range.
Psychiatric Diagnosis
As noted in Table 1, 18 (26%) patients were diagnosed with dementia. Of those patients, 12 (67%) were diagnosed with Alzheimer’s disease (AD); 4 (22%) were diagnosed with vascular dementia; 1 (6%) was diagnosed with comorbid vascular and AD; and 1 (6%) was diagnosed with alcohol related dementia. Also noted in Table 1, 20 (29%) patients were diagnosed with delirium. Of those patients with delirium, 5 (25%) had an etiology of hypoxia/diffuse cerebral ischemia (e.g., respiratory failure, congestive heart failure, anemia), 10 (50%) were the result of systemic disease (e.g., electrolyte/fluid imbalance, endocrine disease, hepatic failure, sepsis); 3 (15%) were the a result of drug intoxication or withdrawal (e.g. ethanol, CNS sedatives), and 1 (5%) was the result of a leptomenigeal disease. Eight of the patients with a diagnosis of delirium had a comorbid diagnosis of dementia.
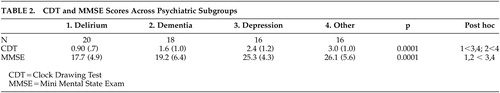
Both CDT and MMSE means differed significantly across groups (delirium 0.9 [SD=0.7] and 17.7 [SD=5.1]; dementia 1.6 [SD=1.0] and 19.2 [SD=6.9]; depression 2.4 [SD=1.2] and 25.3 [SD=3.9]; other 3 [SD=1] and 26.1 [SD=6], respectively) F=9.9 and 3.3, respectively, (p<0.0001) (Table 2). Post hoc tests indicated that MMSE significantly differentiated those with delirium or dementia from those with depression or other DSM–IV diagnoses. CDT distinguished patients with delirium from those with depression and other diagnoses; however, the difference between patients with dementia and depression did not quite reach statistical significance (p<0.06).
Disposition Status
In the first analysis comparing mean CDT and MMSE across the 5 dispositional categories, the CDT (p<0.01) but not the MMSE (p>0.20) differed across the five groups. Mean CDT scores clustered consistent with the dichotomous outcome described previously (Mean CDT: Home 2.7 [SD=1.3]; Rehabilitation or Psychiatry 2.5 [1.2]; Home With Services 1.9 [SD=1.3]; Nursing Home 1.5 [1.1], Death 0.8 [0.5]). In the second analysis utilizing the dichotomous dispositional outcome, both the CDT and, to a lesser extent, the MMSE were significantly different between the two groups. Consistent with this, when age, medical comorbidity, CDT, MMSE and ICR were entered as independent variables in a logistic regression equation predicting dichotomous dispositional status, only age (p<0.01) and CDT (p<0.05) were significant independent predictors.
Radiographic Findings
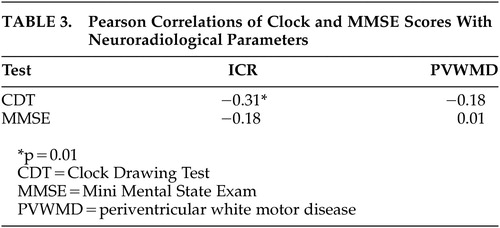
The average ICR did not differ significantly across psychiatric diagnostic groups (delirium 0.19 [SD=3.1], dementia 0.18 [SD=4.8], depression 0.18 [SD=3.8] and other 0.16 [SD=3.9] respectively). There was no significant difference between the burden of PVWD between diagnostic groups (delirium 1.8 [SD=1.2], dementia 2 [SD=1.4], depression 2 [SD=1.6] and other 1.5 [SD=1.5]). However, the CDT, and not the MMSE, correlated with subcortical and caudate atrophy measured by a higher ICR (r=−0.31, p<0.05) (Table 3). Neither the CDT nor the MMSE correlated with PVWMD. The ICR did not significantly differ by disposition status. The mean ICR for those patients with higher and lower functional status was 0.17 [SD=0.14], and 0.18 [SD=0.14], respectively (p=0.25).
DISCUSSION
The present study sought to examine the clinical utility of the CDT in elderly medical inpatients seen in psychiatric consultation, as assessed by its associations with psychiatric diagnosis, functional outcome and brain imaging measures. As found in other subgroups, MMSE performance and CDT were correlated in this population. As anticipated, participants with known cognitive disorders, such as patients with dementia or delirium, performed worse on these tests than patients with depression and other psychiatric diagnoses. However, while the MMSE and CDT significantly differentiated delirious from depressed patients and those with other kinds of psychiatric diagnoses, the CDT did not attain significance for differentiating demented from depressed patients. This finding may have clinical relevance. Several studies suggest that older depressed patients have impairments in executive function,27–28 mediated by fronto-striatal impairments.14,29 Since the CDT may be a sensitive measure of executive function, differences in CDT performance between demented and depressed patients may be expected to be attenuated.
In terms of functional status, analyses suggest that the CDT was a more sensitive and consistent predictor of disposition compared to the MMSE. The CDT was second only to age in predicting dispositional outcome in multivariate analyses. This might again be attributed to the superior ability of the CDT over the MMSE to detect deficits in executive function. Since executive function involves sequencing, planning, organizing, and modifying behavior, it seems logical that patients who have deficits in executive function will be more likely to need institutional support.
In terms of neuroimaging findings, the CDT, and not the MMSE, predicted subcortical and caudate atrophy, as measured by ICR (Figure 1 and Figure 2). Since the caudate nucleus may be essential to the dorsolateral prefrontal subcortical pathway involved in executive function, this finding further substantiates the link between CDT and ability to predict impairment of executive function.14–16 While, the ICR did not significantly predict disposition status, the numerically lower ICR in those with better functional status may reflect a type II error due to sample size. An additional explanation for this finding may be that the ICR is not the most sensitive neuroanatomical measure predicting functional status. Future studies, utilizing radiographic imaging that examines regional cerebral blood flow and/or cerebral metabolism (e.g. positron emission tomography or functional magnetic resonance imaging [MRI]) may identify additional anatomical components of the dorsolateral prefrontal circuit that predict functional status. Finally, future studies using a more specific measurement of executive functioning may find a correlation with ICR and functional status.
The CDT was not correlated with degree of PVWMD. This may be due to the fact that PVWMD is diffuse white matter damage and, unlike the ICR, not a defined measure of the structures involved with executive function. In addition, the MMSE did not correlate with degree of PVWMD. This finding may be related to the high rate of false negative MMSE results in patients with primary psychiatric illness or mild cognitive impairment.30,31
Several potential issues may limit this study. First, by requiring the presence of all variables of interest, there was a selection bias in choosing patients who were in general older and more cognitively impaired than those not included. However, if anything, this bias would have obscured differences in performance on the CDT and MMSE between subgroups, since older patients might be expected to demonstrate cognitive decline regardless of coexisting diagnosis. Second, radiographic measures were limited by resolution of CT scan. MRI, functional MRI or positron emission tomography (PET) scan, for example, may provide more accurate measurements of subcortical and cortical atrophy, which could potentially contribute to CDT and MMSE performance. Future research should attempt a prospective design with more sensitive radiographic measurements.
Despite these limitations, our findings suggest that the CDT may be a more effective tool than the MMSE to isolate deficits in executive function that directly affect patients’ ability to live independently. This is supported by the association of the CDT to subcortical and caudate atrophy as measured by the ICR. Although it is certainly not a substitute for a comprehensive cognitive assessment, the CDT may be a quick and efficacious way to assess medically ill elderly psychiatric patients, and is perhaps superior to MMSE in predicting degree of executive function and functional status.

FIGURE 1. 80-Year-Old Female With ICR=0.11 and CDT Score= 4
CDT=Clock Drawing Test

FIGURE 2. Eighty-Four Year Old Male With ICR=0.23 and CDT Score= 0
CDT=Clock Drawing Test
 |
 |
 |
1 Schillerstrom JE, Deuter MS, Wyatt R: Prevalence of executive impairment in patients seen by a psychiatry consultation service. Psychosomatics 2003; 44:290–297Crossref, Medline, Google Scholar
2 Royall DR, Cordes JA, Polk M: Clox: an executive clock drawing task. J Neurol Neurosurg Psychiatry 1998; 64:588–594Crossref, Medline, Google Scholar
3 Juby A, Tench S, Baker V: The value of clock drawing in identifying executive cognitive dysfunction in people with a normal Mini-Mental State Examination score. Can Med Assoc J 2002; 167:859–864Google Scholar
4 American Psychiatric Association: Diagnostic and Statistical Manual of Mental Disorders, 4th ed., Text Revision. Washington, DC, APA, 2000, pp 147-171Google Scholar
5 Heinik J, Solomesh I, Shein et al: Clock drawing test in mild to moderate dementia of the Alzheimer’s type: a comparative and correlation study. Int J Geriatr Soc 2002; 17:480–485Crossref, Medline, Google Scholar
6 Mendez MF, Ala T, Underwood T: Development of scoring criteria for the clock drawing task in Alzheimer’s disease. J Am Geriatr Soc 1992; 40:1095–1098Crossref, Medline, Google Scholar
7 Brodaty H, Moore CM: The clock drawing test for dementia of the Alzheimer’s type: a comparison of three scoring methods from a memory disorders clinic. Int J Geriatr Psychiatry 1997; 12:619–627Crossref, Medline, Google Scholar
8 Hideki U, Kitabayashi Y, Narumoto J: Relationship between clock drawing test performance and regional cerebral blood flow on Alzheimer’s disease: a single photon emission computed tomography study. Psychiatry Clin Neurosci 2002; 56:25–29Crossref, Medline, Google Scholar
9 Schramm U, Berger G, Muller R: Psychometric properties of clock drawing test and MMSE or short performance test (SKT) in dementia screening in a memory clinic population. Int J Geriatric Psychiatry 2002; 17:254–260Crossref, Medline, Google Scholar
10 Fisher BW, Flowerdew G: A simple method for predicting post op delirium in older patients undergoing elective orthopedic surgery. J Am Geriatr Soc 1995; 43:175–178Crossref, Medline, Google Scholar
11 Shulman KI, Pushkar Gold D, Cohen CA, et al: Clock drawing and dementia in the community: a longitudinal study. 1993; 8:487-496Google Scholar
12 O’Rourke N, Tuokko H, Hayden S, et al: Early identification of dementia: predictive validity of the clock test. Arch Clin Neuropsychol 1997; 12:257–267Crossref, Medline, Google Scholar
13 Adunsky A, Fleissig Y, Levenkrohn S, et al: A comparative study of mini-mental test, clock drawing task and cognitive-FIM in evaluating functional outcome of elderly hip fracture patients. Clin Rehabil 2002; 16:414–419Crossref, Medline, Google Scholar
14 Elliot R, Baker SC, Rogers RD, et al: Prefrontal dysfunction in depressed patients performing a complex planning task: a study using positron emission tomography. Psychol Med 1997; 27:931–942Crossref, Medline, Google Scholar
15 Funahashi S: Neuronal mechanisms of executive control by the prefrontal cortex. Neurosci Res 2001; 39:147–165Crossref, Medline, Google Scholar
16 Mega MS, Cummings JL: Frontal-subcortical circuits and neuropsychiatric disorder. J Neuropsychiatry Clin Neurosci 1994; 6:358–370Link, Google Scholar
17 Heinik J, Lahav D, Drummer D, et al: Comparison of a clock drawing test in elderly schizophrenia and alzheimer’s disease patients: a preliminary study. Int J Geriatr Psychiatry 2000; 15:638–643Crossref, Medline, Google Scholar
18 Cahn Weiner DA, Sullivan EV, Shear PK: Brain structural and cognitive correlates of clock drawing performance in Alzheimer’s disease. J Int Neuropsychol Soc 1999; 5:502–509Crossref, Medline, Google Scholar
19 Heinik J, Reider-Grosswasser II, Solomesh I, et al: Clock drawing test: correlation with linear measurements of CT studies in demented patients. Int J Geriatr Psychiatry 2000; 15:1130–1137Crossref, Medline, Google Scholar
20 Folstein M, Folstein F, McHugh PR: Mini-Mental State: a practical guide for grading the cognitive state of patients for the clinician. J Psychiatr Res 1975; 12:189–198Crossref, Medline, Google Scholar
21 Kluger A, Sovel M: The clock drawing task: a novel scoring system (in press)Google Scholar
22 Kitabayashi Y, Ueda H, Narumoto J, et al: Quantitative analyses of clock drawings in Alzheimer’s disease and vascular dementia. Psychiatry Clin Neurosci 2001; 55:484–491Google Scholar
23 Reider-Groswasser I, Ommaya AK, Salazar AM: Neuroimaging assessment in TBI and stroke: relevance for acute and post acute treatment, in Neuropsychological Rehabilitation: Fundamental, Directions and Innovations. Edited by Leon-Carrion J. Delray Beach, Fla, GR/St Lucie Press, 1997, pp 73-108Google Scholar
24 Van Swieten JC, Hijdra A, Koudstaal PJ, Van Gijn J: Grading of white matter lesions on CT and MRI: a simple scale. J Neurol Neurosurg Psychiatry 1990; 53:1080–1083Crossref, Medline, Google Scholar
25 de Groot JC, de Leeuw FE, Oudkerk M, et al: Cerebral white matter lesions and cognitive function: the Rotterdam Scan Study. Ann Neurol 2000; 47:145–151Crossref, Medline, Google Scholar
26 Lockwood KA, Alexopoulos MD, van Gorp W: Executive dysfunction in geriatric depression. Am J Psychiatry 2002; 159:1119–1126Crossref, Medline, Google Scholar
27 Charlson ME, Pompei P, Ales KL, MacKenzie RC: A new method of classifying prognostic comorbidity in longitudinal studies: development and validation. J Chronic Dis 1987; 40:373–383Crossref, Medline, Google Scholar
28 Kiosses DN, Klimstra S, Murphy C, et al: Executive dysfunction and disability in elderly patients with major depression. Am J Geriatr Psychiatry 2001; 9:269–274Crossref, Medline, Google Scholar
29 Alexopoulos GS: Frontostriatal and limbic dysfunction in late life depression. Am J Geriatr Soc 2002; 10:687–695Crossref, Google Scholar
30 Naugle RI, Kawaczak K: Limitations of the Mini-Mental State Examination. Cleveland Clinic J Med 1989; 56:277–281Crossref, Medline, Google Scholar
31 Schwamm LH, Van Dyke C, Kiernan RJ, et al: The Neurobehavioral Cognitive Status Examination: comparison with the cognitive capacity screening examination and the Mini-Mental State Examination in the microsurgical population. Ann Intern Med 1987; 107:486–491Crossref, Medline, Google Scholar