Magnetic Resonance Spectroscopy in Affective Disorders
Abstract
Magnetic resonance spectroscopy (MRS) is a noninvasive tool for in vivo chemical analysis that has been applied to neurobiological or psychopharmacological studies of affective disorders. Studies employing 31P-MRS and 1H-MRS have indicated possible abnormalities in membrane phospholipid metabolism, high-energy phosphate metabolism, and intracellular pH in affective disorders. They have also suggested that lithium increases the phosphomonoester (possibly inositol-1-phosphate) peak in the brain but does not increase that of choline-containing compounds in the brain. Studies employing 7Li-MRS and 19F-MRS have elucidated the pharmacokinetic properties of lithium, fluoxetine, and fluvoxamine in the brain in patients treated with these drugs.
The nuclear magnetic resonance (NMR) phenomenon was discovered in 1946, and since that time NMR spectroscopy has been widely used in chemistry for analysis of molecular structure. Since Chance and colleagues in 1978 first obtained in vivo phosphorus-31 NMR spectra in the mouse brain, this technique has been applied to in vivo chemical analysis in animals or in human skeletal muscles. The development of magnetic resonance imaging (MRI) has facilitated application of NMR spectroscopy in the human brain.
Whereas MRI depicts the spatial distribution of protons of water, MRS detects various molecules present at concentrations on the order of mM (millimolar). Some of these molecules detectable with MRS are involved in high-energy phosphate or membrane phospholipid metabolism. The metabolism of these molecules in the brain has not been well studied because researchers in neurochemistry have focused on molecules such as neurotransmitters and receptors, which directly relate to neuronal function. Therefore, data obtained by MRS are sometimes difficult to interpret because of a lack of basic knowledge. In this regard, MRS not only represents a tool by which to study the neurochemical basis of neuropsychiatric diseases, but it also opens up an entirely new field in neurochemistry.
MRS of several nuclei, such as 1H, 31P, 7Li, and 19F, has already been applied in psychiatric research since the late 1980s. (Please see recent reviews for details of the principles of MRS and its applications in psychiatry.1–5)
In this article, we present a review of the basic principles of MRS and recent advances in research on the neurochemical correlates of MRS spectra, followed by a review of the applications of MRS in affective disorders and a discussion of the implications for the pathophysiology of affective disorders.
BASIC PRINCIPLES OF MRS
Because MRS data are dependent on the technique used in the experiment, knowledge of MRS technique is important to interpret the results appropriately. We will briefly review here the basic principles; for detailed review of principles, see other review articles.1–5
The nuclei of many species of atoms, such as 1H or 31P, have magnetic properties. When the radio frequency pulse (RF pulse) of a particular frequency (Larmor frequency) is applied to a nuclear spin under a static magnetic field, the nuclear spin resonates and absorbs energy. When it then returns to the previous state, it emits electromagnetic waves known as free induction decay (FID). This process is referred to as relaxation. When the spin-echo method is used, the second pulse is applied after the echo time (TE), and another signal, the echo, is observed. The concentration of nuclei is related to the intensity of FID or echo observed. Generally, many FID or echoes must be averaged to obtain enough signals for application of quantitative analysis. FID or echoes are averaged with a specific interval of repetition time (TR). Usually, the TR is set comparable to the T1 relaxation time. Under this condition, the signals are partly saturated and the signal intensity is decreased, which complicates the interpretation of data.
The Larmor frequency changes not only with the type of nuclei, but also with the type of chemical bonding with other nuclei. The small difference of resonance frequency dependent on the position of the nuclei in a molecule, the chemical shift, enables us to discriminate different molecules containing the same nuclei.
To obtain MR signals from a certain region of the brain, the signal localization method is used. The simplest method of signal localization is that employing a surface coil. Other signal localization methods include depth-resolved surface coil spectroscopy (DRESS), stimulated-echo method (STEAM), image-selected in vivo spectroscopy (ISIS), and magnetic resonance spectroscopic imaging (MRSI). These pulse sequences utilize field gradient and/or phase encoding, of which the latter is the principle of MRI. Multiple voxels can be simultaneously obtained by using MRSI.
Obtaining MR spectra from FID or echoes requires many kinds of data processing. For the quantitation of the metabolite peaks observed, a number of methods have been used to calculate the peak area. Because all of these processes may lessen the reliability of measurement, these processes should be performed by a researcher who is blind to the diagnosis of the patients.6
Neurochemical Correlates of MR Spectra
31P-MRS
Because phosphorus-31 magnetic resonance spectroscopy (31P-MRS) has been used for clinical research since the beginning of clinical application of MRS, a wealth of data has been accumulated. In 31P-MR spectra of the brain, typically seven peaks are resolved; these are phosphomonoester (PME), inorganic phosphate (Pi), phosphodiester (PDE), phosphocreatine (PCr), and γ-, α- and β-adenosine triphosphate (ATP). These are illustrated in Figure 1. Because these peaks, especially PME, Pi, and PDE, overlap each other, it is not easy to quantitate them accurately.
Phosphomonoester (PME):
The phosphomonoester (PME) peak contains the signals from numerous metabolites, including metabolites related to membrane phospholipid synthesis, such as phosphocholine (PC) or phosphoethanolamine (PE),7 and sugar phosphates such as α-glycerophosphate or inositol phosphates.8
In the PME region, PE is the most abundant and PC is the second most abundant metabolite.9 If proton decoupling technique is applied, PC and PE can be shown as peaks discrete from those of other PME. In this pulse sequence, protons that interact with phosphorus are irradiated to improve spectral resolution deteriorated by spin-spin coupling.
Increase of turnover of membrane phospholipid has been speculated to cause increase of the PME peak. This phenomenon, accompanied by increased membrane phospholipid synthesis, has been observed in the neonate brain, tumor,10,11 and regenerating liver.12 However, even if the PME peak was increased in 31P-MR spectra, it cannot be presumed that the membrane phospholipid turnover is increased, because this peak originates from many metabolites, and we cannot know which metabolite in this region is increased.
Renshaw et al.13 have examined the effect of lithium administration on this peak in the cat brain. Chronic administration of lithium increased this peak. In a study employing in vitro NMR spectroscopy in brain extracts, this change was attributed to increase of inositol-1-phosphate (I-1-P). Preece et al.,14 using in vitro NMR spectroscopy, also showed that lithium-induced increase of the PME peak is due to increase of I-1-P. This increase of the PME peak was enhanced by pilocarpine, an agonist of acetylcholine receptor.15 Accumulation of I-1-P is caused by strong inhibition of inositol-1-phosphatase by lithium,16 and this effect is enhanced when phosphoinositide metabolism is activated by agonist stimulation. Silverstone et al.17 have examined the effect of lithium on the PME peak in normal volunteers. They did not find any alteration of the PME peak after lithium administration only. However, using a placebo-controlled double-blind protocol, they detected changes in PME peak area in volunteers treated with lithium for a week who were then subjected to amphetamine challenge (Silverstone et al., personal communication).
Phosphodiester (PDE):
The PDE peak has been regarded as reflecting membrane degeneration products such as glycerophosphocholine (GPC) and glycerophosphoethanolamine (GPE). Therefore, the PME/PDE ratio was formerly regarded as representative of membrane phospholipid turnover.9 Pettegrew et al.9 examined the constitution of the PME and PDE region by using in vitro NMR spectroscopy of brain extracts and found that 89% of metabolites in the PME region appeared only in anabolic pathways, whereas all metabolites in the PDE region appeared only in catabolic pathways of membrane phospholipid metabolism. They concluded that the PME/PDE ratio might be an approximate representative of membrane phospholipid turnover. However, this concept is not generally accepted now. The main reason is that most of the signals in the in vivo PDE peak were found to arise from membrane phospholipid itself.12,18 Soluble PDEs such as GPE and GPC would contribute only 5% of the in vivo PDE peak.12 Because the behavior of signals from the phospholipid bilayer is complex,18 a change of the peak area of the PDE peak observed by in vivo 31P-MRS is difficult to interpret. If T2-weighted MR spectra are obtained by using spin-echo pulse sequence, the signals from the membrane phospholipid bilayer that have short T2 can be virtually eliminated.18 On the other hand, concentration of the membrane phospholipids can be examined under certain experimental conditions.19
The PDE peak is higher in white matter than in gray matter.20 In our preliminary study of 31P-MRS in eating disorders,21 the PDE peak in patients with anorexia nervosa was significantly higher than that in age- and sex-matched normal control subjects. Therefore, severe malnutrition may affect this peak. Because decreased weight and appetite loss are common in depressed patients, this should be taken into consideration in interpreting the 31P-MRS data in mental disorders, especially in affective disorders. It has been reported that the PDE peak in the human occipital lobe decreased during photic stimulation,22 and it was speculated that this decrease is caused by hydrolysis of GPC and GPE by activation of phospholipase D. However, this finding was not confirmed in our study.23
Inorganic Phosphate (Pi):
The Pi peak appears between the PME and PDE peaks. Because of this overlap, it is difficult to quantitatively analyze this peak accurately. Pi appears in many metabolic pathways. Although the Pi peak contains both PO4– and PO42–, they are shown as one peak because of the fast exchange between these two molecules. Because the position of this peak reflects the equilibrium of these two ions, pH can be calculated from the chemical shift of the Pi peak.24 Because these phosphate ions exist intracellularly, this pH reflects intracellular pH (pHi). However, there may be intracellular compartmentation with regard to pHi, since two different pHi can be observed in brain ischemia. In chronic infarction, pHi was found to be increased, which may result from high pHi in macrophages filtrated into infarct tissues.10,11 Intracellular pH increases during hyperventilation.25 Photic stimulation also increases pHi in the occipital cortex.23,26 This increase might be caused by activation of Na+/H+ antiporter, a principal determinant of brain pHi, by photic stimulation.27 An interesting correlation between pHi and IQ was reported.28
Phosphocreatine (PCr):
PCr is a high-energy phosphate, abundant in the brain and muscles, in which high activity of energy metabolism is required. This peak is the most prominent peak in the 31P-MR spectra in the brain. However, because muscles have much higher concentration of PCr, it is difficult to completely avoid contamination from muscles, even when a signal localization method is used. PCr is formed from ATP and creatine by a catalyzing agent of creatine kinase. PCr conveys high-energy phosphates from mitochondria to the cytosol. When ATP is consumed, PCr transfers its high-energy phosphate group to ADP (adenosine diphosphate), replenishing ATP. In this regard, PCr behaves as a buffer of ATP.29
The PCr peak decreases in the occipital cortex during photic stimulation.23,26 This decrease is thought to be caused by increased energy demand in this region. Although glucose uptake is also increased in the occipital cortex during photic stimulation, the accompanying increase of oxygen consumption is not enough to compensate for the increase of glucose metabolism, which results in stimulation of anaerobic glycolysis.30 Because glycolysis is not as efficient as aerobic metabolism, this energy gap is compensated with decrease of PCr concentration. Metabolic flux of PCr through the creatine kinase reaction can be measured in vivo in human brain by using saturation transfer MRS.31 The PCr level in the frontal lobes increases with age in healthy subjects.32–34
Adenosine Triphosphate (ATP):
Adenosine triphosphate (ATP) forms three distinct peaks, γ, α, and β, of which the doublet of the γ-ATP peak is resolved in 31P-MR spectra in vivo. ATP is a high-energy phosphate that can serve as a substrate of many kinds of biochemical processes in the brain. The ATP concentration is maintained constant during physiological stimulation. Because a magnesium ion binds to the α and β phosphates of ATP, the magnesium concentration affects the chemical shifts of these two peaks. The intracellular magnesium concentration ([Mg]i) can be calculated from the chemical shift difference between α and β-ATP.35 However, this method has recently come to be regarded as an oversimplification, and a new titration curve was proposed.36 Especially when the pHi is not in a normal range, the equation by Gupta et al.35 is not valid. Moreover, the chemical shift of each of these peaks is difficult to determine in in vivo 31P-MR spectra because the β-ATP peak is relatively broad owing to a short T2.
Lithium is known to compete with magnesium ion in binding to ATP, and it also affects the chemical shifts of the three peaks of ATP.37
1H-MRS
Because hydrogen is a ubiquitous atom and the chemical shift range of the proton is relatively small, 1H-MR spectra in the brain are crowded with signals from many metabolites. Because water is present in the brain at very high concentration, this signal should be suppressed to obtain signals from other molecules present in smaller concentrations. Of these, three prominent signals, those from N-acetyl-l-aspartate, creatine/phosphocreatine, and choline-containing compounds, have been well studied. These three peaks are well resolved in long-TE 1H-MRS (TE=135–270 ms); many other metabolites can be observed in short-TE 1H-MRS (TE≤20). The peaks are illustrated in Figure 2.
N-acetyl-l-aspartate (NAA):
Because NAA has not drawn attention since 1H-MRS has come to be used in clinical medicine, its neurochemical properties are relatively unknown. It is metabolically very inactive and localized mainly in neurons rather than glial cells.38,39 At first, decrease of the NAA peak was regarded as reflecting neuronal death.38 Decrease of this peak in the brain in neurodegenerative disorders is a consistent finding. More recently, however, decrease of NAA was reported to be transient in brain ischemia and multiple sclerosis. Therefore, NAA is now regarded as reflecting not only the death but also the dysfunction of neurons.10,11
Creatine (Cr):
The Cr peak contains both creatine and phosphocreatine. Creatine is a substrate of creatine kinase. Because the sum of creatine and PCr was thought to be maintained constant, this was previously used as an internal standard. Recently, water or an external standard has been used as the standard. The Cr concentration is higher in the gray matter than in the white matter.40
Choline-Containing Compounds (Cho):
The peak of choline-containing compounds includes many metabolites that have trimethylamine residues. In the brain, PC, GPC, phosphatidylcholine, sphingomyelin, choline, and acetylcholine are assumed to contribute to this peak.38 Acetylcholine and choline are assumed to make minor contributions because of their relatively small concentrations in the brain.
In neurodegenerative disorders, this peak sometimes increases accompanied by decrease of the NAA peak. The Cho peak also increases in active plaques in multiple sclerosis, and the increase is thought to be related to demyelination.10,11
It has been reported that this peak was increased after ingestion of 50 mg/kg choline but that this uptake decreased with age.41
Inositol:
This peak contains myo-inositol. Myo-inositol has two important functions, as an osmolite and as a substrate for phosphoinositide cycle. The inositol peak was reported to decrease in hyponatremia in humans.42
As stated before, lithium strongly inhibits inositol-1-phosphatase, which is the last process in the phosphoinositide cycle.16 When agonist stimulation increases the hydrolysis of inositol phospholipids in the presence of lithium, I-1-P accumulates in the brain. This results in shortage of myo-inositol in neuronal cells, which may explain the mechanism of action of lithium.43 Preece et al.14 have reported that this decrease of myo-inositol was detectable by in vitro NMR spectroscopy in brain extracts, but not by in vivo 1H-MRS. Because the protons of myo-inositol and I-1-P in the 1H-NMR spectra have similar chemical shifts,44 these signals cannot be discriminated from each other in vivo. Therefore, decrease of the myo-inositol signal may be obscured by increase of the I-1-P signal. As expected, decrease of inositol could not be detected in patients with bipolar disorder treated with lithium45 or normal volunteers who were taking lithium for 1 week.17
Lactate:
In the normal brain, a distinct peak of lactate is not detectable. This peak becomes visible, however, in many types of brain dysfunction such as ischemia, infarction, brain tumor, Huntington's disease, and mitochondrial encephalopathy.10,11 Because this peak is near the lipid peak, it must be confirmed that the observed peak originates from lactate. Use of spectral editing techniques can confirm lactate signal.46
The lactate peak is known to increase during hyperventilation.25,47 It is also reported to increase in the occipital cortex during photic stimulation.26,48,49 Dager et al.50 have reported that lactate infusion increased the lactate peak in the brain in humans. The lactate signal increases during panic attacks in patients with panic disorder.47
Lipids:
Because the fat surrounding the brain contains high concentration of lipids, lipid signals in the in vivo 1H-MR spectra can be easily contaminated by signals originating from outside the brain. Therefore, it should be noted that even slight motion of the subject can result in contamination of the lipid signals in the 1H-MR spectra.
Others:
Many other substances can be detected by 1H-MRS when their concentrations are increased due to certain pathological conditions or their exogenous administration. These include glutamine/glutamate in hepatic encephalopathy, glucose in diabetes mellitus, ethanol after ingestion of alcohol, phenylalanine in phenylketonuria, and ketone bodies in diabetic coma.10,11 Recently, γ-aminobutyric acid (GABA) was detected and measured by use of spectral editing techniques in epileptic patients treated with vigabatrin.51 Relatively broad signals from proteins also appear in 1H-MR spectra in the brain.
7Li-MRS, 19F-MRS:
Both lithium and fluorine exist in negligible concentrations in the brain. Therefore, no signal of these nuclei can be detected in the normal human brain. Lithium-7 has high natural abundance (92%). Fluorine has only one isotope, fluorine-19. Both of these nuclei have high NMR sensitivity comparable with the proton. For these reasons, these techniques can be used for pharmacokinetic studies of lithium- and fluorine-containing drugs in the brain in patients treated with these drugs.
APPLICATIONS TO AFFECTIVE DISORDERS
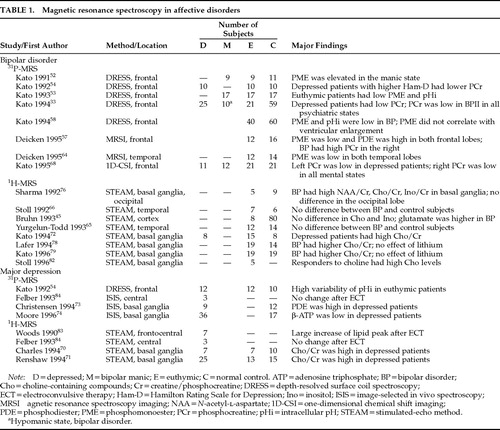
Investigations in which MRS was used to study affective disorders are listed in Table 1.
Membrane Phospholipid Metabolism
Phosphomonoester (PME):
We observed that the PME peak was increased in the frontal region in 9 manic patients treated with lithium compared with those in the euthymic state and normal control subjects.52 In the second study of 17 patients with bipolar disorder, including 9 patients previously reported, the difference of the PME peak between the manic state and the euthymic state was confirmed, but no difference of the PME peak was observed between 17 medicated manic patients and 17 control subjects. It was also found that the PME peak in the remission state was lower than that in age-matched normal control subjects.53 This decrease of the PME peak in the euthymic state was not observed in patients with unipolar depression54 or bipolar II disorder.33 Patients with bipolar disorder in the depressive state also had higher PME levels compared with those in the euthymic state.54 Renshaw et al.13 have reported that in the cat brain lithium increased the PME peak, with the maximum PME value observed 1 week after the initiation of lithium treatment. The PME peak then decreased to the normal range. Our first report52 included 4 manic patients examined 4–8 days after the initiation of lithium treatment. The PME/PDE peak ratio in these 4 manic patients was 0.89±0.33 (mean±SD), which was substantially higher than that in 5 other manic patients treated for 12 days or more (0.66±0.14), euthymic patients who were treated for 26 days or more (0.49±0.12), and normal control subjects (0.57±0.12). In that report, the time course of the PME peak in a patient after the initiation of lithium treatment is also presented; the highest PME value was found 7 days after the initiation of lithium treatment. Therefore, the data for the few patients examined soon after the initiation of lithium treatment might have increased the average PME level in manic patients in the first report compared with the second report, which included more patients treated for a longer period.
It should be noted that Silverstone et al.17 could not detect any increase of the PME peak after 1 week treatment of lithium in normal volunteers. On the other hand, they found increase of the PME peak during amphetamine challenge after 7 days' treatment of lithium (Silverstone et al., personal communication). Therefore, increased PME peak in the manic patients may suggest that catecholaminergic system was activated in the manic state.
On the other hand, manic patients treated with antipsychotics alone also had higher PME values than those for euthymic patients treated with lithium.53 In schizophrenic patients, no effect of antipsychotics on the PME peak was found.55,56 Therefore, it is unlikely that antipsychotics increase the PME level. The two possibilities are that chronic lithium treatment reduced the PME peak or that PME changes state-dependently in bipolar disorder. The first possibility is not supported by the results presented by Deicken et al.,57 who found lower PME levels both in the left and right frontal lobes in drug-free patients with bipolar disorder in the euthymic state compared with normal control subjects. However, these patients were drug-free for just 1 week, and this may not be enough time to discount effect of medications. PME did not correlate with brain lithium concentration53 or duration of lithium treatment,58 which also suggests that long-term lithium treatment does not decrease the PME peak. Therefore, we speculate that both lithium-induced transient accumulation of I-1-P and state-dependent alteration of other PME species contribute to the elevated PME peak in the manic state compared with that in the euthymic state.
Decrease of the PME peak in the frontal lobes was also reported in schizophrenia,55,56,59–61 and it may relate to hypofrontality because it was correlated with negative symptoms.55 Not only decrease of the PME peak but also many other neuroimaging findings noted in schizophrenia have been found in bipolar I disorder.62
The cause of the decreased PME peak in the euthymic state or of the state-dependent alteration of this peak in patients with bipolar disorder is not yet known. Decreased PME peak is not correlated with ventricular enlargement in bipolar disorder.58 Although decreased PME peak is correlated with age in bipolar disorder,58 this also may be observed in normal aging.63 The diminished PME peak cannot be interpreted as a result of disease because there is no correlation between the PME peak and the duration of illness.
Deicken et al.64 also reported that decrease of the PME peak in bipolar patients in the euthymic state was also observed in the temporal lobes. In schizophrenia, PME was normal in the temporal lobes.5 No marked abnormality was detected by using 1H-MRS in the temporal65 and parietal lobes66 in patients with bipolar disorder in the euthymic state. NAA was normal in the frontal lobes in euthymic bipolar patients (Hamakawa et al., unpublished findings). On the other hand, NAA has been reported to be decreased in the temporal lobes5,65 and possibly in the frontal lobes in schizophrenia.
The decreased PME peak in patients with bipolar disorder in the euthymic state might relate to trait-dependent abnormal membrane phospholipid metabolism, since trait-dependent abnormality of membrane molecular dynamics in red blood cells was reported in bipolar disorder.67
Phosphodiester (PDE):
Deicken et al.,57 using MRSI, observed that the PDE peak was increased in both left and right frontal lobes in patients with bipolar disorder in the euthymic state. This alteration of PDE peak was not observed in the temporal lobes.64 On the other hand, we have failed to observe any difference of the PDE peak between bipolar patients and normal control subjects52–54,58 by the DRESS method, in which slice selection is applied only to one direction. Although the values of PDE were not reported in our study using the one-dimensional chemical shift imaging (1D-CSI) method,68 in that study we found no significant difference of the PDE peak between patients with bipolar disorder in the euthymic state and normal control subjects (bipolar disorder [n=17]: L: 34.5±3.0, R: 33.7±5.8; normal control subjects [n=21]: L: 35.2±4.4, R: 32.5±4.8). In our studies of schizophrenia, increase of the PDE peak in the frontal lobes, which is a relatively consistent finding across studies,59–61 was not observed.55 This difference may be due to our method of spectral processing. Because we have been using the convolution difference method69 to eliminate broad signals, a broad component of the PDE peak relating to the membrane phospholipid bilayer is substantially suppressed.
Choline-Containing Compounds (Cho):
Charles et al.70 first reported that the Cho peak observed by 1H-MRS was increased in the subcortical region including the basal ganglia in elderly patients with major depression who were not treated with any psychotropic drugs. The Cho peak returned to the normal range after antidepressant treatment was begun. Whether this was due to an effect of the drug or an effect of remission could not be distinguished. This finding was confirmed by Renshaw et al.71 in younger depressive patients. We have also examined medicated patients with bipolar and unipolar depression by 1H-MRS in the same region. The Cho peak in this region was higher in patients with bipolar depression compared with normal control subjects.72 Only a nonsignificant trend toward increased Cho peak was found in the unipolar depressive patients in our study, although this lack of confirmation may have been due to the effects of medication. These findings suggest that the Cho peak in the basal ganglia increases state-dependently in relation to depressive symptoms, and that this finding is not a result of partial volume effect caused by atrophy of the basal ganglia.62
It is difficult to know which metabolite in the Cho peak contributes to the observed change of this peak. However, it should reflect alteration of membrane phospholipid metabolism in this region rather than acetylcholine metabolism, because the latter contributes to this peak very modestly.38 Therefore, these findings may relate to abnormality in membrane metabolism postulated in affective disorders.67 Christensen et al.,73 after examining the basal ganglia region in medicated patients with major depression by using 31P-MRS, reported that the PDE peak was significantly increased in these patients compared with that in normal control subjects. They speculated that these alterations may be attributed to increase of GPC, a substance that contributes to both the Cho and PDE peaks. However, the increase of the PDE peak in the basal ganglia in major depression was not confirmed in their subsequent study of drug-free patients.74
The choline concentration in human erythrocytes is known to increase markedly after lithium treatment is begun. This increase is caused by strong inhibition of choline transport by lithium, which results in poor elimination of the choline formed by breakdown of phosphatidylcholine intracellularly.75 Because this effect of lithium is not seen in other animal species, it has been difficult to examine the effect of lithium on choline transport in the brain. Stoll et al.66 examined whether or not lithium increases the Cho peak in the human parietal cortex by 1H-MRS and found no significant difference of the Cho peak between bipolar patients treated with lithium and normal control subjects. Because free choline makes only a minor contribution to the Cho peak observable by 1H-MRS, as noted above, this result does not completely rule out the possible effect of lithium on free choline in the brain. However, it is unlikely that lithium has a marked effect on Cho transport in the human cerebral cortex like that in erythrocytes, because lithium is also known to increase the levels of other choline-containing compounds in erythrocytes. Other investigators45,76 have also failed to find any difference of the Cho peak in cerebral cortex between bipolar patients treated with lithium and normal control subjects.
However, we could hypothesize that the Cho peak is low in drug-free bipolar patients and that lithium increases that peak. Moreover, it should be noted that the distribution of lithium in the brain is not uniform. The lithium concentration is higher in the basal ganglia region compared with the cerebral cortex.77 Sharma et al.76 reported that the Cho/Cr peak ratio in the basal ganglia, but not in the cerebral cortex, was elevated in 4 patients with bipolar disorder treated with lithium, suggesting to us that the effect of lithium on the Cho peak may be limited to the basal ganglia region. Lafer et al.78 and the authors72,79 have reported that the Cho peak in the basal ganglia was increased in patients with bipolar disorder in the euthymic state. This increase may not be caused by lithium; the Cho peak was higher in bipolar patients treated without lithium than in patients treated with lithium,79 although effects of other medications cannot be ruled out. Therefore, this increase of the Cho peak in the basal ganglia may relate to the pathophysiology of bipolar disorder rather than to the effect of lithium. Increase of the Cho peak in the left basal ganglia was also observed in patients with schizophrenia.80,81
Recently, Stoll et al.82 have examined 1H-MRS during choline augmentation of lithium for rapid-cycling bipolar disorder. The four patients who had responded to choline all showed a substantial rise in the basal ganglia Cho peak, but two nonresponders did not. This interesting observation needs further replication in a larger patient population.
Lipids:
It has been reported by Woods and Chiu83 that lipid signals were increased and that no signal from lactate was detected after electroconvulsive therapy (ECT) in patients with major depression. They have speculated that the increase of the lipid signal is due to increased levels of diacylglycerol and free fatty acids generated by hydrolysis of phosphatidylinositol. However, this finding was not confirmed by other investigators.84 Relevant studies in animals also do not support this finding.85 Felber et al.,84 using 31P-MRS and 1H-MRS, did not find any metabolic change in the brain in patients with major depression after ECT. However, these findings of effects of ECT on brain metabolism have major limitations of very small sample size (N=5 and N=3, respectively), and still need replication.
Energy Metabolism
Phosphocreatine (PCr):
We found that depressive patients (either unipolar or bipolar) with higher scores on the Hamilton Rating Scale for Depression (Ham-D) had lower PCr levels in the frontal lobes than those with lower Ham-D scores.54 In our subsequent study, patients with bipolar depression (either bipolar I or bipolar II) showed significantly lower PCr levels (12.4±1.9, n=25) compared with age-matched normal control subjects (13.5±1.5, n=59, t=2.6, P<0.05).33 The PCr peak in the whole frontal lobe seemed to be decreased consistently in all three psychiatric states (depressive, euthymic, and hypomanic) in patients with bipolar II disorder.33
Because left–right asymmetry (left lower than right) of glucose metabolism has been noted in depression, these results may be affected by the heterogeneity of PCr distribution in the frontal lobes. To clarify these findings further, we examined both the left and right frontal lobes by using the 1D-CSI method.68 Depressive patients with bipolar disorder had lower PCr levels in the left frontal lobe compared with normal control subjects. This reduction of PCr in the left frontal lobe in bipolar depression was correlated with higher scores on the Ham-D (r=–0.74, P<0.05). Therefore, this reduction of PCr in the left frontal lobe may relate to depressive symptoms. On the other hand, PCr was lower in the right frontal lobe in bipolar patients in all three psychiatric states compared with normal control subjects.68 These findings of asymmetric brain energy metabolism in bipolar disorder are compatible with findings in other imaging techniques, such as low glucose metabolism in the left frontal lobe measured by positron emission tomography and right-hemisphere dysfunction suggested by event-related potential findings. These findings are also relevant to studies of poststroke affective disorder, in which left frontal lobe infarction is associated with depression and right frontal lobe damage is associated with mania.62 On the other hand, Deicken et al.57 found significant side-by-group interaction in the PCr peaks in the left and right frontal lobes in patients with bipolar disorder in the euthymic state and normal control subjects. This was caused by higher PCr peak in the right frontal lobe in the bipolar patients. These two sets of results acquired in patients with bipolar disorder in the euthymic state are contradictory to each other. Although the reason is not known, this discrepancy may be due to the different drug status and/or methodology. Most of the patients in our study were medicated, whereas lithium was washed out for 1 week in the patients studied by Deicken et al.57 Because reduction of PCr in the right frontal lobe was also found in medicated patients with panic disorder,86 it cannot be ruled out that this reduction may be due to an effect of medication. There are also many methodological differences between these two studies in terms of coils, pulse sequences, repetition time, and data processing.
As is the case with bipolar disorder, the findings for PCr in the frontal lobes in schizophrenia are also still controversial. Studies using a surface coil tend to show increased PCr peak in the left frontal lobe,56,60 whereas studies using MRSI tend to show decreased PCr peaks in both frontal lobes.87,88
We had initially speculated that decrease of the PCr peak might be due to decrease of total creatine in the brain, since the creatine concentration in cerebrospinal fluid is reported to be decreased in patients with bipolar depression compared with those with major depression.89 The Cr peak in the left frontal lobe detected by quantitative 1H-MRS was state-dependently decreased in patients with bipolar disorder in the depressive state (Hamakawa et al., unpublished findings). Therefore, still it cannot be ruled out that total creatine in the brain is decreased in bipolar depression.
After we postulated that the decrease of the PCr peak in the left frontal lobe was due to mitochondrial dysfunction,33 evidence suggesting abnormality of mitochondrial DNA in bipolar disorder was brought to light.90,91 Bipolar disorder may be transmitted by mitochondrial inheritance,90 patients with mitochondrial encephalopathy sometimes have affective disorder, and some patients with bipolar disorder have 4,977 base pair deletion in their mitochondrial DNA in leukocytes in the brain.91 Recently, we applied a photic stimulation experiment in patients with bipolar disorder and found that the recovery of PCr in the occipital cortex after the stimulation was significantly slower in the patients (Murashita et al., unpublished finding). This finding seems compatible with the mitochondrial dysfunction hypothesis because slow recovery of PCr after stimulation is a characteristic of mitochondrial dysfunction, which has been revealed by 31P-MRS studies in human skeletal muscles. If the decreased PCr peak in the left frontal lobe in bipolar depression is due to mitochondrial dysfunction, signals from lactate may be detected. However, no marked signal from lactate was detected in the frontal lobes in patients with bipolar disorder in the euthymic and depressive states (Hamakawa et al., unpublished findings).
Adenosine Triphosphate (ATP):
Recently, it was reported that the concentration of ATP was decreased in the basal ganglia in drug-free patients with major depression.74 Although the decrease of ATP without accompanying decrease of PCr concentration is somewhat difficult to interpret, this finding may also suggest the involvement of abnormal energy metabolism in the pathophysiology of affective disorders. This finding, together with increase of the Cho peak in the basal ganglia, is compatible with emerging evidence for basal ganglia abnormalities in affective disorders in functional and structural neuroimaging studies.62 Similar decrease of the ATP peak in the basal ganglia has been reported in schizophrenia.92
Intracellular pH (pHi):
We found that pHi decreased in patients with bipolar disorder in the euthymic state who were treated with lithium compared with pHi in normal control subjects.53 The pHi was higher in the manic and depressive states compared with pHi in the euthymic state.53,54 Although such findings were not observed by Deicken et al.,57 the standard deviation of pHi was higher in their study (0.06–0.28) than in our study (0.04–0.06), which may have affected the results. Although decreased pHi can be seen in several pathological states, including acute infarction and subarachnoid hemorrhage, the bipolar patients studied did not have such major neurological abnormalities. There are two possible explanations for this: either accumulation of lactate or abnormality in Na+/H+ antiport activity in bipolar disorder. Abnormality of many kinds of ion transport systems in blood cells has been reported in bipolar disorder,93 and it is possible that this antiport activity is decreased in bipolar disorder. Although lithium is known to affect the Na+/H+ antiport activity94 that regulates pHi in neurons,27 we observed reduction of pHi in 7 patients with bipolar disorder who were drug-free more than 10 days (Kato et al., unpublished finding). In 40 patients with bipolar disorder in the euthymic state treated with lithium, pHi was positively correlated, weakly but significantly (r=0.33, P<0.05), with the duration of lithium treatment.58 Long-term treatment with lithium may augment pathologically decreased pHi in bipolar patients.
Why is pHi abnormal in the euthymic state, but normalized in the manic and depressive states? Na+/H+ antiport is activated by monoaminergic stimulation and augmented by phosphorylation by protein kinase C (PKC).95 It is reported that PKC activity in platelets is increased in patients with bipolar disorder.96 According to this evidence, we can hypothesize that alteration of monoaminergic pathway through either increased activity of monoamines or hypersensitivity to them via changes of second messenger systems in bipolar disorder might be a result of compensatory mechanisms of these systems to restore decreased pHi. This hypothesis, although very speculative, can account for why pHi is abnormal in the euthymic state and normalized in the manic and depressive states.
Pharmacokinetic Studies With 7Li-MRS
Review papers have summarized pharmacokinetic studies using lithium-7 MRS.97,98 Please see these reviews for details. The findings are briefly summarized below.
1. Lithium accumulates in the brain more slowly than in serum, with the peak time at 3–8 hours after the administration. It is also eliminated from the brain more slowly than from serum, with an elimination half-life after steady state of 48 hours.99–102 However, the elimination half-life may be much longer if the signals from muscles are eliminated.103 Lithium slowly accumulates in the brain during chronic treatment. It takes more than 7 days to reach a steady state.99 This slow rate may partly account for the delay of the clinical effect of lithium in the treatment of mania.
2. The lithium concentration in the brain is correlated with the serum concentration, with a brain:serum ratio of 0.4–0.6, which is relatively constant across studies.99,100,102,104–107 However, there is still considerable interindividual difference of brain:serum lithium ratios, up to 2.5-fold, even when the most sophisticated method for the absolute concentration determination is used.108 This variability indicates that lithium concentration in the brain may not be within the therapeutic range even if a patient has relatively high lithium concentration in serum.
3. The T1 relaxation time of 7Li in the human brain is 3–4 seconds.101,103,107,109
4. 7Li-MRI can be performed in the human brain.101
5. The brain:serum lithium ratio may vary with clinical status. In a patient whose brain lithium concentration was serially measured, the lithium concentration in the brain increased markedly during manic switch.106 The brain lithium concentration was not correlated with the serum lithium concentration in the manic state (r=0.12), but it was well correlated with the serum concentration in the euthymic (r=0.57, P<0.01) or depressive (r=0.64, P>0.05) states.97 Patients in the euthymic state tended to have a higher brain:serum lithium ratio than did depressive or manic patients.108
6. The lithium concentration in the brain was more highly correlated with the concentration in serum (r=0.66, P<0.001) than with the concentration in erythrocytes (r=0.44, P<0.05).110
7. Clinical improvement of mania, determined by the reduction in the Petterson Mania Rating Scale score 4 weeks after the initiation of lithium treatment, was significantly correlated with the lithium concentration in the brain (r=0.65, P<0.05) and the brain:serum lithium ratio (r=0.60, P<0.05), but not with the concentration in serum (r=0.33) or the lithium dose:body weight ratio (r=0.02).111
8. There was no relationship between general side effects and brain lithium concentration (r=0.01).112 The brain lithium concentration when hand tremor was present was significantly higher than that when it was absent in bipolar patients treated with lithium and other psychotropic drugs; there was no difference between the serum lithium concentrations in these two groups.112 It was also suggested by Sachs et al.,108 from clinical experience, that patients with tremor, sedation, and cognitive impairment are likely to have brain lithium levels higher than expected levels.
Pharmacokinetic Studies With 19F-MRS
Of several psychotropic drugs that have been measured in the human brain,4,113 fluoxetine and fluvoxamine, both serotonin selective reuptake inhibitors (SSRIs), are of particular interest in the treatment of affective disorders.
Renshaw et al.114 have reported that the concentration of fluoxetine (FLX)+norfluoxetine (NFLX) in the brain in patients who were treated with FLX (60–100 mg/day) for more than 3 months ranged from 1.3 to 4.2 μg/ml. The concentration in the brain was more highly correlated with daily dose than with plasma concentration. The brain:plasma ratio was 2—5 (mean 2.6).
Karson et al.115,116 have reported that the concentration of FLX+NFLX in the brain in patients who were treated with FLX (20–40 mg/day) for more than 1 week ranged from 0 to 10.7 μg/ml. The concentration in the brain was correlated with cumulative dose as well as with daily dose. In patients treated more than 3 months, it was well correlated with serum concentration (r=0.81), and the brain:serum ratio was 20.1±14.1. The 19F-MRS signal of FLX was found even 3.5 weeks after the termination of FLX treatment.
The discrepancy of brain/plasma (or serum) ratios between these two studies seems to be due to the difference of methodology in determination of the drug concentration in blood.
Miner et al.117 reported that the concentration of FLX+NFLX in the brain in patients with social phobia who were treated with FLX (10–60 mg/day, 8–20 weeks) was 0–16.5 μM (micromolar).
Strauss et al.118 have detected signals from fluvoxamine (FVX) in the brain in patients with obsessive-compulsive disorder treated with FVX at 100–300 mg/day. The FVX levels in the brain reached the steady state several weeks after the initiation of the treatment. There was no correlation between brain levels and clinical outcome, and there was substantial intersubject variability in the relationship of the dose to brain levels.
CONCLUSION
Neurobiological studies of affective disorders using MRS have suggested several possible abnormalities, including decreased PME and increased PDE levels in the frontal lobes and decreased PME level in the temporal lobes in patients with bipolar disorder in the euthymic state. Increased peak for Cho-containing compounds in the basal ganglia is suggested in bipolar disorder and major depression. In bipolar disorder, decrease of PCr may be a trait-dependent phenomenon and augmented in the depressive state. Decreased pHi is recognized in the frontal lobes in bipolar disorder in the euthymic state. Of these, the decreased PME as well as increased PDE and Cho peaks have been confirmed by a few investigators. However, they are not specific to bipolar disorder but are also observed in schizophrenia. On the other hand, the decreased PCr peak and decreased pHi have not yet been confirmed by other investigators, but they might be specific findings in bipolar disorder.
Studies of the effect of lithium on brain metabolism have suggested that lithium increases the PME (possibly I-1-P) peak during the course of treatment of mania, but it does not increase the Cho peak in either the cerebral cortex or the basal ganglia. The latter finding has been replicated by a few research groups.
Studies using 7Li-MRS and 19F-MRS in the treatment of affective disorders have elucidated pharmacokinetics of lithium and fluoxetine, and clinically useful information has been obtained.
These neurobiological studies of affective disorders using MRS are still at the basic research level. The studies in this field have had considerable methodological limitations. However, some of the limitations in the past studies might be overcome by using advanced MRS techniques. For example, particular metabolite in the PME peak might be quantitated by using a proton-decoupling technique. Further studies—in vivo MRS investigations and other kinds of studies—are needed to replicate these findings obtained from MRS in order to clarify the neurobiology of affective disorders. These findings, if replicated, may introduce brand-new treatment strategies, such as drugs that would improve mitochondrial function or improve abnormalities in membrane transport systems.
ACKNOWLEDGMENTS
This work was supported by a Stanley Foundation Research Award, a research grant for nervous and mental disorders from the Japanese Ministry of Health and Welfare, and a grant-in-aid for scientific research from the Japanese Ministry of Education.
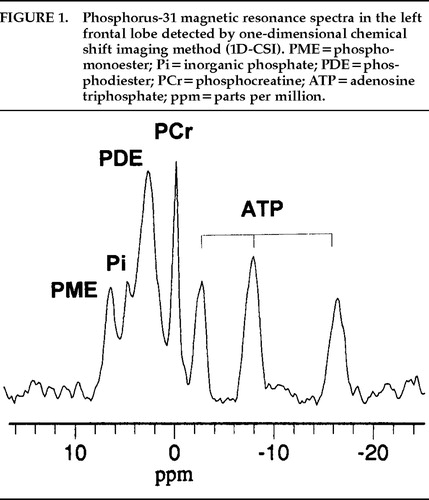
FIGURE 1. Phosphorus-31 magnetic resonance spectra in the left frontal lobe detected by one-dimensional chemical shift imaging method (1D-CSI). PME = phosphomonoester; Pi=inorganic phosphate; PDE=phosphodiester; PCr=phosphocreatine; ATP=adenosine triphosphate ppm = parts per million.
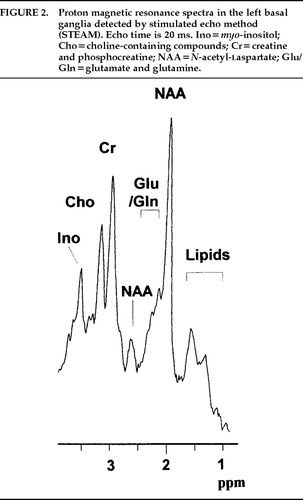
FIGURE 2. Proton magnetic resonance spectra in the left basal ganglia detected by stimulated echo method (STEAM). Echo time is 20 ms. Ino=myo-inositol; Cho=choline-containing compounds; Cr=creatine and phosphocreatine; NAA=N-acetyl-laspartate; Glu/Gln=glutamate and glutamine.
 |
1. Dager SR, Steen RG: Applications of magnetic resonance spectroscopy to the investigation of neuropsychiatric disorders. Neuropsychopharmacology 1992; 6:249–266Medline, Google Scholar
2. Keshavan MS, Kapur S, Pettegrew JW: Magnetic resonance spectroscopy in psychiatry: potential, pitfalls and promise. Am J Psychiatry 1991; 148:976–985Crossref, Medline, Google Scholar
3. Maier M: In vivo magnetic resonance spectroscopy: applications in psychiatry. Br J Psychiatry 1995; 167:299–306Crossref, Medline, Google Scholar
4. Passe TJ, Charles HC, Rajagopalan P, et al: Nuclear magnetic resonance spectroscopy: a review of neuropsychiatric applications. Prog Neuropsychopharmacol Biol Psychiatry 1995; 19:541–563Crossref, Medline, Google Scholar
5. Nasrallah HA, Pettegrew JW (eds): NMR Spectroscopy in Psychiatric Brain Disorders. Washington, DC, American Psychiatric Press, 1995Google Scholar
6. Bottomley PA: The trouble with spectroscopy papers. Radiology 1991; 181:344–150Crossref, Medline, Google Scholar
7. Gyulai L, Bolinger L, Leigh JS, et al: Phosphoethanolamine: the major constituent of the phosphomonoester peak observed by 31P NMR on developing dog brain. FEBS Lett 1984; 178:137–142Crossref, Medline, Google Scholar
8. Glonek T, Kopp SJ, Kot E, et al: 31P NMR resonance analysis of brain: perchloric acid extract spectrum. J Neurochem 1982; 39:1210–1219Crossref, Medline, Google Scholar
9. Pettegrew JW, Kopp SJ, Minshaw NJ, et al: 31P nuclear magnetic resonance studies of phosphoglyceride metabolism in developing and degenerating brain: preliminary observation. J Neuropathol Exp Neurol 1987; 46:419–430Crossref, Medline, Google Scholar
10. Ross B, Michaelis T: Clinical applications of magnetic resonance spectroscopy. Magnetic Resonance Quarterly 1994; 10:191–247Medline, Google Scholar
11. Vion-Dury J, Meyerhoff DJ, Cozzone PJ, et al: What might be the impact on neurobiology of the analysis of brain metabolism by in vivo magnetic resonance spectroscopy? J Neurol 1994; 241:354–371Google Scholar
12. Morikawa S, Inubushi T, Kitoh K, et al: Chemical assessment of phospholipid and phosphoenergetic metabolites in regenerating rat liver measured by in vivo and in vitro 31P-NMR. Biochim Biophys Acta 1992; 1117:251–257Crossref, Medline, Google Scholar
13. Renshaw PF, Summers JJ, Renshaw CE, et al: Changes in the P-31 NMR spectra of cats receiving lithium chloride systemically. Biol Psychiatry 1986; 21:694–698Crossref, Medline, Google Scholar
14. Preece NE, Gadian DG, Houseman J, et al: Lithium-induced modulation of cerebral inositol phosphate metabolism in the rat: a multinuclear magnetic resonance study in vivo. Lithium 1992; 3:287–297Google Scholar
15. Renshaw PF, Schnall MD, Leigh JS Jr: In vivo P-31 NMR spectroscopy of agonist-stimulated phosphatidylinositol metabolism in cat brain. Magn Reson Med 1987; 4:221–226Crossref, Medline, Google Scholar
16. Hallcher LM, Sherman WR: The effect of lithium ion and other agents on the activity of myo-inositol-1-phosphatase from bovine brain. J Biol Chem 1980; 255:10896–10901Medline, Google Scholar
17. Silverstone PH, Hanstock CC, Fabian J, et al: Chronic lithium does not alter human myo-inositol or phosphomonoester concentrations as measured by 1H and 31P MRS. Biol Psychiatry 1996; 40:235–246Crossref, Medline, Google Scholar
18. Kilby PM, Bolas NM, Radda GK: 31P-NMR study of brain phospholipid structures in vivo. Biochim Biophys Acta 1991; 1085:257–264Crossref, Medline, Google Scholar
19. McNamara R, Arias-Mendoza F, Brown TR: Investigation of broad resonances in 31P NMR spectra of the human brain in vivo. NMR Biomed 1994; 7:237–242Crossref, Medline, Google Scholar
20. Buchli R, Duc CO, Martin E, et al: Assessment of absolute metabolite concentrations in human tissue by 31P MRS in vivo, I: cerebrum, cerebellum, cerebral gray and white matter. Magn Reson Med 1994; 32:447–452Crossref, Medline, Google Scholar
21. Kato T, Takahashi S, Inubushi T, et al: Phosphorus-31 magnetic resonance spectroscopic observations in 4 cases with anorexia nervosa. Prog Neuropsychopharmacol Biol Psychiatry 1997; 21:719–724Crossref, Medline, Google Scholar
22. Li SJ, Prost RW, Tan SG, et al: The decrease of phosphodiesters during photic stimulation in human primary visual cortex (abstract). Proceedings of the Society of Magnetic Resonance in Medicine 1993; 65Google Scholar
23. Kato T, Murashita J, Shioiri T, et al: Effect of photic stimulation on energy metabo1ism in the human brain measured by 31P MR spectroscopy. J Neuropsychiatry Clin Neurosci 1996; 8:417–422Link, Google Scholar
24. Petroff OAC, Prichard JW, Behar KS, et al: Cerebral intracellular pH by 31P nuclear magnetic resonance spectroscopy. Neurology 1985; 35:781–788Crossref, Medline, Google Scholar
25. Van Rijen PC, Luyten PR, Van Der Sprenkel JW, et al: 1H and 31P NMR measurement of cerebral lactate, high-energy phosphate levels, and pH in humans during voluntary hyperventilation: associated EEG, capnographic, and Doppler findings. Magn Reson Med 1988; 7:95–99Crossref, Medline, Google Scholar
26. Sappey-Marinier D, Calabrese G, Fein G, et al: Effect of photic stimulation on human visual cortex lactate and phosphates using 1H and 31P magnetic resonance spectroscopy. J Cereb Blood Flow Metab 1992; 12:584–592Crossref, Medline, Google Scholar
27. Tolkovski AM, Richards CD: Na+/H+ exchange is the major mechanism of pH regulation in cultured sympathetic neurons: measurement in single cell bodies and neurites using a fluorescent pH indicator. Neuroscience 1987; 22:1093–1102Crossref, Medline, Google Scholar
28. Rae C, Scott R, Thompson CH, et al: Brain pH correlates with IQ (abstract). Proceedings of the International Society of Magnetic Resonance in Medicine 1996; 953Google Scholar
29. Erecinska M, Silver IA: ATP and brain function. J Cereb Blood Flow Metab 1989; 9:2–19Crossref, Medline, Google Scholar
30. Rothman DL: 1H NMR studies of human brain metabolism and physiology, in NMR in Physiology and Biomedicine, edited by Gillies RJ. San Diego, CA, Academic Press, 1994, pp 353–372Google Scholar
31. Bottomley PA, Hardy CJ: Mapping creatine kinase reaction rates in human brain and heart with 4 tesla saturation transfer 31P NMR. J Magn Reson 1992; 99:443–448Google Scholar
32. Longo R, Ricci C, Palma LD, et al: Quantitative 31P-MRS of the normal adult human brain: assessment of interindividual differences and aging effects. NMR Biomed 1993; 6:53–57Crossref, Medline, Google Scholar
33. Kato T, Takahashi S, Shioiri T, et al: Reduction of brain phosphocreatine in bipolar II disorder detected by phosphorus-31 magnetic resonance spectroscopy. J Affect Disord 1994; 31:125–133Crossref, Medline, Google Scholar
34. Smith CD, Pettigrew LC, Avison MJ, et al: Frontal lobe phosphorus metabolism and neuropsychological function in aging and in Alzheimer's disease. Ann Neurol 1995; 38:194–201Crossref, Medline, Google Scholar
35. Gupta RK, Gupta P, Moore RD: NMR studies of intracellular metal ions in intact cells and tissues. Ann Rev Biophys Bioeng 1984; 13:221–246Crossref, Medline, Google Scholar
36. Iotti S, Frassineti C, Alderighi L, et al: In vivo assessment of free magnesium concentration in human brain by 31P MRS: a new calibration curve based on a mathematical algorithm. NMR Biomed 1996; 9:24–32Crossref, Medline, Google Scholar
37. Ramasamy R, Mota de Freitas DM: Competition between Li+ and Mg2+ for ATP in human erythrocytes. FEBS Lett 1989; 244:223–226Crossref, Medline, Google Scholar
38. Miller BL: A review of chemical issues in 1H NMR spectroscopy: N-acetyl-l-aspartate, creatinine and choline. NMR Biomed 1991; 4:47–52Crossref, Medline, Google Scholar
39. Tsai G, Coyle JT: N-Acetylaspartate in neuropsychiatric disorders. Prog Neurobiol 1995; 46:531–540Crossref, Medline, Google Scholar
40. Hetherington HP, Mason GF, Pan JW, et al: Evaluation of cerebral gray and white matter metabolite differences by spectroscopic imaging at 4.1 T. Magn Reson Med 1994; 32:565–571Crossref, Medline, Google Scholar
41. Cohen BM, Renshaw PF, Stoll AL, et al: Decreased brain choline uptake in older adults: an in vivo proton magnetic resonance spectroscopy study. JAMA 1995; 274:902–907Crossref, Medline, Google Scholar
42. Videen JS, Michaelis T, Pinto P, et al: Human cerebral osmolites during chronic hyponatremia: a proton magnetic resonance spectroscopy study. J Clin Invest 1995; 95:788–793Crossref, Medline, Google Scholar
43. Belmaker RH, Bersudsky Y, Benjamin J, et al: Manipulation of inositol-linked second messenger systems as a therapeutic strategy in psychiatry, in Depression and Mania: From Neurobiology to Treatment, edited by Gessa G, Fratta W, Pani L, et al. New York, Raven, 1995, pp 67–84Google Scholar
44. Cerdan S, Hansen CA, Johannsen R, et al: Nuclear magnetic resonance spectroscopic analysis of myo-inositol phosphates including inositol 1,3,4,5-tetrakisphosphate. J Biol Chem 1986; 261:14676–14680Medline, Google Scholar
45. Bruhn H, Stoppe G, Staedt J, et al: Quantitative proton MRS in vivo shows cerebral myo-inositol and cholines to be unchanged in manic-depressive patients treated with lithium (abstract). Proceedings of the Society of Magnetic Resonance in Medicine 1993; 1543Google Scholar
46. Sotak CH, Freeman DM: A method for volume-localized lactate editing using zero-quantum coherence created in a stimulated-echo pulse sequence. J Magn Reson 1988; 77:382–388Google Scholar
47. Dager SR, Strauss WL, Marro KI, et al: Proton magnetic resonance spectroscopy investigation of hyperventilation in subjects with panic disorder and control subjects. Am J Psychiatry 1995; 152:666–672Crossref, Medline, Google Scholar
48. Prichard J, Rothman D, Novotny E, et al: Lactate rise detected by 1H-NMR in human visual cortex during physiologic stimulation. Proc Natl Acad Sci USA 1991; 88:5829–5831Crossref, Medline, Google Scholar
49. Kuwabara T, Watanabe H, Tanaka K, et al: Mitochondrial encephalomyelopathy: elevated visual cortex lactate unresponsive to photic stimulation—a localized 1H-MRS study. Neurology 1994; 44:557–559Crossref, Medline, Google Scholar
50. Dager SR, Marro KI, Richards RL, et al: Localized magnetic resonance spectroscopy measurement of brain lactate during intravenous 0.5 M sodium lactate infusion in healthy volunteers. Life Sci 1992; 51:973–985Crossref, Medline, Google Scholar
51. Petroff OAC, Rothman DL, Behar KL, et al: Initial observation on effect of vigabatrin on in vivo 1H spectroscopic measurements of γ-aminobutyric acid, glutamate, and glutamine in human brain. Epilepsia 1995; 36:457–464Crossref, Medline, Google Scholar
52. Kato T, Shioiri T, Takahashi S, et al: Measurement of phosphoinositide metabolism in bipolar patients using in vivo 31P-MRS. J Affect Disord 1991; 22:185–190Crossref, Medline, Google Scholar
53. Kato T, Takahashi S, Shioiri T, et al: Alterations in brain phosphorous metabolism in bipolar disorder detected by in vivo 31P and 7Li magnetic resonance spectroscopy. J Affect Disord 1993; 27:53–60Crossref, Medline, Google Scholar
54. Kato T, Takahashi S, Shioiri T, et al: Brain phosphorous metabolism in depressive disorders detected by phosphorus-31 magnetic resonance spectroscopy. J Affect Disord 1992; 26:223–230Crossref, Medline, Google Scholar
55. Shioiri T, Kato T, Inubushi T, et al: Correlations of phosphomonoester measured by phosphorus-31 magnetic resonance spectroscopy in the frontal lobes and negative symptoms in schizophrenia. Psychiatry Res: Neuroimaging 1994; 55:223–235Crossref, Medline, Google Scholar
56. Kato T, Shioiri T, Murashita J, et al: Lateralized abnormality of high energy phosphate and bilateral reduction of phosphomonoester measured by 31P-MRS of the frontal lobes in schizophrenia. Psychiatry Res: Neuroimaging 1995; 61:151–160Crossref, Medline, Google Scholar
57. Deicken RF, Fein G, Weiner MW: Abnormal frontal lobe phosphorus metabolism in bipolar disorder. Am J Psychiatry 1995; 152:915–918Crossref, Medline, Google Scholar
58. Kato T, Shioiri T, Murashita J, et al: Phosphorus-31 magnetic resonance spectroscopy and ventricular enlargement in bipolar disorder. Psychiatry Res: Neuroimaging 1994; 55:41–50Crossref, Medline, Google Scholar
59. Pettegrew JW, Keshavan MS, Panchalingam K, et al: Alterations in brain high-energy phosphate and phospholipid metabolism in first episode, drug-naive schizophrenia: a pilot study of the dorsal prefrontal cortex by in vivo 31P NMR spectroscopy. Arch Gen Psychiatry 1991; 48:563–568Crossref, Medline, Google Scholar
60. Williamson PC, Drost D, Carr TJ, et al: Localized phosphorus 31 magnetic resonance spectroscopy in chronic schizophrenic patients and normal controls (letter). Arch Gen Psychiatry 1991; 18:578Google Scholar
61. Stanley JA, Williamson PC, Drost DJ, et al: An in vivo study of the prefrontal cortex of schizophrenic patients at different stages of illness via phosphorus magnetic resonance spectroscopy. Arch Gen Psychiatry 1995; 52:399–406Crossref, Medline, Google Scholar
62. Guze BH, Giltin M: The neuropathologic basis of affective disorders: neuroanatomic insights. J Neuropsychiatry Clin Neurosci 1994; 6:114–121Link, Google Scholar
63. Pettegrew JW, Keshavan MS, Minshew NJ, et al: 31P-MRS of metabolic alterations in schizophrenia and neurodevelopment, in NMR Spectroscopy in Psychiatric Brain Disorders, edited by Nasrallah HA, Pettegrew JW. Washington, DC, American Psychiatric Press, 1995, pp 45–77Google Scholar
64. Deicken DF, Weiner MW, Fein G: Decreased temporal lobe phosphomonoesters in bipolar disorder. J Affect Disord 1995; 33:195–199Crossref, Medline, Google Scholar
65. Yurgelun-Todd DA, Renshaw PF, Waternaux CM, et al: 1H spectroscopy of the temporal lobes in schizophrenic and bipolar patients (abstract). Proceedings of the Society of Magnetic Resonance in Medicine 1993; 1539Google Scholar
66. Stoll AL, Renshaw PF, Sachs GS, et al: The human brain resonance of choline-containing compounds is similar in patients receiving lithium treatment and controls: an in vivo proton magnetic resonance spectroscopy study. Biol Psychiatry 1992; 32:944–949Crossref, Medline, Google Scholar
67. Pettegrew JW, Minshaw NJ, Spiker D, et al: Alterations in membrane molecular dynamics in erythrocytes of patients with affective illness. Depression 1993; 1:88–100Crossref, Google Scholar
68. Kato T, Shioiri T, Murashita J, et al: Lateralized abnormality of high energy phosphate metabolism in the frontal lobes of patients with bipolar disorder detected by phase-encoded 31P-MRS. Psychol Med 1995; 25:557–566Crossref, Medline, Google Scholar
69. Campbell ID, Dobson CM, Williams RJP, et al: Resolution enhancement of protein PMR spectra using the difference between a broadened and a normal spectrum. J Magn Reson 1973; 11:172–181Google Scholar
70. Charles HC, Lazeyras F, Krishnan RKK, et al: Brain choline in depression: In vivo detection of potential pharmacodynamic effects of antidepressant therapy using hydrogen localized spectroscopy. Prog Neuropsychopharmacol Biol Psychiatry 1994; 18:1121–1127Crossref, Medline, Google Scholar
71. Renshaw PF, Lafer B, Christensen JD, et al: Proton MRS of the basal ganglia in major depression (abstract). Biol Psychiatry 1994; 35:685Google Scholar
72. Kato T, Hamakawa H, Shioiri T, et al: Proton MRS of the basal ganglia in patients with bipolar disorder (abstract). Proceedings of the Society of Magnetic Resonance in Medicine 1994; 605Google Scholar
73. Christensen JD, Renshaw PF, Stoll AL, et al: 31P Spectroscopy of the basal ganglia in major depression. (abstract) Proceedings of the Society of Magnetic Resonance in Medicine 1994; 608Google Scholar
74. Moore CM, Christensen JD, Lafer B, et al: Decreased adenosine triphosphate in the basal ganglia of depressed subjects: a phosphorus-31 magnetic resonance spectroscopy study (abstract). Proceedings of the International Society of Magnetic Resonance in Medicine 1996; 996Google Scholar
75. Domino EF: Proton MRS of choline in brain and red blood cells: effects of lithium therapy. in NMR Spectroscopy in Psychiatric Brain Disorders, edited by Nasrallah HA, Pettegrew JW. Washington, DC, American Psychiatric Press, 1995, pp 199–212Google Scholar
76. Sharma R, Venkatasubramanian PN, Barany M, et al: Proton magnetic resonance spectroscopy of the brain in schizophrenic and affective patients. Schizophrenia Res 1992; 8:43–49Crossref, Medline, Google Scholar
77. Spirtes MA: Lithium levels in monkey and human brain after chronic, therapeutic oral dosage. Pharmacol Biochem Behav 1976; 5:143–147Crossref, Medline, Google Scholar
78. Lafer B, Renshaw PF, Sachs G, et al: Proton MRS of the basal ganglia in bipolar disorder (abstract). Biol Psychiatry 1994; 35:685Google Scholar
79. Kato T, Hamakawa H, Shioiri T, et al: Choline-containing compounds detected by proton magnetic resonance spectroscopy in the basal ganglia in bipolar disorder. J Psychiatry Neurosci 1996; 21:248–254Medline, Google Scholar
80. Shioiri T, Hamakawa H, Kato T, et al: Proton magnetic resonance spectroscopy of the basal ganglia in patients with schizophrenia: a preliminary report. Schizophr Res 1996; 22:19–26Crossref, Medline, Google Scholar
81. Fujimoto T, Nakano T, Takano T, et al: Proton magnetic resonance spectroscopy of basal ganglia in chronic schizophrenia. Biol Psychiatry 1996; 40:14–18Crossref, Medline, Google Scholar
82. Stoll AL, Sachs GS, Cohen BM, et al: Choline treatment of rapid-cycling bipolar disorder: clinical and neurochemical findings in lithium-treated patients. Biol Psychiatry 1996; 40:382–388Crossref, Medline, Google Scholar
83. Woods BT, Chiu TM: In vivo 1H spectroscopy of the human brain following electroconvulsive therapy. Ann Neurol 1990; 28:796–802Crossref, Google Scholar
84. Felber SR, Pycha R, Hummer M, et al: Localized proton and phosphorus magnetic resonance spectroscopy following electroconvulsive therapy. Biol Psychiatry 1993; 33:651–654Crossref, Medline, Google Scholar
85. Prichard JW, Petroff OAC, Ogino T, et al: Cerebral lactate elevation by electroshock: a 1H magnetic resonance study. Ann NY Acad Sci 1987; 508:54–63Crossref, Medline, Google Scholar
86. Shioiri T, Kato T, Murashita J, et al: High-energy phosphate metabolism in the frontal lobes of patients with panic disorder detected by phase-encoded 31P-MRS. Biol Psychiatry 1996; 40:785–793Crossref, Medline, Google Scholar
87. Deicken RF, Calabrese G, Merrin EL, et al: 31Phosphorus magnetic resonance spectroscopy of the frontal and parietal lobes in chronic schizophrenia. Biol Psychiatry 1994; 36:503–510Crossref, Medline, Google Scholar
88. Fujimoto T, Nakano T, Takano T, et al: Study of chronic schizophrenics using 31P magnetic resonance chemical shift imaging. Acta Psychiatr Scand 1992; 86:455–462Crossref, Medline, Google Scholar
89. Agren H, Niklasson F: Creatinine and creatine in CSF: indices of brain energy metabolism in depression. J Neural Transm 1988; 74:55–59Crossref, Medline, Google Scholar
90. McMahon FJ, Stine OC, Meyers DA, et al: Patterns of maternal transmission in bipolar affective disorder. Am J Hum Genet 1995; 56:1277–1286Medline, Google Scholar
91. Kato T, Takahashi Y: Deletion of leukocyte mitochondrial DNA in bipolar disorder. J Affect Disord 1996; 37:67–73Crossref, Medline, Google Scholar
92. Deicken RF, Calabrese G, Merrin EL, et al: Basal ganglia phosphorous metabolism in chronic schizophrenia. Am J Psychiatry 1995; 152:126–129Crossref, Medline, Google Scholar
93. El-Mallakh RS: Lithium: Actions and Mechanisms, by El-Mallakh RS. Washington, DC, American Psychiatric Press, 1996Google Scholar
94. Bitran JA, Potter WZ, Manji HK, et al: Chronic Li+ attenuates agonist- and phorbol ester-mediated Na+/H+ antiport activity in HL-60 cells. Eur J Pharmacol 1990; 188:193-202Crossref, Medline, Google Scholar
95. Alpern RJ, Yamaji Y, Cano A, et al: Chronic regulation of the Na/H antiporter. J Lab Clin Med 1993; 122:137–140Medline, Google Scholar
96. Friedman E, Wang HY, Levinson D, et al: Altered platelet protein kinase C activity in bipolar affective disorder, manic episode. Biol Psychiatry 1993; 33:520–525Crossref, Medline, Google Scholar
97. Kato T, Takahashi S, Inubushi T: Brain lithium concentration measured with lithium-7 magnetic resonance spectroscopy: a review. Lithium 1994; 5:75–81Google Scholar
98. Renshaw PF, Sachs GS, Gonzalez RG: In vivo MRS measurement of lithium levels in brain, in NMR Spectroscopy in Psychiatric Brain Disorders, edited by Nasrallah HA, Pettegrew JW. Washington, DC, American Psychiatric Press, 1995, pp 179–198Google Scholar
99. Renshaw PF, Wicklund S: In vivo measurement of lithium in humans by nuclear magnetic resonance spectroscopy. Biol Psychiatry 1988; 23:465–475Crossref, Medline, Google Scholar
100. Komoroski RA, Newton JEO, Walker E, et al: In vivo NMR spectroscopy of lithium-7 in humans. Magn Reson Med 1990; 15:347–356Crossref, Medline, Google Scholar
101. Komoroski RA, Newton JEO, Sprigg JR, et al: In vivo 7Li nuclear magnetic resonance study of lithium pharmacokinetics and chemical shift imaging in psychiatric patients. Psychiatry Res: Neuroimaging 1993; 50:67–76Crossref, Medline, Google Scholar
102. Plenge P, Stensgaard A, Jensen HV, et al: 24-Hour lithium concentration in human brain studied by Li-7 magnetic resonance spectroscopy. Biol Psychiatry 1994; 36:511–516Crossref, Medline, Google Scholar
103. Ramaprasad S, Newton JEO, Cardwell D, et al: In vivo 7Li NMR imaging and localized spectroscopy of rat brain. Magn Reson Med 1992; 25:308–318Crossref, Medline, Google Scholar
104. Gyulai L, Wicklund SW, Greenstein R, et al: Measurement of tissue lithium concentration by lithium magnetic resonance spectroscopy in patients with bipolar disorder. Biol Psychiatry 1991; 29:1161–1170Crossref, Medline, Google Scholar
105. Gonzalez RG, Guimaraes AR, Sachs GS, et al: Measurement of human brain lithium in vivo by MR spectroscopy. Am J Neuroradiol 1993; 14:1027–1037Medline, Google Scholar
106. Kato T, Takahashi S, Inubushi T: Brain lithium concentrations by 7Li and 1H magnetic resonance spectroscopy in bipolar disorder. Psychiatry Res: Neuroimaging 1992; 45:53–63Crossref, Medline, Google Scholar
107. Kushnir T, Itzchak Y, Valevski A, et al: Relaxation times and concentrations of 7Li in the brain of patients receiving lithium therapy. NMR Biomed 1993; 6:39–42Crossref, Medline, Google Scholar
108. Sachs GS, Renshaw PF, Lafer B, et al: Variability of brain lithium levels during maintenance treatment: a magnetic resonance spectroscopy study. Biol Psychiatry 1995; 38:422–428Crossref, Medline, Google Scholar
109. Renshaw PF, Haselgrove JC, Bolinger L, et al: Relaxation and imaging of lithium in vivo. Magn Reson Imaging 1986; 4:193–198Crossref, Medline, Google Scholar
110. Kato T, Shioiri T, Inubushi T, et al: Brain lithium concentrations measured with lithium-7 magnetic resonance spectroscopy in patients with affective disorders: relationship to erythrocyte and serum concentrations. Biol Psychiatry 1993; 33:147–152Crossref, Medline, Google Scholar
111. Kato T, Inubushi T, Takahashi T: Relationship of lithium concentration in the brain measured by lithium-7 magnetic resonance spectroscopy to treatment response in mania. J Clin Psychopharmacol 1994; 14:330–335Crossref, Medline, Google Scholar
112. Kato T, Fujii K, Shioiri T, et al: Lithium side effects in relation to brain lithium concentration measured by lithium-7 magnetic resonance spectroscopy. Prog Neuropsychopharmacol Biol Psychiatry 1996; 20:87–97Crossref, Medline, Google Scholar
113. Heimberg C, Komoroski RA, Newton JEO, et al: 19F-MRS: a new tool for psychopharmacology, in NMR Spectroscopy in Psychiatric Brain Disorders, edited by Nasrallah HA, Pettegrew JW. Washington, DC, American Psychiatric Press, 1995, pp 213–234Google Scholar
114. Renshaw PF, Guimaraes AR, Fava M, et al: Accumulation of fluoxetine and norfluoxetine in human brain during therapeutic administration. Am J Psychiatry 1992; 149:1592–1594Crossref, Medline, Google Scholar
115. Karson CN, Newton JEO, Mohanakrishnan P, et al: Fluoxetine and trifluoperazine in human brain: a 19F-nuclear magnetic resonance spectroscopy study. Psychiatry Res 1992; 45:95–104Crossref, Medline, Google Scholar
116. Karson CN, Newton JEO, Livingston R, et al: Human brain fluoxetine concentrations. J Neuropsychiatry Clin Neurosci 1993; 5:322–329Link, Google Scholar
117. Miner CM, Davidson JRT, Potts NLS, et al: Brain fluoxetine measurements using fluorine magnetic resonance spectroscopy in patients with social phobia. Biol Psychiatry 1995; 38:696–698Crossref, Medline, Google Scholar
118. Strauss WL, Dager SR, Layton ME, et al: 19F MRS determination of acute and steady state brain fluvoxamine levels in obsessive compulsive disorder (abstract). Proceedings of the International Society of Magnetic Resonance in Medicine 1996; 415Google Scholar