Alteration of Regional Cerebral Glucose Utilization With Delusions in Alzheimer's Disease
Abstract
The authors examined 65 patients with Alzheimer's disease for delusions and explored the relationship of delusions with regional cerebral glucose metabolism determined by [18F]fluorodeoxyglucose PET. In patients with delusions (n=26), normalized glucose metabolism was significantly increased in the left inferior temporal gyrus and significantly decreased in the left medial occipital region as compared with those without delusions (n=39). The two groups were similar in age, sex, and dementia severity. These results suggest that delusions in Alzheimer's disease are attributable to a dysfunction in specific brain areas rather than a simple reaction to intellectual deficits.
The neuropsychiatric disturbance in patients with Alzheimer's disease (AD) is a major cause of anxiety and concern for caregivers and a frequent cause of institutionalization. Appropriate management of behavioral symptoms may lessen the burden of caregivers and may postpone institutionalization. Therefore, evaluation and management of behavioral symptoms are of considerable importance in practice.
Delusions are, in particular, a concern for management of AD. DSM-IV1 has classified dementia of the Alzheimer's type into subtypes with or without delusions. In a review of 21 studies, Wragg and Jeste2 reported that frequencies of AD patients who had experienced delusions at some time in the course of their illness ranged from 10% to 73%; the greatest number of studies had clusters between 30% and 38% (median=33.5%). The underlying mechanism for delusion formation in AD is still unclear. Although delusions in AD may be an “understandable” reaction to intellectual deficits,3 evidence of involvement of a specific brain area is increasing in other neurologic disorders.4 However, efforts to explore the relationship between delusions and focal brain dysfunction in AD patients using SPECT or PET are limited, and have demonstrated conflicting results; delusions or other psychiatric symptoms in AD or other dementias were associated with frontal hyperperfusion in combination with hypoperfusion in the posterior temporal region,5 with hypoperfusion in temporal lobes,6 with left frontal hypoperfusion relative to the opposite side,7 with right anterior temporal hypoperfusion,8 with bilateral parietotemporal9 or frontal10 glucose hypometabolism, or with hypometabolism in bilateral orbitofrontal and cingulate areas and left medial temporal areas and normalized hypermetabolism in bilateral superior temporal and inferior parietal areas.11 These conflicts may be due to differences of experimental design, including selection criteria, sample size, and method for determination of cerebral blood flow or metabolism.
We postulated that if neuroanatomical substrates were underlying delusions in AD, distinctive features in regional cerebral metabolism that differentiate the patients with delusions from those without delusions would be found in the limbic and/or association cortices. To investigate this hypothesis, we prospectively examined 65 AD patients for delusions and explored the relationship of delusions in AD with regional cerebral glucose metabolism (CMRglc) as determined by PET.
METHODS
Subjects
This study adhered to the Clinical Study Guidelines and the PET Drug Usage Manual, Ethical Committee, Hyogo Institute for Aging Brain and Cognitive Disorders, 1993, and the Declaration of Human Rights, Helsinki, 1975, and was approved by the Internal Review Board. After a complete description of the study to the subjects and their relatives, written informed consent was obtained.
According to the following criteria, 65 patients were selected from 311 Japanese patients who were examined in our hospital between February 1994 and May 1996 and were diagnosed to fulfill the DSM-IV1 criteria for dementia of the Alzheimer's type and the National Institute of Neurological and Communicative Disorders and Stroke/Alzheimer's Disease and Related Disorders Association criteria for probable AD.12 All patients were examined by both neurologists and psychiatrists during a short-term admission and given routine laboratory tests, standard neuropsychological examinations, electroencephalography, magnetic resonance (MR) images of the brain, and MR angiography of the neck and head, which were all incorporated into the diagnosis. The inclusion criteria included 1) minimal to moderate functional severity (grades 0.5, 1, and 2 on the Clinical Dementia Rating Scale [CDR]13); 2) availability of reliable information from caregivers; and 3) obtaining informed consent from patients and their relatives for all procedures of this study. The exclusion criteria included 1) complication of other neurological diseases or physical conditions such as diabetes mellitus, thyroid diseases, vitamin deficiencies, malignant diseases, and so on; 2) history of previous psychotic illness or substance abuse before onset of dementia; 3) evidence of focal brain lesions on MRI; 4) presence of severe language, attention, or behavioral disorders that would make PET examination difficult; and 5) left- or both-handedness. Subjects included 48 women and 17 men; the mean age (±SD) was 71.2±6.9 years; the mean educational attainment was 9.0±2.1 years; and the mean duration of illness was 32.7±18.5 months.
Assessments of Delusions and Dementia Severity
According to DSM-IV,1 delusion was defined as a firmly sustained, false belief based on incorrect inference about external reality not attributable to the patient's cultural or subcultural experience. A single rater assessed the presence of delusion by a structured caregiver interview with the delusion subscale of the Behavioral Pathology in Alzheimer Disease Rating Scale14 or with that of the Neuropsychiatric Inventory.15 Although 4 patients had been treated with sedatives because of compromised delusions and behavioral derangements, delusions in each patient had not been completely controlled. The severity of dementia was assessed with CDR13 and the Mini-Mental State Examination (MMSE).16
PET Examination
Medication with sedating or nootropic agents, if any, was discontinued at least 2 weeks before PET examination and was restarted or initiated thereafter if required. Detailed PET scanning for measuring CMRglc has been described elsewhere.17 All subjects had fasted for at least 4 hours before PET scanning. MR images (sagittal gradient echo and coronal 3-dimensional spoiled gradient echo) were obtained before PET scanning to determine the anatomical coordinates for PET positioning and postscan image registration. PET was performed with a PET scanner (Headtome IV, Shimadzu Corp., Kyoto, Japan), under resting conditions with eyes closed and ears unplugged.18 On the table of the PET scanner, the head was placed horizontally, and the gantry and the table of the PET scanner were adjusted according to the coordinates determined with MRI, so that scans were taken parallel to the anterior commissure–posterior commissure (AC-PC) plane from 32.5 mm below to 52.0 mm above the AC-PC plane at 6.5-mm intervals. We chose the direct AC-PC plane scanning instead of the orbitomeatal plane scanning to fit the stereotaxic atlas of Talairach and Tournoux,19 without re-slicing that might reduce the original spatial resolution. Brain scanning was started at 60 min after an injection of [18F]fluorodeoxyglucose (FDG), and emission data were collected for 12 min. Values of regional CMRglc were calculated by Phelps et al.'s autoradiographic method.20 Patients were closely observed by radiologists, were monitored with a motion-detection device during the PET examination, and were repeatedly asked if they were experiencing hallucinations.
PET and MR image data sets were directly transmitted to a workstation (Indigo 2 Extreme, Silicon Graphics, Mountain View, CA) from the PET and MR imaging units and were analyzed with an image-analyzing software (Dr. View ver. 4.0, Asahikasei Joho System, Tokyo). MR images of identical three-dimensional scales and coordinates to PET images were made for anatomical references of PET analysis. Both PET and MR images were displayed side by side on a display monitor together with the stereotaxic atlas. One or more circular regions of interest (ROIs) of 10 mm diameter were placed on 20 cortical regions, including the dorsolateral prefrontal lobe (superior, middle, and inferior frontal gyri); basal prefrontal lobe; anterior cingulate gyrus; medial temporal region (hippocampus and parahippocampal gyrus); superior temporal gyrus; middle temporal gyrus; inferior temporal gyrus; medial occipital region (medial occipitotemporal gyrus, lateral occipitotemporal gyrus, and cuneus); lateral occipital region; and inferior parietal lobules (Figure 1). To increase the reliability, the values of ROIs in each cortical region were averaged. A neuroradiologist blinded to the patients' status was employed in ROI placement and measurements. In order to remove the intersubject difference in baseline metabolism, analyses were undertaken on normalized value of regional CMRglc (nCMRglc), a ratio of regional CMRglc to the mean value of all cortical metabolic rates for glucose. Although this type of normalization may factor in differences in disease severity, we adopt this value because it is highly reliable. Effects of disease severity on metabolism were expected to be similar in the groups with and without delusions, making it unlikely that normalization would cause a bias.
Statistical Analysis
Differences of regional cerebral metabolism between AD patients with and without delusions were analyzed with repeated-measures analysis of variance (ANOVA), with one between-subject factor, group (patients with and without delusions), and one within-subject factor, brain region. Two main effects on nCMRglc (group and region) and one interaction (group×region) were assessed. The significant interaction was tested with post hoc univariate ANOVA with Bonferroni correction for multiple comparisons, where the threshold of F-value was set at 9.92 (df=1,63), corresponding to P<0.05/20=0.0025. Student's t-test, chi-square test, and Fisher's exact probability test with level of significance set at P<0.05 were used for demographic and neuropsychological data analyses where appropriate. Computation was performed with the SAS program package, release 6.10 (Statistical Analysis Systems, Cary, NC).
RESULTS
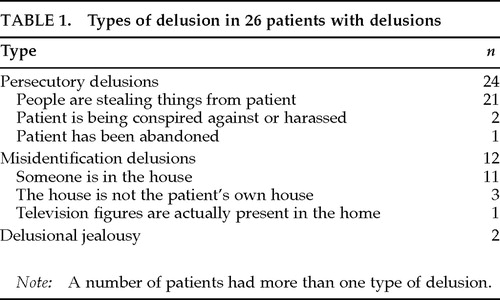
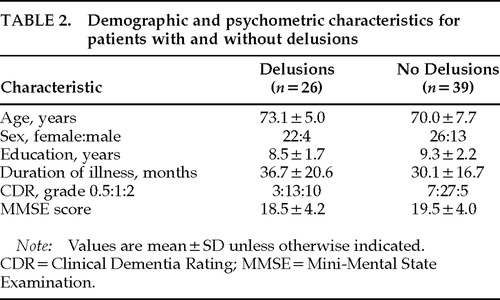
Delusions were present in 26 patients (40.0%). The types of delusions are summarized in Table 1. Thirty-nine patients were free from delusions. Among patients with delusions, 7 had hallucinations (visual hallucinations in 6 patients, visual and auditory in 1); among those without delusions, 1 had visual hallucinations (Fisher's exact probability test, P=0.0054). However, experience of hallucinations was not reported during the PET examination. No significant differences were found between those with and without delusions in age, sex, years of education, duration of illness, or severity of dementia (Table 2).
The means and standard deviations of nCMRglc in each region are summarized in Table 3. The repeated ANOVA revealed no significant effect of group (patients with and without delusions) in global metabolic activity (F=3.83, df=1,63, P=0.055), but a significant effect of brain region (F=108.4, df=19,1197, P<0.0001). The group×region interaction was highly significant (F=3.44, df=19,1197, P<0.0001). After Greenhouse-Geisser adjustment, this interaction effect remained significant (P=0.0019). Post hoc univariate ANOVAs with Bonferroni correction demonstrated that the left inferior temporal gyrus (F=14.75, df=1,63, P=0.0003) and the left medial occipital region (F=10.83, df=1,63, P=0.0016) significantly contributed to this interaction effect; the mean nCMRglc was significantly increased in the left inferior temporal gyrus and was significantly decreased in the left medial occipital region in those with delusions (Table 3; Figure 2). Data for patients with hallucinations did not make specific clusters in either region. There was a significant inverse correlation of nCMRGlc between the left inferior temporal gyrus and the left medial occipital region (Pearson r=–0.464, P<0.0001).
DISCUSSION
Several studies carried out to determine a focal abnormality associated with delusions in AD have reported conflicting results. Gustafson and Risberg,5 examining presenile dementia not specific to AD by using intra-arterial xenon-133 injection technique, found a high gray matter blood flow, especially in the frontal lobe, in combination with a decreased flow in the posterior temporal region, in patients with paranoid symptoms. Starkstein et al.,6 using [99mTc]HMPAO SPECT, demonstrated that the mean cerebral blood flow significantly decreased in the temporal lobes in AD patients with delusions compared with those without delusions. Using the same technique, Kotrla et al.7 reported that AD patients with delusions had hypoperfusion in the left frontal lobe as compared with the opposite side. In their small-sized but longitudinal study, Pontón et al.8 demonstrated rapid deterioration of cerebral blood flow in the right anterior temporal regions in AD patients with delusions compared with those without delusions. The main feature of patients' delusions in their study was Capgras syndrome, which is reportedly associated with lesions in right cerebral hemisphere.21,22 The study by Grady et al.,9 retrospectively analyzing 33 patients with AD who received PET scans, demonstrated that bilateral parietotemporal metabolic deficits were associated with psychotic symptoms. Sultzer et al.,10 evaluating 21 patients with AD by using the Neurobehavioral Rating Scale and FDG PET, found that psychosis was significantly correlated with frontal glucose hypometabolism. Mentis et al.11 reported that AD patients with delusional misidentification syndrome, when compared with those without this syndrome, had significant glucose hypometabolism in bilateral orbitofrontal and cingulate and left medial temporal areas and significant normalized hypermetabolism in the bilateral superior temporal and inferior parietal areas. Possible causes of the disagreement among those studies include different techniques for regional cerebral blood flow or metabolism measurement, different distribution of delusions or psychoses, different statistical techniques, and small-sized or retrospective analysis.
Several strengths of our study can be noted. First, conservative statistical analyses were employed for a relatively large (the largest) number of patients. Second, the variables that may influence regional CMRglc, including age, sex, handedness, and severity of the disease, were comparable between those with and those without delusions. Third, the type of delusions was unbiased (persecutory delusion is common in AD23,24). Finally, a possible effect of hallucinations on PET results was unlikely because hallucination was absent during the PET examination; a relatively small proportion of patients, if any, were affected.
We found a modest but significant normalized glucose hypometabolism in the left medial occipital region and a modest but significant normalized glucose hypermetabolism in the inferior temporal gyrus in the patients with delusions. This finding supports the hypothesis that delusions in AD are associated with dysfunction in specific brain areas.
An association between psychotic symptoms and dysfunction in each region has been repeatedly demonstrated in other neuropsychiatric disorders. A medial occipital involvement often produces agitated delirium after stroke. Severe agitated delirium, where delusions are main features in addition to hallucinations and emotional and autonomic excitement,25 occurs after unilateral or bilateral medial occipital lesions with or without posterior temporal lesions due to posterior cerebral artery territory ischemia.26–29 In some studies, left-sided predominance of lesions has been stressed.27,29 These findings on focal medial occipital destruction are consistent with our results, and they support the notion that dysfunction in this region, as well, is attributable to the development of delusions. Increased activity in the left temporal lobe related to positive psychiatric symptoms has been repeatedly pointed out in schizophrenic patients. DeLisi et al.30 reported that patients with chronic schizophrenia had significantly greater CMRglc in the left than the right anterior temporal lobe and that the extent of this lateralization was in proportion to the severity of psychopathology. Liddle et al.,31 examining psychiatric symptom scores and regional cerebral blood flow with PET in schizophrenic patients, found that the reality distortion factor scores that were loaded by delusion and hallucination scores correlated positively with regional cerebral blood flow in the left temporal region. Furthermore, Kaplan et al.,32 in a study of untreated schizophrenic patients, reported correlation between the reality distortion factor scores and relative CMRglc in the left temporal region. Our results that relative hyperactivity in the left inferior temporal gyrus was accompanied by delusions suggest that dysfunction in the neuronal networks, as occurs in schizophrenia, is conceivable in AD.
Cummings33 postulated, from data on anatomical sites of pathology across a variety of organic brain disorders, that delusions arise from the disruption of connections between limbic and cortical areas. Krieckhaus et al.34 proposed that delusions of paranoid schizophrenia are attributable to a hyperactivity of the dopamine-sensitive hippocampal CA1 neurons, which generates a diffuse reinforcement signal via the inferior temporal cortex and thus is responsible for the fixation of belief in the parietal-temporal-occipital association cortices. Devinsky et al.27 suggested that damages involving the posterior hippocampus and parahippocampal and occipitotemporal gyri destroy the specific connections between the neocortex and limbic system, causing delirium. These arguments are consistent with our results, suggesting that malfunction of the network system involving the hippocampus, the inferior temporal cortex, and the medial occipital cortex may account for delusions in AD. The negative correlation of metabolism between the inferior temporal cortex and the medial occipital cortex may support the functional interaction between these areas.
The magnitude of group difference was modest and the statistical analysis applied was very conservative, suggesting dysfunction in other brain regions might be involved in the development of delusions. If delusions had been present during PET scanning, the group difference might have been more marked. Despite these limitations, the findings of significant differences in normalized regional cerebral metabolism between the patients with delusions and those without delusions under such conditions support a hypothesis of association between delusions in AD and cortical dysfunction.
ACKNOWLEDGMENTS
The authors thank Yoko Takatsuki, B.A., R.S.T., Akitsugu Tokimasa, R.O.T., and Misato Fujimori, M.A. (Neurorehabilitation service) for their technical assistance.

FIGURE 1. Template MRI images of brain slices used for data analysis. These slices were, respectively, –13.0, –6.5, 0.0, 13.0, 32.5, 45.5 mm above the anterior–posterior commissure line. Regions of interest (ROIs): 1=superior temporal gyri; 2=middle temporal gyri; 3=inferior temporal gyri; 4=medial temporal lobes; 5=basal prefrontal cortices; 6=anterior cingulate gyri; 7=dorsolateral prefrontal cortices; 8=medial occipital cortices; 9=lateral frontal cortices; 10=inferior parietal lobules. To increase the reliability, the values of ROIs in each cortical region were averaged.

FIGURE 2. Scatterplots showing the normalized regional cerebral glucose metabolism values (nCMRglc) in the left inferior temporal gyrus and the medial occipital cortex for the patient groups with and without delusions. Bars indicate mean± 1 SD. In certain instances patients had identical values, and so some of the points represent more than one patient.
 |
 |
 |
1. American Psychiatric Association: Diagnostic and Statistical Manual of Mental Disorders, 4th edition. Washington, DC, American Psychiatric Association, 1994Google Scholar
2. Wragg RE, Jeste DV: Overview of depression and psychosis in Alzheimer's disease. Am J Psychiatry 1989; 146:577–587Crossref, Medline, Google Scholar
3. Rubin EH: Psychosis in neurologic diseases: delusions as part of Alzheimer's disease. Neuropsychiatry Neuropsychol Behav Neurol 1992; 5:108–113Google Scholar
4. Cummings JL: Psychosis in neurologic disease: neurobiology and pathogenesis. Neuropsychiatry Neuropsychol Behav Neurol 1992; 5:144–150Google Scholar
5. Gustafson L, Risberg J: Regional cerebral blood flow related to psychiatric symptoms in dementia with onset in the presenile period. Acta Psychiatr Scand 1974; 50:516–538Crossref, Medline, Google Scholar
6. Starkstein SE, Vázquez S, Petracca G, et al: A SPECT study of delusions in Alzheimer's disease. Neurology 1994; 44:2055–2059Crossref, Medline, Google Scholar
7. Kotrla KJ, Chacko RC, Harper RG, et al: SPECT findings on psychosis in Alzheimer's disease. Am J Psychiatry 1995; 152:1470–1475Crossref, Medline, Google Scholar
8. Pontón MO, Darcourt J, Miller BL, et al: Psychometric and SPECT studies in Alzheimer's disease with and without delusions. Neuropsychiatry Neuropsychol Behav Neurol 1995; 8:264–270Google Scholar
9. Grady CL, Haxby JV, Schapiro MB, et al: Subgroups in dementia of the Alzheimer type identified using positron emission tomography. J Neuropsychiatry Clin Neurosci 1990; 2:373–384Link, Google Scholar
10. Sultzer DL, Mahler ME, Mandelkern MA, et al: The relationship between psychiatric symptoms and regional cortical metabolism in Alzheimer's disease. J Neuropsychiatry Clin Neurosci 1995; 7:476–484Link, Google Scholar
11. Mentis MJ, Weinstein EA, Horwitz B, et al: Abnormal brain glucose metabolism in the delusional misidentification syndromes: a positron emission tomography study in Alzheimer's disease. Biol Psychiatry 1995; 38:438–449Crossref, Medline, Google Scholar
12. McKhann G, Drachman D, Folstein M, et al: Clinical diagnosis of Alzheimer's disease: report of the NINCDS-ADRDA Work Group under the auspices of Department of Health and Human Services Task Force on Alzheimer's disease. Neurology 1984; 34:939–944Crossref, Medline, Google Scholar
13. Hughes CP, Berg L, Danziger WL, et al: A new clinical scale for the staging of dementia. Br J Psychiatry 1982; 140:566–572Crossref, Medline, Google Scholar
14. Reisberg B, Borenstein J, Salob SP, et al: Behavioral symptoms in Alzheimer's disease: phenomenology and treatment. J Clin Psychiatry 1987; 48(suppl 5):9–15Google Scholar
15. Cummings JL, Mega M, Gray K, et al: The Neuropsychiatric Inventory: comprehensive assessment of psychopathology in dementia. Neurology 1994; 44:2308–2314Crossref, Medline, Google Scholar
16. Folstein MF, Folstein SE, McHugh PR: “Mini-Mental State”: a practical method for grading the cognitive state of patients for the clinician. J Psychiatr Res 1975; 12:189–198Crossref, Medline, Google Scholar
17. Ishii K, Sasaki M, Kitagaki H, et al: Reduction of cerebellar glucose metabolism in advanced Alzheimer's disease. J Nucl Med 1997; 38:925–928Medline, Google Scholar
18. Iida H, Miura S, Kanno I, et al: Design of evaluation of Headtome IV: a whole body positron emission tomograph. IEEE Trans Nucl Sci 1989; NS-37:1006–1010Google Scholar
19. Talairach J, Tournoux P: Co-planar stereotaxic atlas of the human brain. Stuttgart, Thieme Verlag, 1988Google Scholar
20. Phelps ME, Huang SC, Hoffman EJ, et al: Tomographic measurement of local cerebral glucose metabolic rate in humans with (F-18)2-fluoro-2-deoxy-d-glucose: validation of method. Ann Neurol 1979; 6:371–388Crossref, Medline, Google Scholar
21. Paillère-Martinot ML, Dao-Castellana MH, Masure MC, et al: Delusional misidentification: a clinical, neuropsychological and brain imaging case study. Psychopathology 1994; 27:200–210Crossref, Medline, Google Scholar
22. Lebert F, Pasquier F, Steinling M, et al: SPECT data in a case of secondary Capgras delusion. Psychopathology 1994; 27:211–214Crossref, Medline, Google Scholar
23. Cummings JL, Miller B, Hill MA, et al: Neuropsychiatric aspects of multi-infarct dementia and dementia of the Alzheimer type. Arch Neurol 1987; 44:389–393Crossref, Medline, Google Scholar
24. Devanand DP, Miller L, Richards M, et al: The Columbia University Scale for Psychopathology in Alzheimer's Disease. Arch Neurol 1992; 49:371–376Crossref, Medline, Google Scholar
25. Lipowski ZJ: Delirium (acute confusional states). JAMA 1987; 258:1789–1792Crossref, Medline, Google Scholar
26. Medina JL, Rubino FA, Ross E: Agitated delirium caused by infarctions of the hippocampal formation and fusiform and lingual gyri: a case report. Neurology 1974; 24:1181–1183Crossref, Medline, Google Scholar
27. Devinsky O, Bear D, Volpe BT: Confusional states following posterior cerebral artery infarction. Arch Neurol 1988; 45:160–163Crossref, Medline, Google Scholar
28. Milandre L, Brosset C, Botti G, et al: Étude de 82 infarctus du territoire des artères cérébrales postérieures [A study of 82 cases of posterior cerebral artery territory infarction]. Rev Neurol (Paris) 1994; 150:133–141Medline, Google Scholar
29. Nicolai A, Lazzarino LG: Acute confusional states secondary to infarctions in the territory of the posterior cerebral artery in elderly patients. Ital J Neurol Sci 1994; 15:91–96Crossref, Medline, Google Scholar
30. DeLisi LE, Buchsbaum MS, Holcomb HH, et al: Increased temporal lobe glucose use in chronic schizophrenic patients. Biol Psychiatry 1989; 25:835–851Crossref, Medline, Google Scholar
31. Liddle PF, Friston KJ, Frith CD, et al: Patterns of cerebral blood flow in schizophrenia. Br J Psychiatry 1992; 160:179–186Crossref, Medline, Google Scholar
32. Kaplan RD, Szechtman H, Franco S, et al: Three clinical syndromes of schizophrenia in untreated subjects: relation to brain glucose activity measured by positron emission tomography. Schizophr Res 1993; 11: 47–54Google Scholar
33. Cummings JL: Organic delusions: phenomenology, anatomical correlations, and review. Br J Psychiatry 1985; 146:184–197Crossref, Medline, Google Scholar
34. Krieckhaus EE, Donahoe JW, Morgan MA: Paranoid schizophrenia may be caused by dopamine hyperactivity of CA1 hippocampus. Biol Psychiatry 1992; 31:560–570Crossref, Medline, Google Scholar