One-Year Change in Cerebral Glucose Metabolism in Patients With Alzheimer's Disease
Abstract
By using [18F]-2-fluoro-deoxy-d-glucose and positron emission tomography, the authors studied changes in regional glucose metabolism after a 1-year interval in patients with mild Alzheimer’s disease (AD). Glucose metabolism declined over time in the bilateral precuneus and posterior cingulate gyri and in the frontal, temporal, and parietal cortices. Glucose metabolism in these regions may be a useful measure of the progression of AD and a valid surrogate outcome measure of clinical drug trials.
In Alzheimer’s disease (AD), decreases in regional cerebral blood flow (rCBF) and metabolism are reported to precede and to be more severe than decreases in cognitive function and brain volume.1,2 Several studies have examined longitudinal changes in regional cerebral perfusion3–6 or glucose metabolism1,2,7–9 in patients with AD by using single photon emission computed tomography (SPECT) or positron emission tomography (PET). Most of these studies adopted a conventional region of interest technique. As region of interest analyses focus on regions selected according to an a priori hypothesis, they may overlook substantial changes in the “uninteresting” areas.
In this study, changes in cerebral glucose metabolism that occurred in patients with AD over a 1-year period by using [18F]-2-fluoro-deoxy-d-glucose (FDG) PET were examined. A voxel-by-voxel analysis, which avoids the risk of overlooking regions that may be important was also used.10 As the pattern and rate of disease progression in AD may depend on the disease stage,11,12 only patients in the early stage of AD were included.
METHODS
This study was conducted at Hyogo Institute for Aging Brain and Cognitive Disorders, a research-oriented hospital for dementia. All procedures followed the Clinical Study Guidelines and the PET Drug Usage Manual, Ethical Committee, Hyogo Institute for Aging Brain and Cognitive Disorders, 1993, and were approved by the Institutional Review Board. Written, informed consent was obtained for all patients and their caregivers according to the Declaration of Human Rights, Helsinki, 1975.
One hundred thirteen patients with AD who fulfilled the inclusion criteria were examined by using PET between March 1994 and February 1998. All patients were examined by both neurologists and psychiatrists and were given routine laboratory tests. Electroencephalograms, magnetic resonance imaging (MRI) of the brain, and MR angiography of the head and neck were obtained for all patients. The inclusion criteria for PET were 1) the criteria of the National Institute of Neurological Disease and Stroke/Alzheimer’s Disease and Related Disorders Association for probable AD13 and 2) minimal to mild functional severity (grades 0.5 and 1) on the Clinical Dementia Rating Scale.14 Excluded were patients 1) with medical illnesses possibly causing cognitive impairment, including thyroid diseases, vitamin deficiencies, and malignant diseases; 2) patients with developmental abnormalities, substance abuse, or significant neurological antecedents such as brain traumas, brain tumors, epilepsies, and inflammatory diseases; 3) patients with history of previous mental illnesses such as depression before onset of dementia; 4) patients with evidence of focal brain lesions on MRI, including lacunar infarcts and hematoma; 5) patients with left- or both-handedness; and 6) patients whose informed consent was not obtained. Patients with white matter or subcortical hyperintense lesions on T2-weighted images, which were not shown on T1-weighted images, were not excluded.
Among those patients, 29 had a follow-up PET examination after a 1-year interval (mean=395 days, SD=32) as part of an annual follow-up program.15 The subjects consisted of 17 women and 12 men, and the mean age at baseline examination was 66.1 years (SD=8.5), while the mean educational attainment was 9.8 years (SD=2.8). The mean duration of symptoms, which was determined through an interview with the primary caregiver and defined as the time between the first appearance of symptoms of sufficient severity to interfere with social or occupational functioning and admission,16 was 32.1 months (SD=22.9). The apolipoprotein E genotyping was ϵ3/ϵ3 in 11 patients, ϵ3/ϵ4 in 12 patients, and ϵ4/ϵ4 in six patients. The mean baseline and follow-up scores on the Mini-Mental State Examination17 were 22.5 (SD=2.7) and 21.0 (SD=4.2) (t=2.99, df=28, p=0.0058, two-tailed, paired t test), and mean scores on the Alzheimer’s Disease Assessment Scale Cognitive Subscale18 were 15.0 (SD=4.8) and 18.0 (SD=8.4) (t=–2.23, df=28, p=0.031, two-tailed, paired t test).
This study started before the approval of donepezil hydrochloride in Japan (donepezil hydrochloride is only one drug licensed in Japan for the treatment of AD and launched in November 1999), and none of the patients received any anti-AD drugs during the study period. The PET data from one part of these 29 patients had been used in our previous studies.19–25
The detailed PET procedure is described elsewhere.26 In brief, fluorodeoxyglucose-positron emission tomography (FDG PET) images were obtained using a Headtome IV scanner (Shimadzu Corp., Kyoto, Japan). All subjects had fasted for at least 4 hours before PET scanning. Subjects were studied under resting conditions with eyes closed and ears unplugged. After a transmission scan, a 12-minute emission scan was started 60 min after an intravenous injection of 185–370 MBq of FDG. We used NEUROSTAT (University of Michigan, Ann Arbor, MI, USA) for anatomical standardization of PET images, as brain atrophy is sometimes seen in AD patients. In our previous study,27 we noted that NEUROSTAT was more suitable than Statistical Parametric Mapping 99 (SPM 99, The Wellcome Department of Neurology, London, UK) for anatomical standardization of atrophied brains. The image sets were transformed to a standard stereotactic space on a Power Mac G4 computer (Apple, Cupertino, Calif.) using the part of the program NEUROSTAT that generates standardized three-dimensional stereotactic surface projections data sets for individual subjects. Then, regional cerebral metabolic images were compared by using SPM 99. The PET images were smoothed using an isotropic Gaussian filter of 12 mm diameter to compensate for intersubject gyral variability and to reduce high frequency noise. Finally, after individual global counts were normalized by the glucose metabolism of the pons,28 within-group comparisons between initial and follow-up examinations were performed on a voxel-by-voxel basis on all voxels common to each subject,10 The thresholds were set at p=0.001. Correction for multiple comparisons was not performed.
RESULTS
In patients with mild AD, glucose metabolism (relative to the glucose metabolism in the pons) was found to decrease significantly in several regions of the brain over the course of 1 year. These regions included the inferior parietal lobule, precuneus, and posterior cingulate gyri in the right side and the lateral parieto-temporo-occipital cortex, precuneus, inferior temporal to middle occipital gyri, and middle to inferior frontal gyri in the left side (Table 1 and Figure 1). No brain regions showed a significant increase in relative regional glucose metabolism. The regions showing decreases in glucose metabolism were comparable for patients with and without the APOE ϵ4 allele.
DISCUSSION
This study clearly demonstrates a significant involvement in the parietal association cortices and temporal and frontal gyri. In addition to these regions, we found significant involvement in the bilateral precunei and posterior cingulate gyri. The former findings are consistent with the results of previous studies,1,2,4–6 whereas the latter findings were not previously detected in longitudinal functional neuroimaging studies. However, a selective decrease in rCBF and/or glucose metabolism in these areas has been reported in the very early stage of AD.6,29–31 Our findings are consistent with the concept that the brain regions that show functional changes also show further deficits,2 at least over a 1-year period during the early stage.
The medial temporal structures including the hippocampal formation, entorhinal cortex, and amygdala are initially affected in AD.32 In the early stage of AD, a significant atrophy of these structures has been revealed by MRI morphometry,33 and a significant reduction of cerebral blood flow has been demonstrated.6 However, we failed to detect a significant change of glucose metabolism in the medial temporal areas. Similarly, recent PET studies failed to find any significant decreases in glucose metabolism in the medial temporal regions, even when glucose hypometabolism was noticeable in the parietal association cortices.34,35 Taking these findings into consideration, metabolic changes in the medial temporal structures may be mild or difficult to detect in the early stage of AD. Thus, the metabolic changes in these regions are not appropriate for monitoring the progression of AD or making an early diagnosis of the disease.
The generalizability of this study is limited by the hospital-based, small-scaled study design. The selection of subjects was unintentional but possibly biased. Another methodological limitation was the use of SPM for voxel-by-voxel analysis. Statistical parametric mapping was developed originally as an analytical tool for PET activation studies of healthy volunteers and was not intended to use in studies of patients with brain disease. It has been reported that potential artifacts can be introduced when SPM is applied to atrophic brains.27 Nevertheless, SPM has been commonly used for voxel-by-voxel analysis in studies on AD and generated a number of significant findings. Furthermore, in order to reduce possible artifacts, we made use of NEUROSTAT, an alternate software for anatomical normalization and registration, of which performance was more accurate than SPM when applied to atrophic brain.27
As mentioned above, decreases in rCBF and glucose metabolism are reported to precede and to be more pronounced than decreases in cognitive function and brain volume.1,2 Our findings suggest that evaluation of glucose metabolic changes in the parietal, temporal, and frontal cortices, precunei, and posterior cingulate gyri (but not in the medial temporal structures) can be useful not only for the early diagnosis of AD but also for monitoring the progression of AD in its early stage. Functional brain imaging can also be a valid and useful surrogate outcome measure for anti-Alzheimer’s disease drug trials, as it would be more sensitive than cognitive measures or morphological brain imaging.
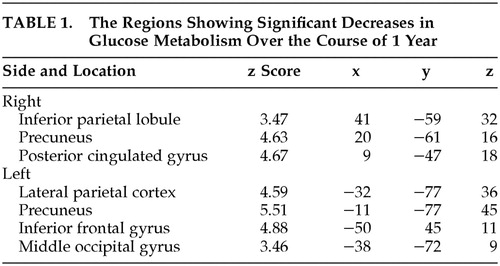 |

FIGURE 1. Statistical Parametric Mapping Analyses of Changes in Regional Glucose Metabolism of Patients With Mild Alzheimer’s Disease After a 1-Year Intervala
aLeft, orthogonal projections of areas where regional glucose metabolism declined significantly during the period. Right, surface rendering on standard MR images of the same areas.
1 Grady CL, Haxby JV, Horwitz B, et al.: Longitudinal study of the early neuropsychological and cerebral metabolic changes in dementia of the Alzheimer type. J Clin Exp Neuropsychol 1988; 10:576–596Crossref, Medline, Google Scholar
2 Smith GS, de Leon MJ, George AE, et al.: Topography of cross-sectional and longitudinal glucose metabolic deficits in Alzheimer’s disease: pathophysiologic implications. Arch Neurol 1992; 49:1142–1150Crossref, Medline, Google Scholar
3 Brown DR, Hunter R, Wyper DJ, et al.: Longitudinal changes in cognitive function and regional cerebral function in Alzheimer’s disease: a SPECT blood flow study. J Psychiatr Res 1996; 30:109–126Crossref, Medline, Google Scholar
4 Sachdev P, Gaur R, Brodaty H, et al.: Longitudinal study of cerebral blood flow in Alzheimer’s disease using single photon emission tomography. Psychiatry Res 1997; 68:133–141Crossref, Medline, Google Scholar
5 Lehtovirta M, Kuikka J, Helisalmi S, et al.: Longitudinal SPECT study in Alzheimer’s disease: relation to apolipoprotein E polymorphism. J Neurol Neurosurg Psychiatry 1998; 64:742–746Crossref, Medline, Google Scholar
6 Kogure D, Matsuda H, Ohnishi T, et al.: Longitudinal evaluation of early Alzheimer’s disease using brain perfusion SPECT. J Nucl Med 2000; 41:1155–1162Medline, Google Scholar
7 Duara R, Grady C, Haxby J, et al.: Positron emission tomography in Alzheimer’s disease. Neurology 1986; 36:879–887Crossref, Medline, Google Scholar
8 Jagust WJ, Friedland RP, Budinger TF, et al.: Longitudinal studies of regional cerebral metabolism in Alzheimer’s disease. Neurology 1988; 38:909–912Crossref, Medline, Google Scholar
9 Haxby JV, Grady CL, Koss E, et al.: Longitudinal study of cerebral metabolic asymmetries and associated neuropsychological patterns in early dementia of the Alzheimer type. Arch Neurol 1990; 47:753–760Crossref, Medline, Google Scholar
10 Friston KJ, Holmes AP, Worsely KJ, et al.: Statistical parametric maps in functional imaging: a general linear approach. Human Brain Mapp 1995; 2:189–210Crossref, Google Scholar
11 Stern RG, Mohs RC, Davidson M, et al.: A longitudinal study of Alzheimer’s disease: measurement, rate, and predictors of cognitive deterioration. Am J Psychiatry 1994; 151:390–396Crossref, Medline, Google Scholar
12 Burns A, Jacoby R, Levy R: Progression of cognitive impairment in Alzheimer’s disease. J Am Geriatr Soc 1991; 39:39–45Crossref, Medline, Google Scholar
13 McKhann G, Drachman D, Folstein M, et al.: Clinical diagnosis of Alzheimer’s disease: report of the NINCDS-ADRDA Work Group under the auspices of the Department of Health and Human Services Task Force on Alzheimer’s Disease. Neurology 1984; 34:939–944Crossref, Medline, Google Scholar
14 Hughes CP, Berg L, Danziger WL, et al.: A new clinical scale for the staging of dementia. Br J Psychiatry 1982; 140:566–572Crossref, Medline, Google Scholar
15 Mori E, Lee K, Yasuda M, et al.: Accelerated hippocampal atrophy in Alzheimer’s disease with apolipoprotein E epsilon4 allele. Ann Neurol 2002; 51:209–214Crossref, Medline, Google Scholar
16 Sano M, Devanand DP, Richards M, et al.: A standardized technique for establishing onset and duration of symptoms of Alzheimer’s disease. Arch Neurol 1995; 52:961–966Crossref, Medline, Google Scholar
17 Folstein MF, Folstein SE, McHugh PR: “Mini-Mental State”: a practical method for grading the cognitive state of patients for the clinician. J Psychiatr Res 1975; 12:189–198Crossref, Medline, Google Scholar
18 Mohs RC, Rosen WG, Davis KL: The Alzheimer’s Disease Assessment Scale: an instrument for assessing treatment efficacy. Psychopharmacol Bull 1983; 19:448–450Medline, Google Scholar
19 Hirono N, Mori E, Ishii K, et al.: Regional hypometabolism related to language disturbance in Alzheimer’s disease. Dement Geriatr Cogn Disord 1998; 9:68–73Crossref, Medline, Google Scholar
20 Hirono N, Mori E, Yasuda M, et al.: Lack of association of apolipoprotein E epsilon4 allele dose with cerebral glucose metabolism in Alzheimer disease. Alzheimer Dis Assoc Dis 1998; 12:362–367Crossref, Medline, Google Scholar
21 Hirono N, Mori E, Ishii K, et al.: Frontal lobe hypometabolism and depression in Alzheimer’s disease. Neurology, 1998; 50:380–383Crossref, Medline, Google Scholar
22 Hirono N, Mori E, Ishii K, et al.: Alteration of regional cerebral glucose utilization with delusions in Alzheimer’s disease. J Neuropsychiatry Clin Neurosci 1998; 10:433–439Link, Google Scholar
23 Hirono N, Mori E, Ishii K, et al.: Hypofunction in posterior cingulate gyrus correlates with disorientation for time and place in Alzheimer’s disease. J Neurol Neurosurg Psychiatry 1998; 64:552–554Crossref, Medline, Google Scholar
24 Hirono N, Mori E, Ishii K, et al.: Neuronal substrates for semantic memory: a positron emission tomography study in Alzheimer’s disease. Dement Geriatr Cogn Disord 2001; 12:15–21Crossref, Medline, Google Scholar
25 Hirono N, Hashimoto M, Yasuda M, et al. The effect of APOE epsilon4 allele on cerebral glucose metabolism in AD is a function of age at onset. Neurology 2002; 58:743–750Crossref, Medline, Google Scholar
26 Ishii K, Sasaki M, Kitagaki H, et al.: Reduction of cerebellar glucose metabolism in advanced Alzheimer’s disease. J Nucl Med 1997; 38:925–928Medline, Google Scholar
27 Ishii K, Willoch F, Minoshima S, et al.: Statistical brain mapping of 18F-FDG PET in Alzheimer’s disease: validation of anatomic standardization for atrophied brains. J Nucl Med 2001; 42:548–557Medline, Google Scholar
28 Minoshima S, Frey KA, Foster NL, et al.: Preserved pontine glucose metabolism in Alzheimer disease: a reference region for functional brain image (PET) analysis. J Comput Assist Tomogr 1995; 19:541–547Crossref, Medline, Google Scholar
29 Minoshima S, Giordani B, Berent S, et al.: Metabolic reduction in the posterior cingulate cortex in very early Alzheimer’s disease. Ann Neurol 1997; 42:85–94Crossref, Medline, Google Scholar
30 Ishii K, Sasaki M, Yamaji S, et al.: Demonstration of decreased posterior cingulate perfusion in mild Alzheimer’s disease by means of H215O positron emission tomography. Eur J Nucl Med 1997; 24:670–673Medline, Google Scholar
31 Matsuda H, Kitayama N, Ohnishi T, et al.: Longitudinal evaluation of both morphologic and functional changes in the same individuals with Alzheimer’s disease. J Nucl Med 2002; 43:304–311Medline, Google Scholar
32 Braak H, Braak E: Neuropathological stageing of Alzheimer-related changes. Acta Neuropathol (Berl) 1991; 82:239–259Crossref, Medline, Google Scholar
33 Baron JC, Chetelat G, Desgranges B, et al.: In vivo mapping of gray matter loss with voxel-based morphometry in mild Alzheimer’s disease. Neuroimage 2001; 14:298–309Crossref, Medline, Google Scholar
34 Ishii K, Sasaki M, Yamaji S, et al.: Relatively preserved hippocampal glucose metabolism in mild Alzheimer’s disease. Dement Geriatr Cogn Disord 1998; 9:317–322Crossref, Medline, Google Scholar
35 Ibanez V, Pietrini P, Alexander GE, et al.: Regional glucose metabolic abnormalities are not the result of atrophy in Alzheimer’s disease. Neurology 1998; 50:1585–1593Crossref, Medline, Google Scholar